Amazon Web Services monitoring
- Latest Dynatrace
- Explanation
- 2-min read
Dynatrace automatically discovers, baselines, and intelligently monitors Amazon Web Services cloud environments.
Monitoring and problem detection
Dynatrace AWS monitoring performs AI-based automatic business impact, problem detection, and root cause analysis for all AWS services based on all metrics published to Amazon CloudWatch. This analysis can be additionally extended by full-stack monitoring provided by OneAgent deployed on compute resources such as Amazon EC2, AWS Lambda, and Kubernetes. All of the entities can also be subject to comprehensive log analysis.
In addition to the above, Dynatrace enables the understanding of workload applied AWS resources and environment dynamics per region.
The AWS monitoring is available for all Dynatrace customers, regardless of whether their Dynatrace cluster is SaaS-based or Managed.
Ease of use and convenient visualization
Amazon Web Services monitoring comes with consistent out-of-the-box metrics, dashboards, and alerts immediately after monitoring is enabled.
The measurements and analysis of core AWS services are visualized on a purpose-built infographics dashboard (see the gallery). Convenient reports and dashboards are also available for business impact analysis and topology maps.
Flexibility
The Dynatrace users can select which services and instances are monitored and how this process is performed. This selection can be done as part of the initial monitoring setup or at any later point. This also applies to new services enabled on the AWS cloud or added by Amazon.
It is possible to choose monitoring metrics for each of the supporting services. Equally, all the dashboards for AWS monitoring can be cloned and easily customized as needed.
Hybrid environments
Tracking of services and dependencies is not limited to AWS. Thanks to Dynatrace Intelligence and its ability to process data from all types of environments, Dynatrace is optimized for monitoring hybrid environments, including business applications spanning across multiple cloud and virtualization platforms such as Microsoft Azure, Google Cloud, VMware, Kubernetes, Openshift, and on-premises infrastructure.
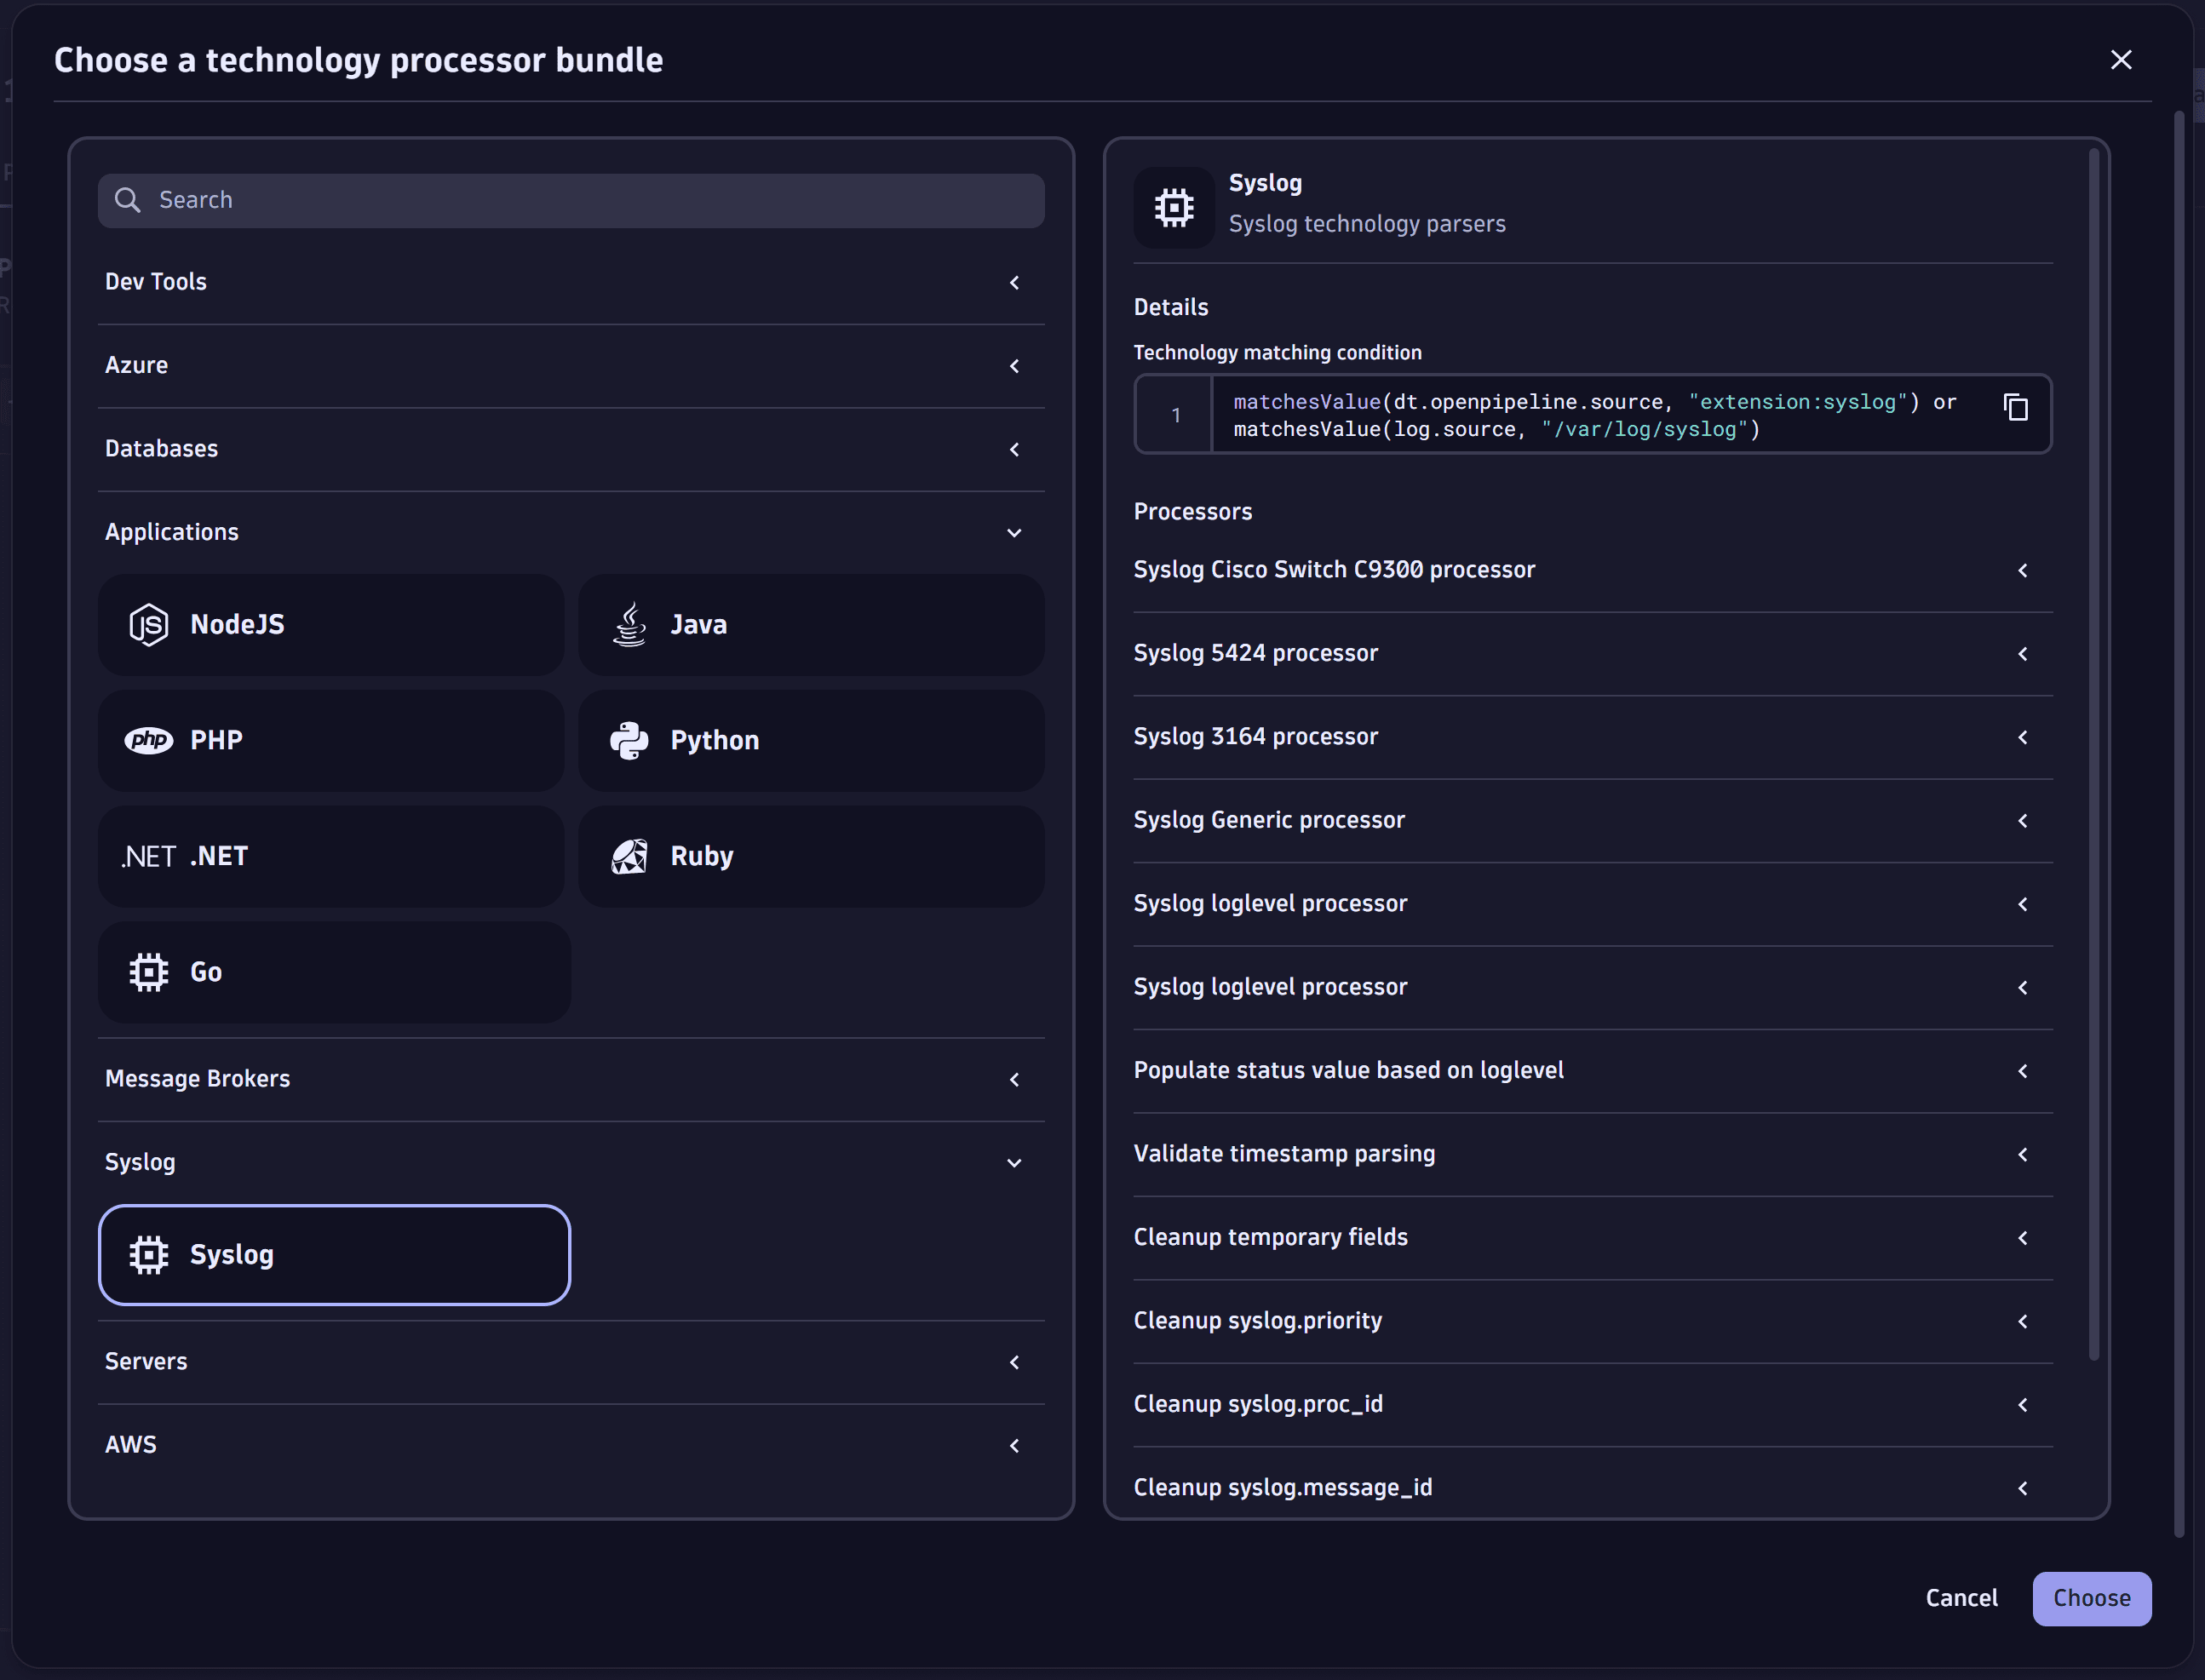
Process logs with technology bundle parsers
Through OpenPipeline, you can use and configure technology bundles. A technology bundle is a library of parsers (processing rules) that process logs from various technologies, such as Java, .NET, and Microsoft IIS.
Parsers help you to improve filtering, troubleshooting, metrics, alerts, and dashboards by efficiently extracting log levels and relevant attributes. You can also use technology bundles to structure logs from technologies that are not supported by Dynatrace out of the box.
For more information, see Process logs with technology bundle parsers.
Get started with AWS Platform Monitoring
Latest Dynatrace
To start monitoring your AWS environment, follow the step-by-step AWS monitoring guide to connect your AWS account, configure credential management, and enable monitoring for your services.