Create calculated metrics for web applications in RUM Classic
- Dynatrace Classic
- How-to guide
- 2-min read
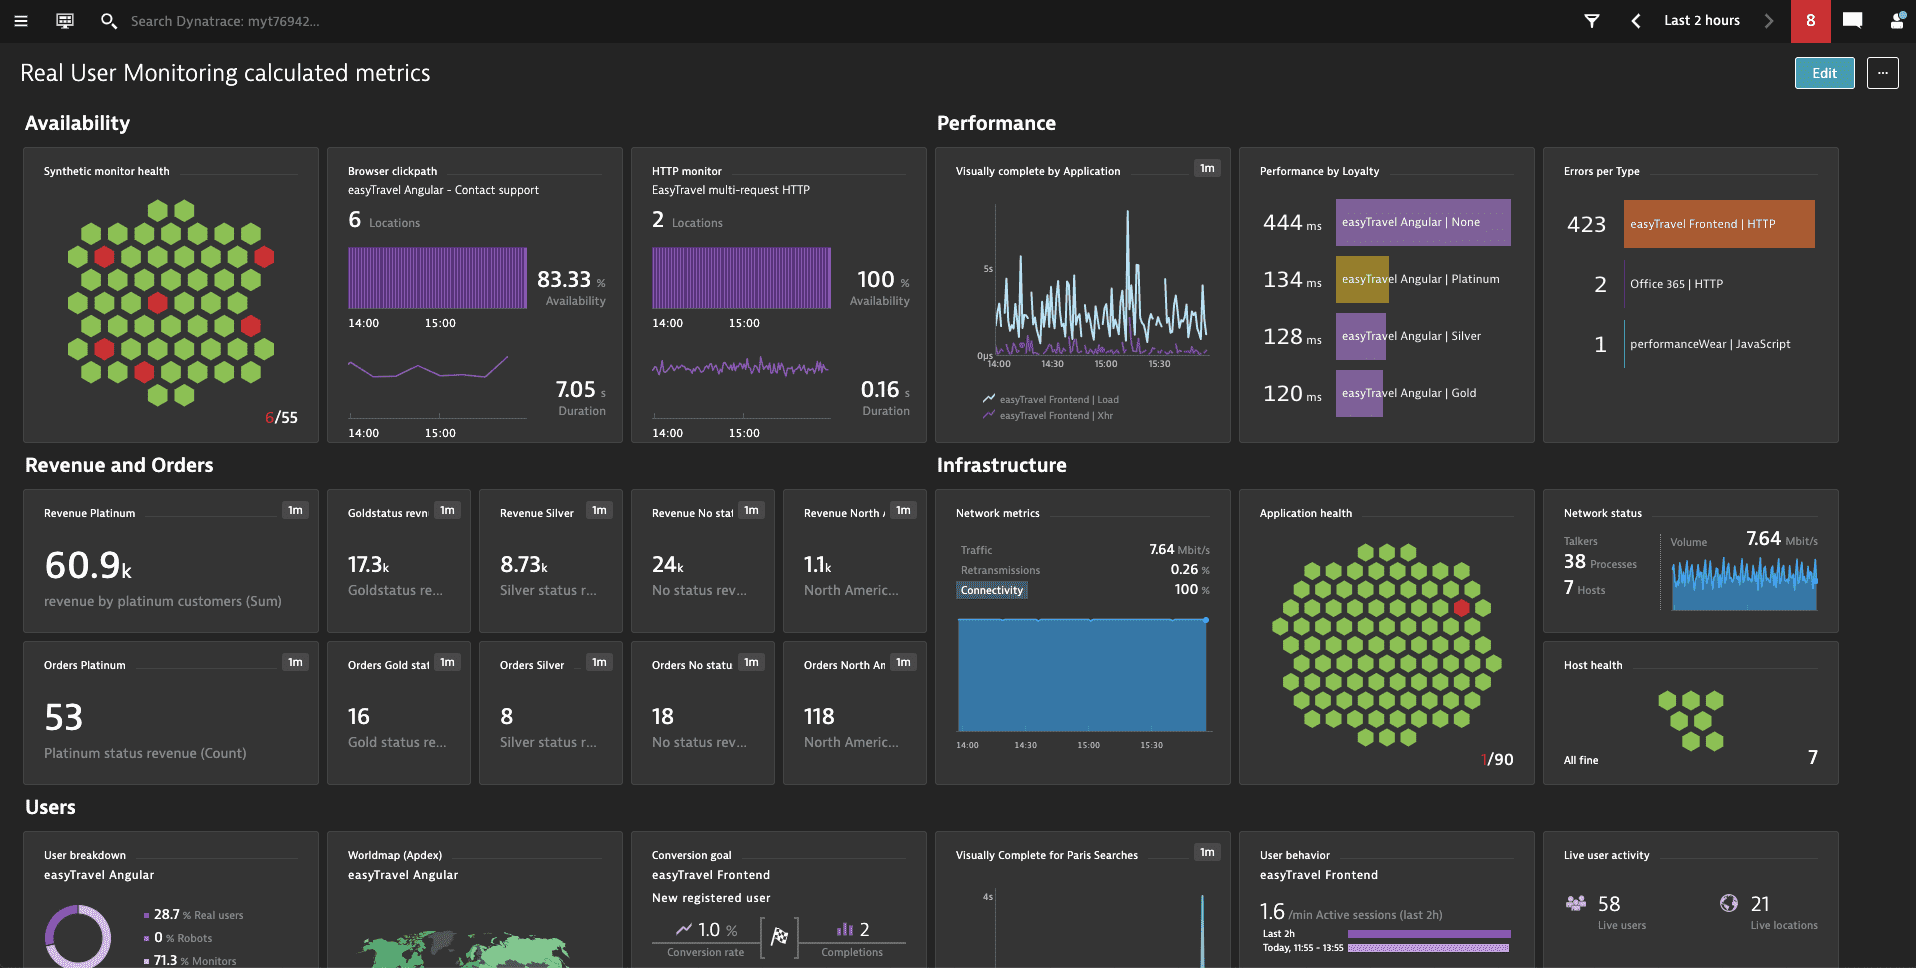
In Dynatrace, you can create calculated metrics to make your current analysis available for charting and API usage. You can also leverage calculated metrics to add custom alerts.
Once you select the application you're interested in, you can use Multidimensional Analysis to select aspects of your user actions and create a calculated metric. You can choose if you want to split your selected performance metrics by another dimension, such as geolocation, browser, and error type, or only use single dimensions, such as user action properties.
Create a metric
To create a calculated metrics from your application
-
Go to Web and select the application for which you want to create a metric.
-
Scroll down to Impact of user actions on performance and select Analyze performance.
-
On the User action analysis page, select the desired timeframe, options, and filters.
-
Select one of the Analyze by options and a performance metric that you want to create the metric for.
-
Optional Use the filter bar to add filters for geolocations, browser versions, user action properties, and more to focus the resulting metric on what you're interested in.
-
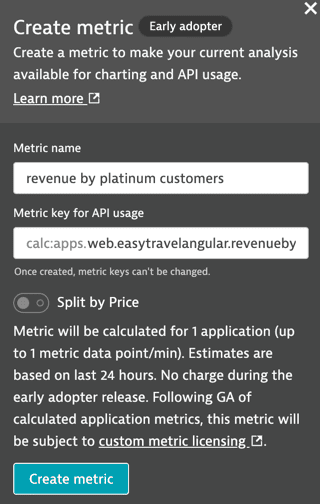
Select Create metric.
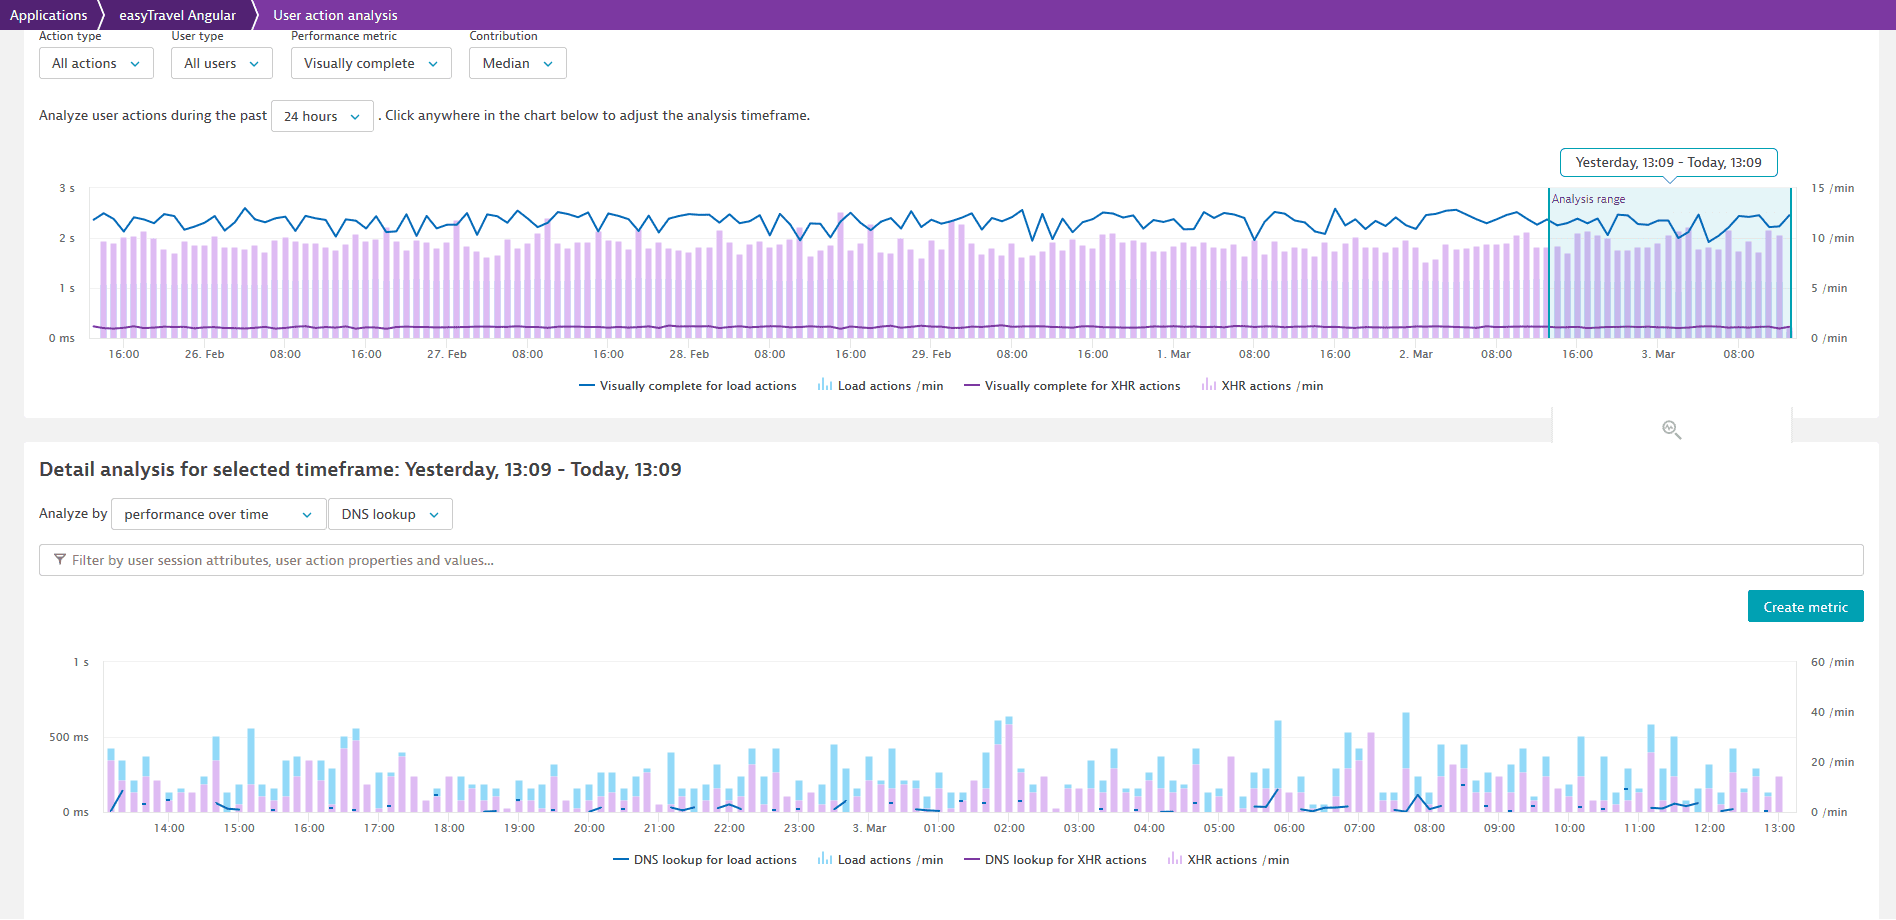 Creating a metric on the Multidimensional analysis page
 -
Optional Change the metric name and key and turn on Split by <dimension name>.
-
Optional Select Advanced options if you want to additionally specify or change the following parameters.
- Metric
- Metric name
- Metric key for API usage
- Filters
- Split-by parameters
-
Select Create metric.
Use the metric to create a custom chart or alert.
Only new data is written to calculated metrics; retrospective data is not included.
You can have up to 500 enabled calculated metrics per environment across all applications and up to 100 enabled calculated metrics per application.
Example
In this example, let's analyze Price, which is a user action property, and filter it by Loyalty status, which is another user action property.
On the Multidimensional analysis page, select the timeframe for the analysis. To filter out prices paid by platinum customers only, we select Price in the Analyze by list box and then set additional filters by selecting String property, Loyalty status, and Platinum.
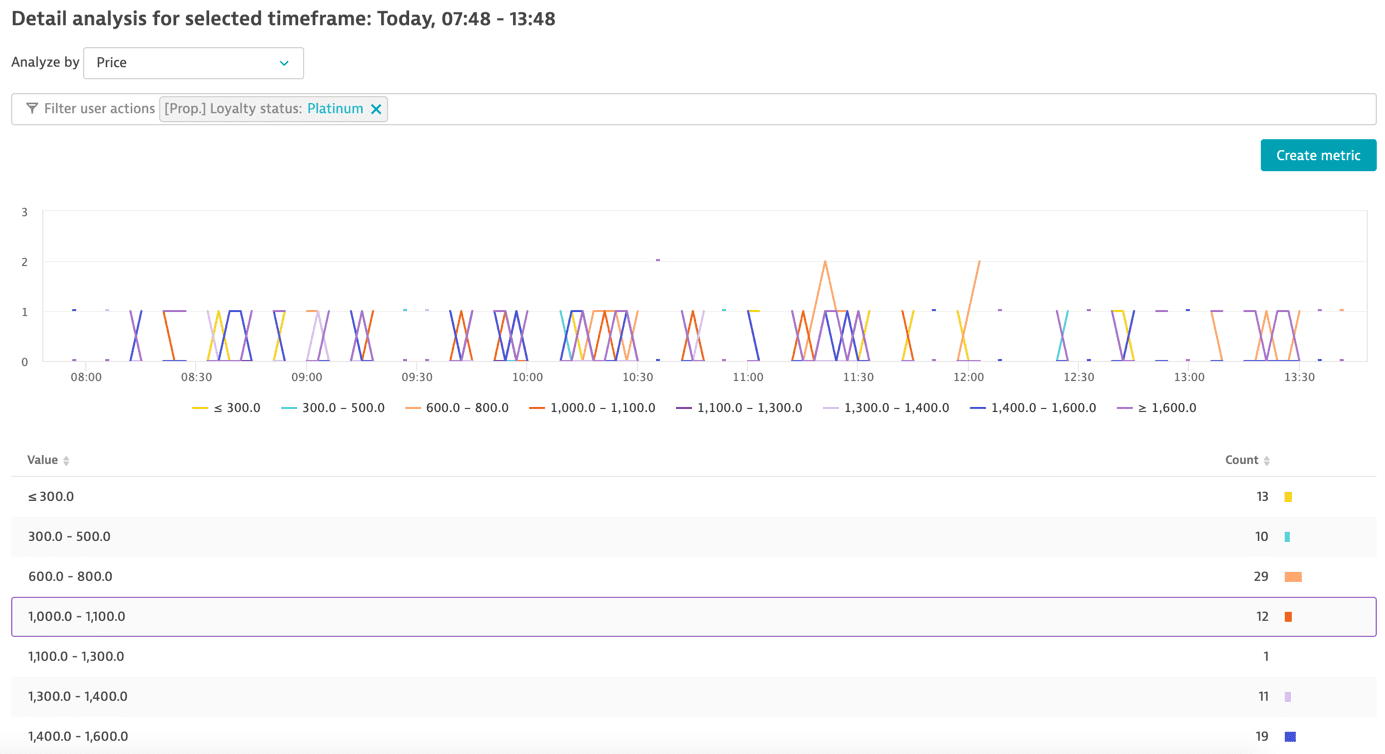
We can also create a metric and generate a custom chart.
Create custom charts based on calculated metrics
Creating charts can help you to analyze combinations of application metrics directly on your dashboard. You can split and filter available entities to fine-tune the metric dimensions that appear in your charts and filter out entities that are relevant to you.
For details on creating charts and pinning them to your dashboards, see Data Explorer.
Manage metrics
After you've created a calculated metric, you can view its properties, delete it, temporarily disable it, or create a chart or a metric event for it.
Once a metric has been created, you can't change its properties.
- Go to Web.
- Select the application that you want to configure.
- In the upper-right corner of the application overview page, select More (…) > Edit.
- From the application settings, select Metrics.
- Select the metric you want to manage and check its properties or perform one of the following actions.
- Enable or disable
 the metric
 - Copy the API URL for the metric
- Create a chart with Data Explorer
- Create alert to create a metric event
- Analyze to open the multidimensional analysis view for the metric
- Delete metric
- Enable or disable