Check user experience metrics for mobile applications
- How-to guide
- 1-min read
- Published Jul 19, 2017
Your application user experience metrics provide a quick overview of the number of users who are actively using your application during the selected timeframe.
To access the user experience metrics for your application
- Go to Frontend.
- Select the application that you want to analyze.
- Examine the User experience tile, which is selected by default.
The User experience tile shows the total number of users, overall Apdex rating, and user action rate for the selected timeframe.
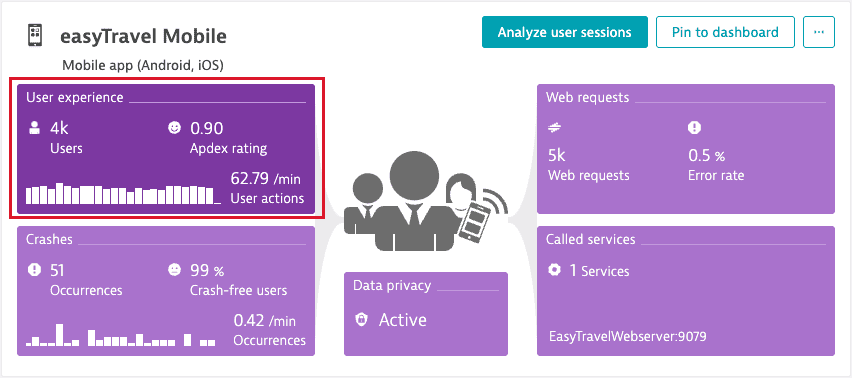
The detailed information on your application's Apdex rating trends, active users, new users, and application version distribution is available in the corresponding sections.
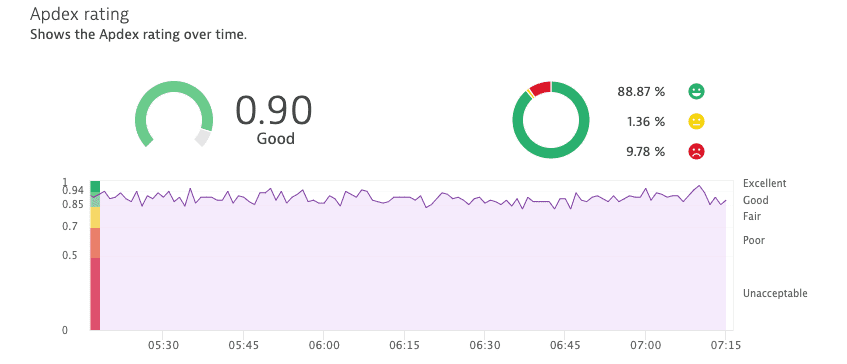
Apdex rating
The Apdex rating chart shows your application's average Apdex rating trends for the selected timeframe.
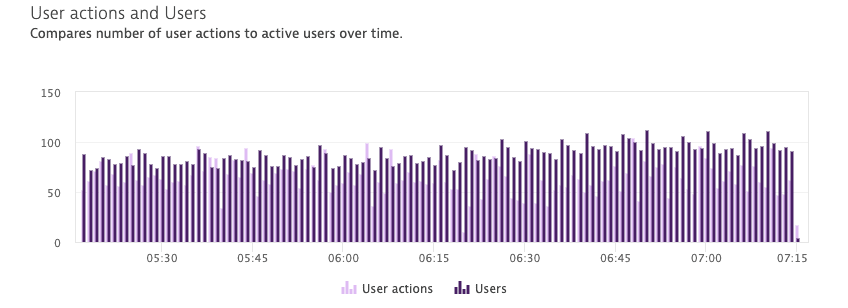
User actions and Users
The User actions and Users chart compares the number of user actions to active users for the selected timeframe.
New users
The New users chart shows how many users launched your application for the first time during the selected timeframe. This metric only counts the first session following the launch of your instrumented application. Application updates and Dynatrace library updates don't trigger state resets for returning users. This metric is tied to specific devices, so users are counted multiple times if they install the application on multiple devices.
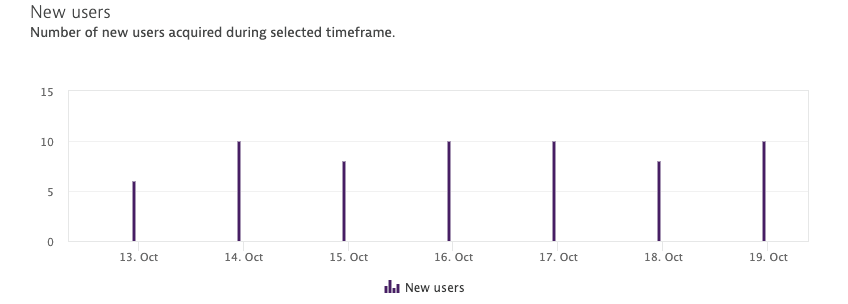
The New users metric doesn't distinguish between multiple users that share the same device and application installation.
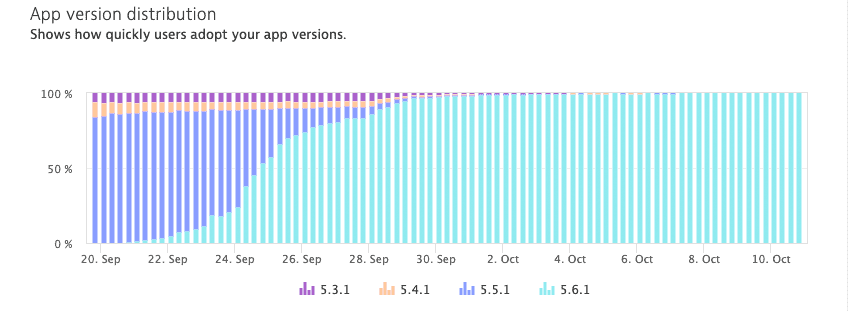
App version distribution
The App version distribution chart conveys the rate of version adoption by comparing the number of application sessions that originate from various application versions. This chart is particularly interesting following the release of new application versions, as it enables you to track adoption of the latest version.
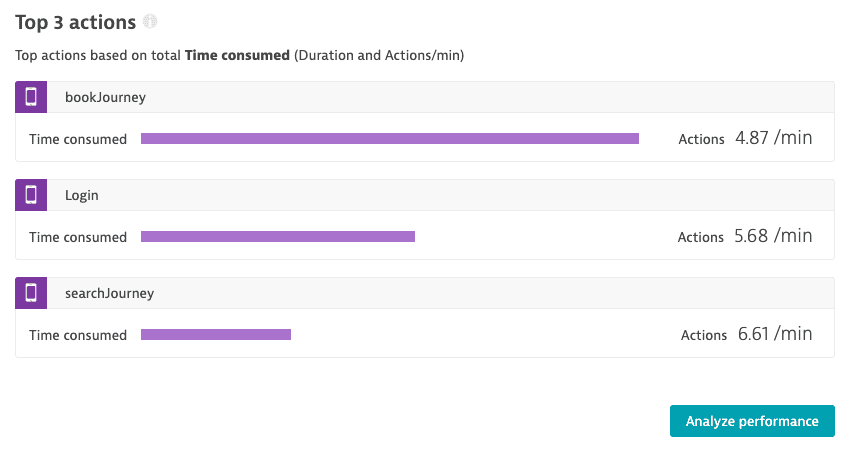
Top 3 actions
The list displays the top three actions based on user action duration and user action rate.
User action overview page
From the Top 3 actions list on your application overview page, select a user action to open the user action overview page.
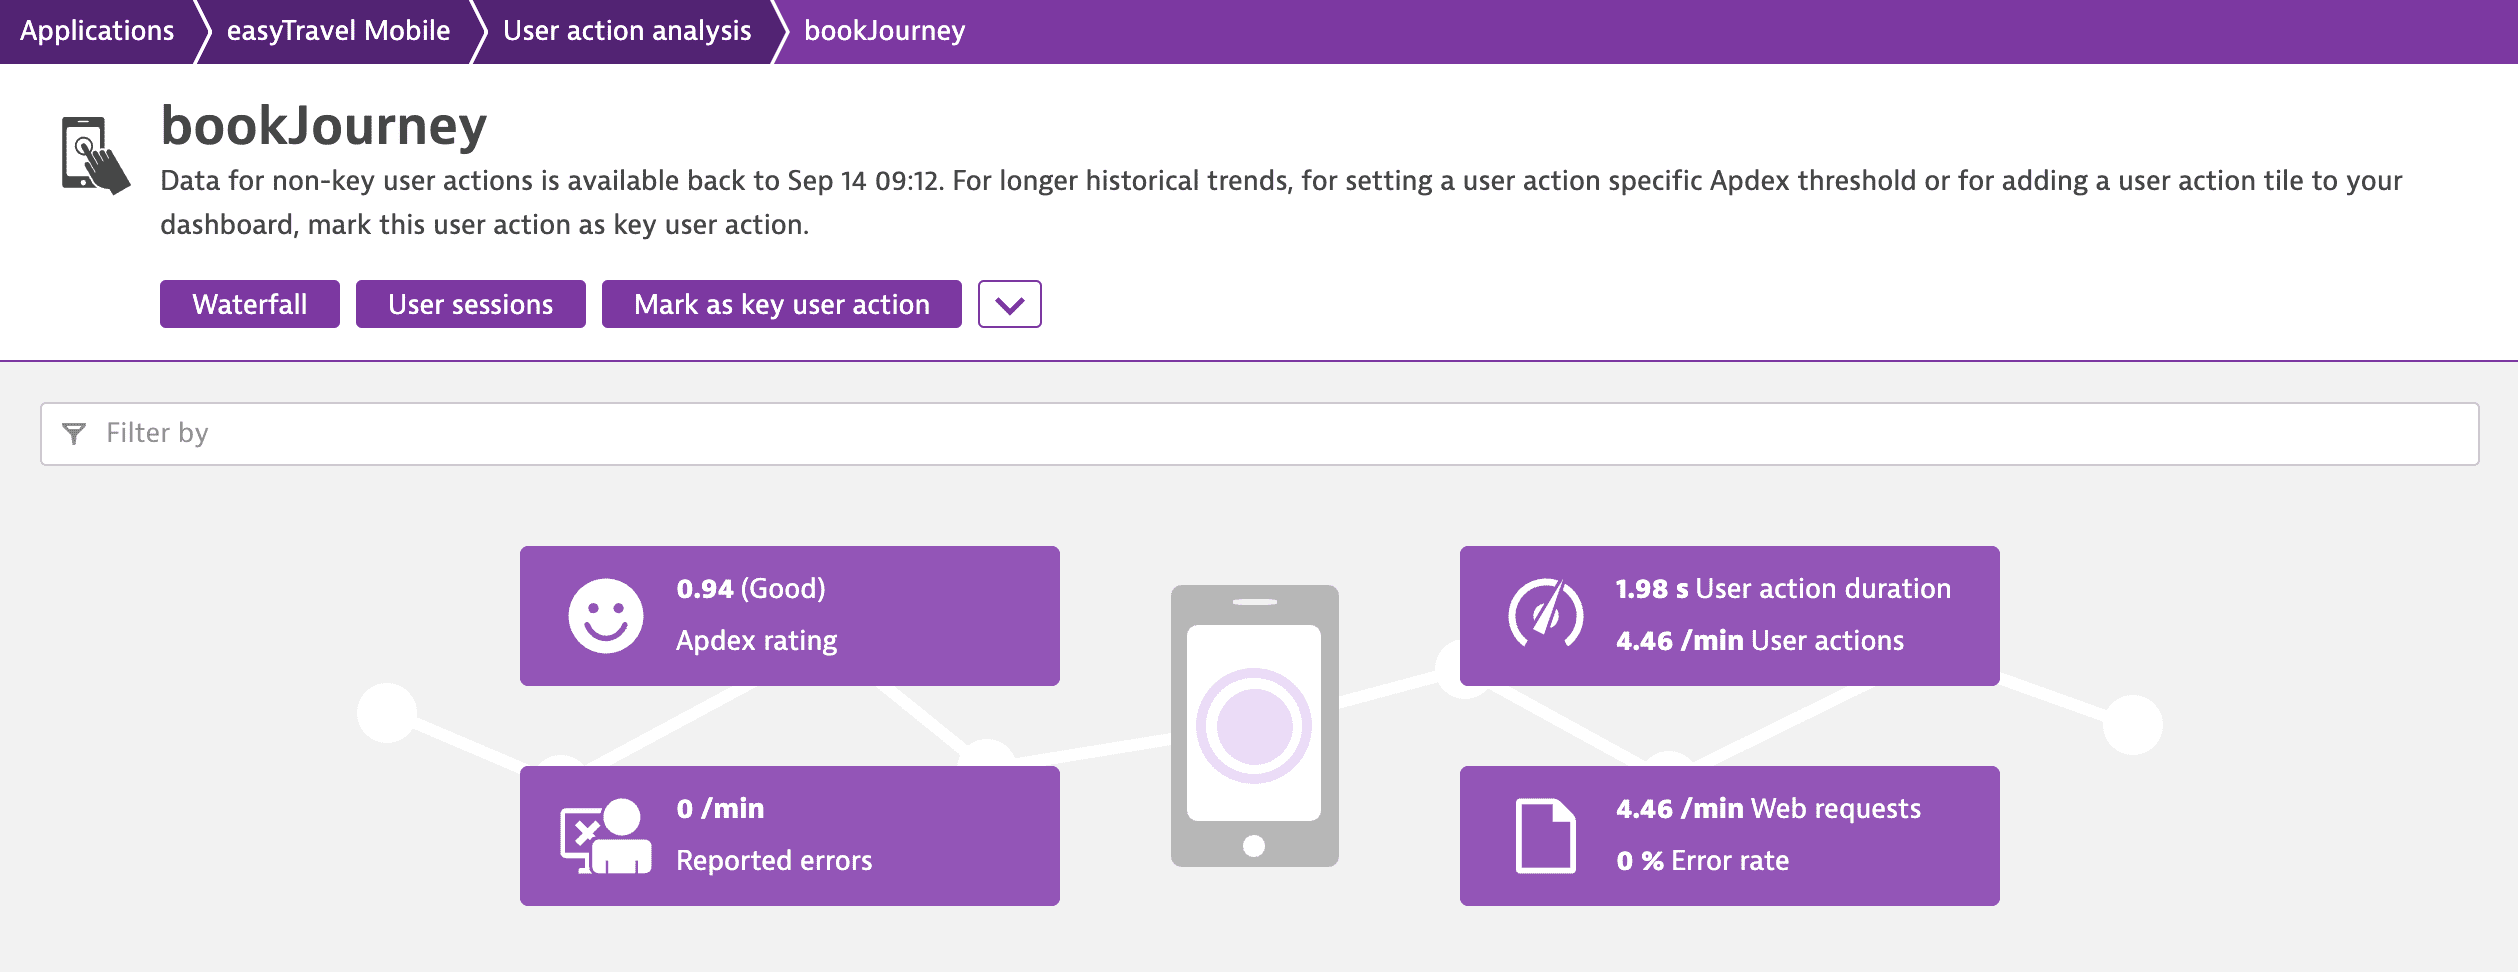
On this page, you can mark the action as a key user action, perform a waterfall analysis, and view the action Apdex rating and performance.
You can also study the lists of reported errors and web request errors for the current action. Select the error you're interested in to open its details page.
Multidimensional user action analysis
Under the Top 3 actions list on your application overview page, select Analyze performance to go to the multidimensional User action analysis page.
The multidimensional analysis enables you to dig deep into your user actions and view data across numerous dimensions. On the User action analysis page, you can create metrics, view your application's key user actions, and examine the top 100 user actions based on different criteria. You can also analyze your application by the operating system, geolocation, application version, and more.
Web request errors and reported errors
From the multidimensional User action analysis page, you can also examine the list of web request errors or reported errors: Select Web request errors over time or Reported errors over time from the Analyze by text field. The list of errors shows up under the chart. Expand the error you're interested in and then select Analyze error to view the error details page.
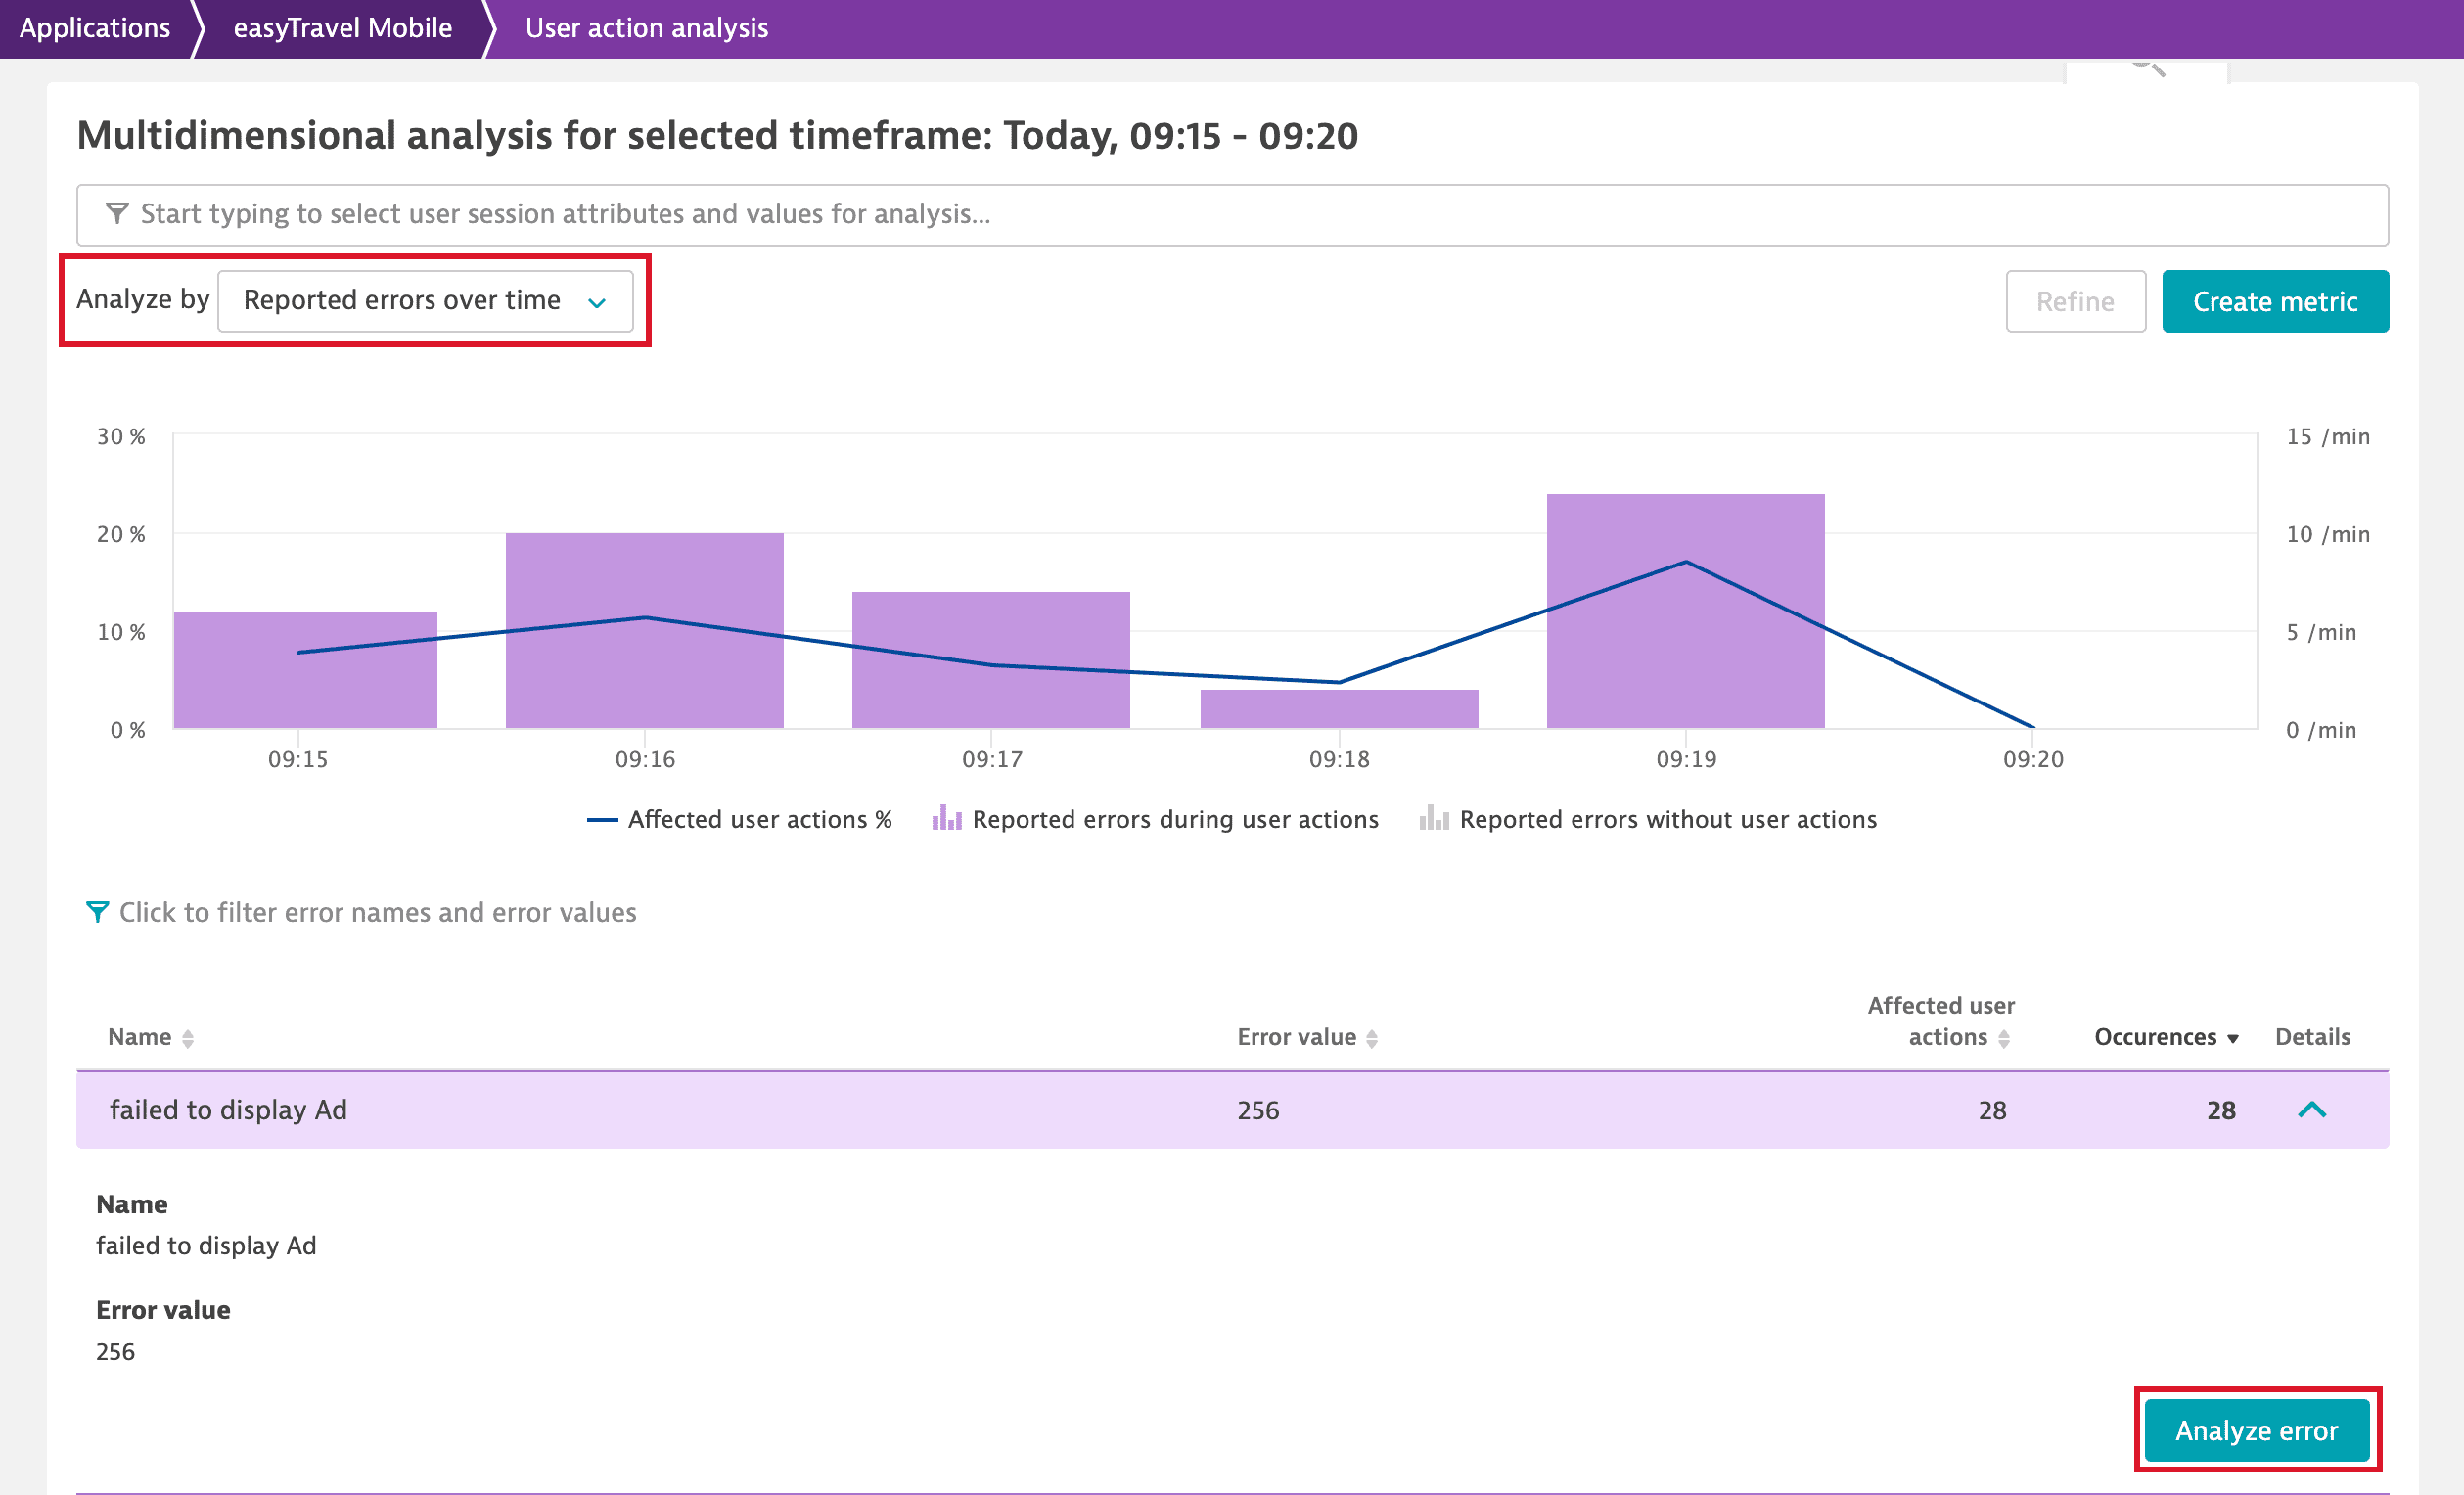
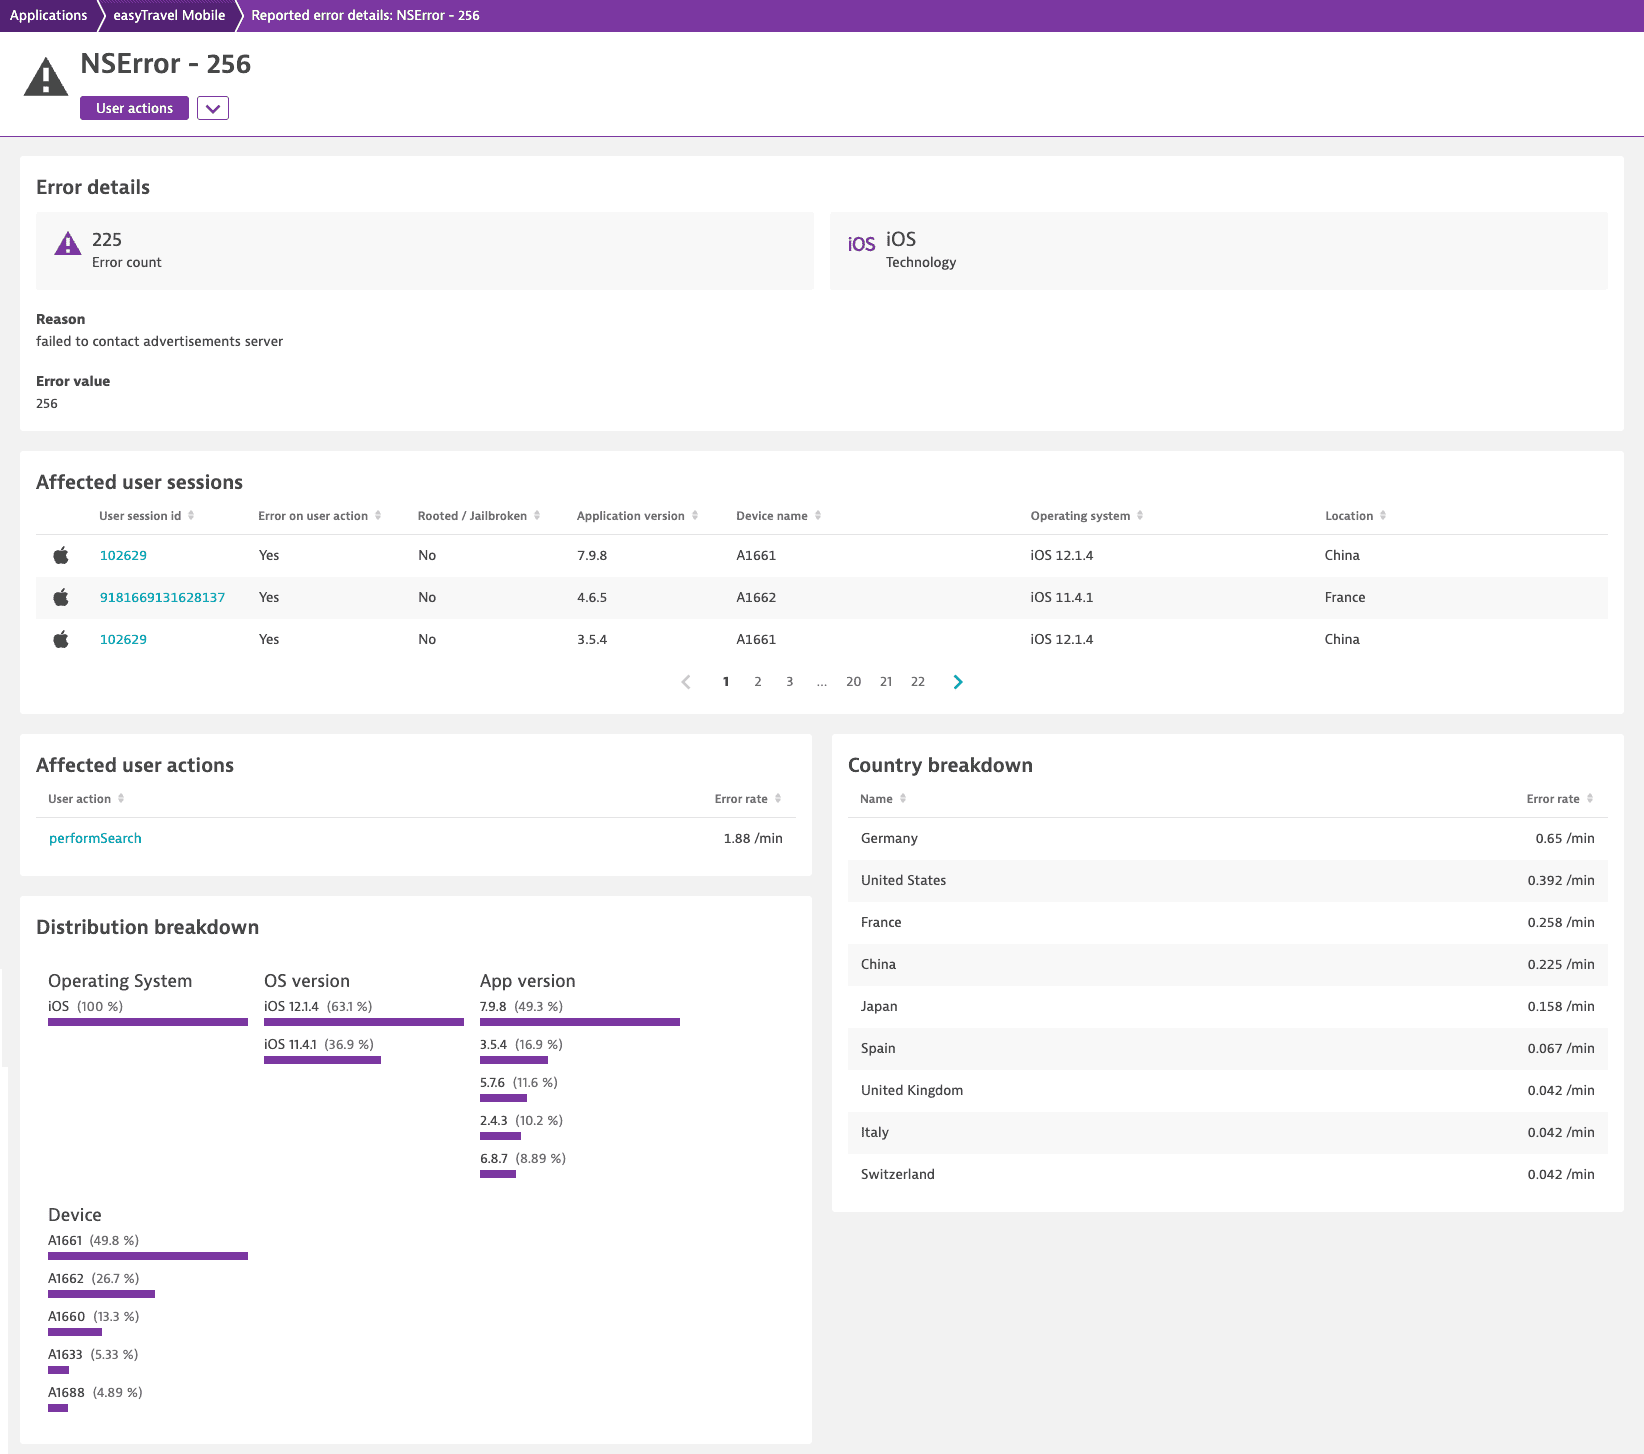
Error details page
The error details page provides valuable information about your application's errors.
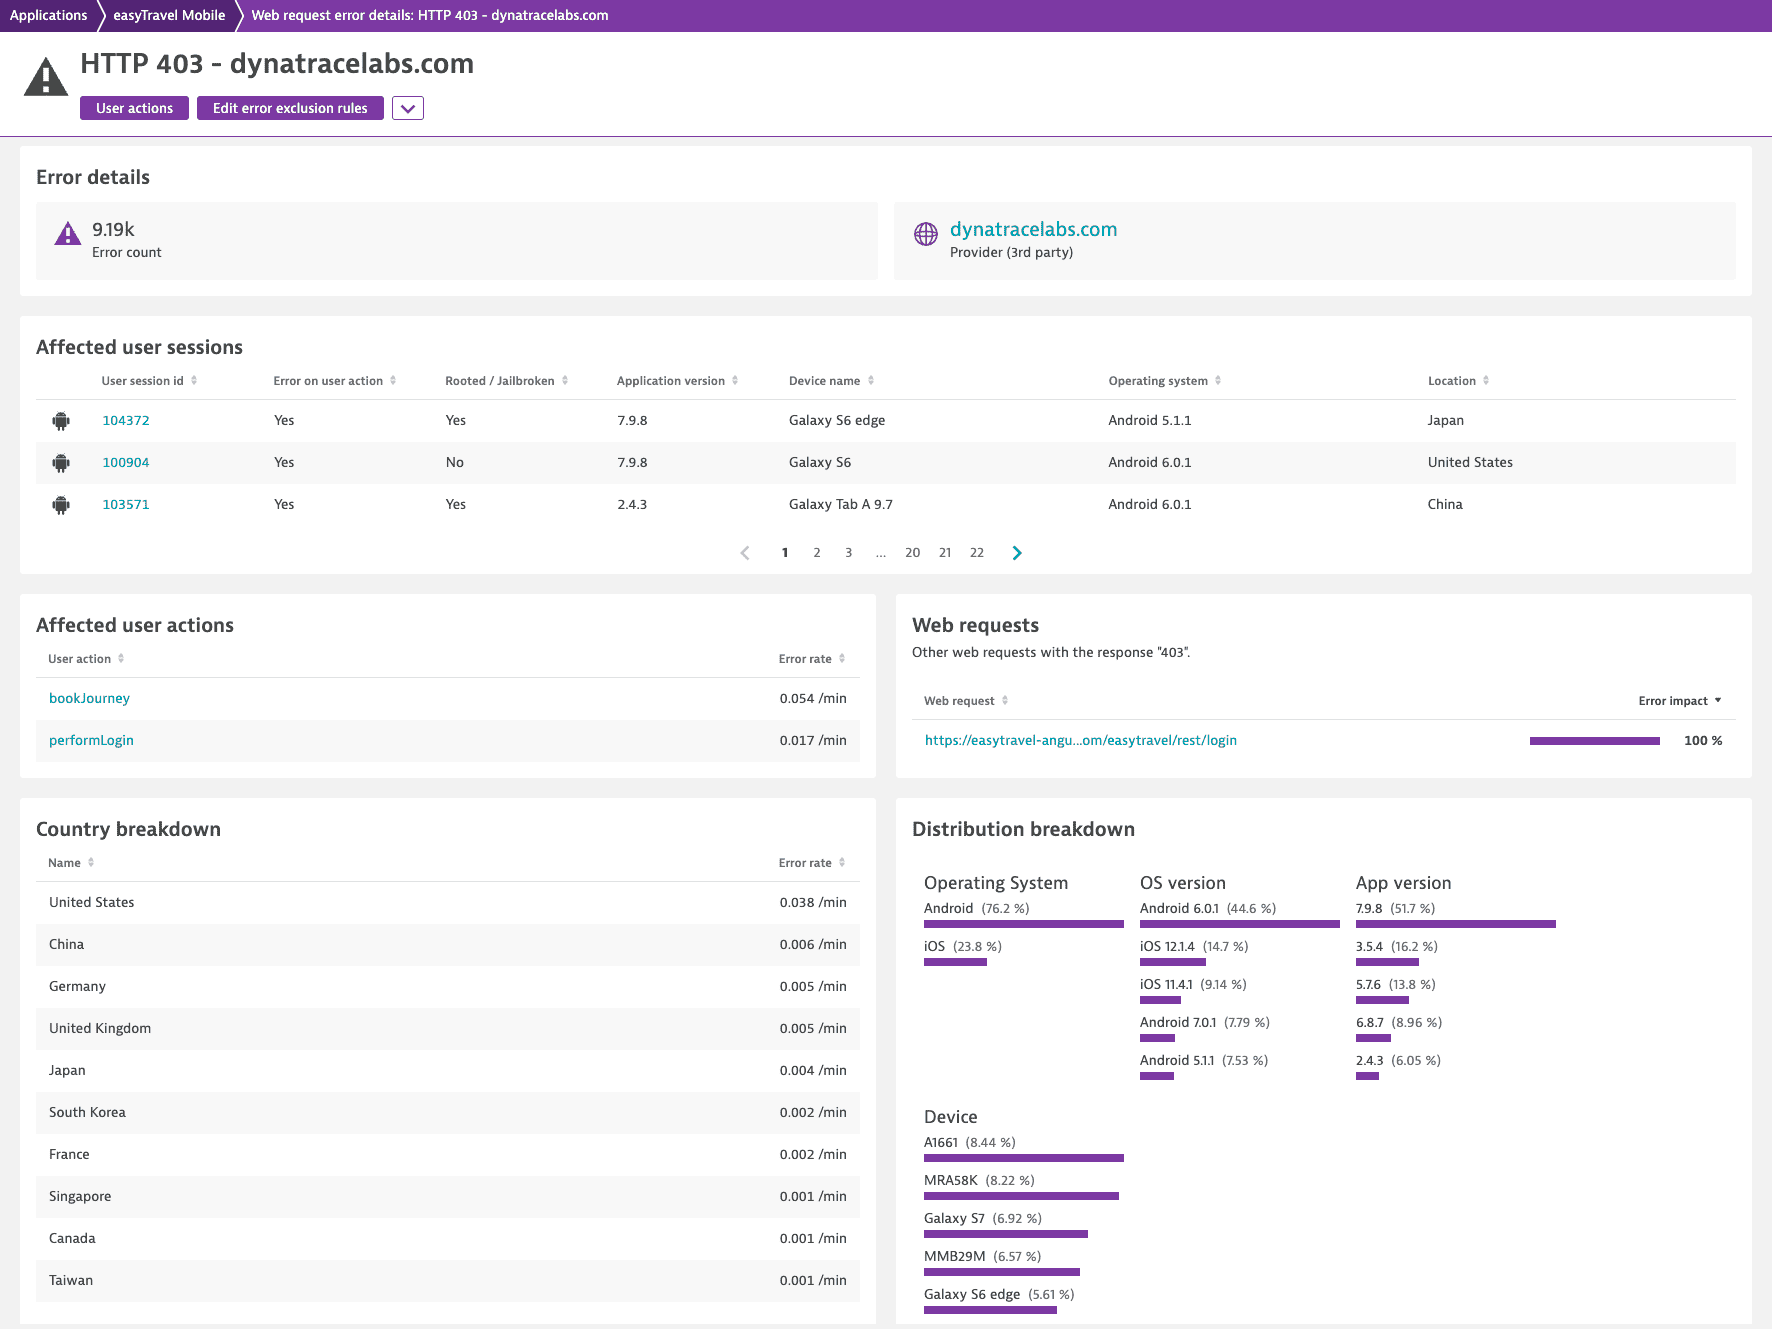
This displays error details such as the estimated error count, provider (for a request error), technology (for a reported error), and more. The page also lists affected user sessions and affected user actions—select a user action or user session to view its details. The distribution breakdown displays information on the relative frequencies of operating systems, OS versions, application versions, and devices, while the country breakdown shows all affected countries and their corresponding error rate.
For web request errors, you can also configure error exclusion rules if you don't want Dynatrace to flag a particular HTTP status code as erroneous. Select Edit error exclusion rules to go to the corresponding settings page.
Geographic regions
The Geographic regions world map, which is on your application overview page, visualizes all the geographic regions from which your users originate. For each country, you can view the number of active sessions, active users, and crashes, as well as the overall Apdex rating.
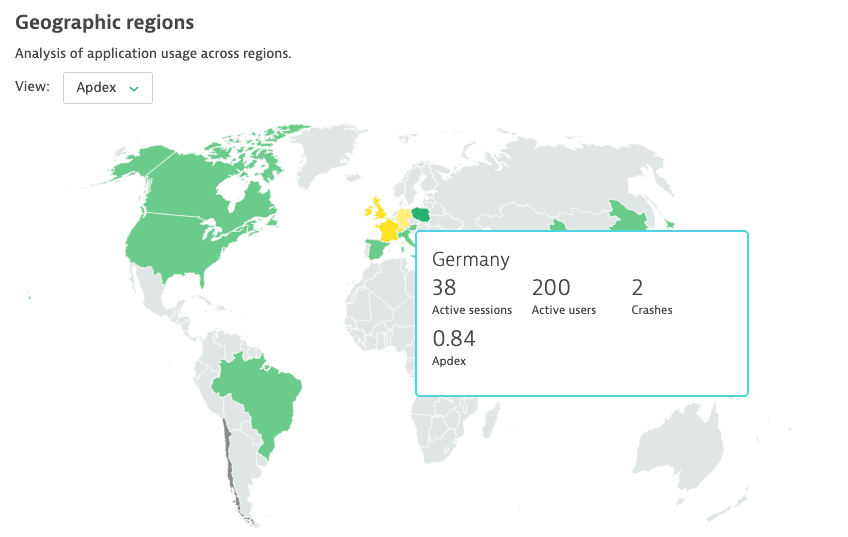
If you don't see data on the world map, you might need to map your internal IP addresses to locations.
 Mobile