Business event metric extraction via classic pipeline
- Dynatrace Classic
- How-to guide
- 3-min read
With business event metric extraction via the classic pipeline, you can create your own business metrics. It enables you to:
- Create custom alerts, such as when a certain value surges or drops. Alerts can be based on attribute values or specific business event occurrences.
- Reduce your DDU consumption and lower your costs.
You need to create your business metrics before ingesting business event data.
Configure metric extraction
To add a business event metric
-
Go to
 Settings > Business Observability > Metric extraction.
 -
Select Add business event metric and name your metric by adding a metric Key starting with the
bizevents.prefix (for example,bizevents.EasyTrade.TradingVolume). -
Add a Matcher to your rule by pasting your matcher-specific DQL query. In the above example, to calculate your trading volume metric, you need to extract only buy transactions, so the matcher query is as follows.
matchesValue(event.type, "com.easytrade.buy-assets") -
Choose the Measure on which your metric will be based. There are two options.
-
Occurrence of business events records—a count of events that match your DQL query
-
Attribute value—a collection of measures for the attribute value of business events that match your DQL query
Specify your attribute name in the Attribute field. Attribute name matching is not case sensitive. For example, if you choose
Trading_Volume, the specified attribute name for metric extraction should betrading_volume. However, be sure to use the exact attribute name of your business event.
-
-
Select Add dimension. Adding dimensions allows you to split the business event occurrences by a specific business event attribute such as a hostname. If the attribute contains more than one value, the first attribute value acts as the metric dimension. The maximum number of dimensions is 50. Be sure to use the exact attribute name of your business event.
-
Select Save changes.
Visualize metrics
You can extract and visualize your metrics to use them further in your analysis. You can also create metric-based alerts tailored to your needs.
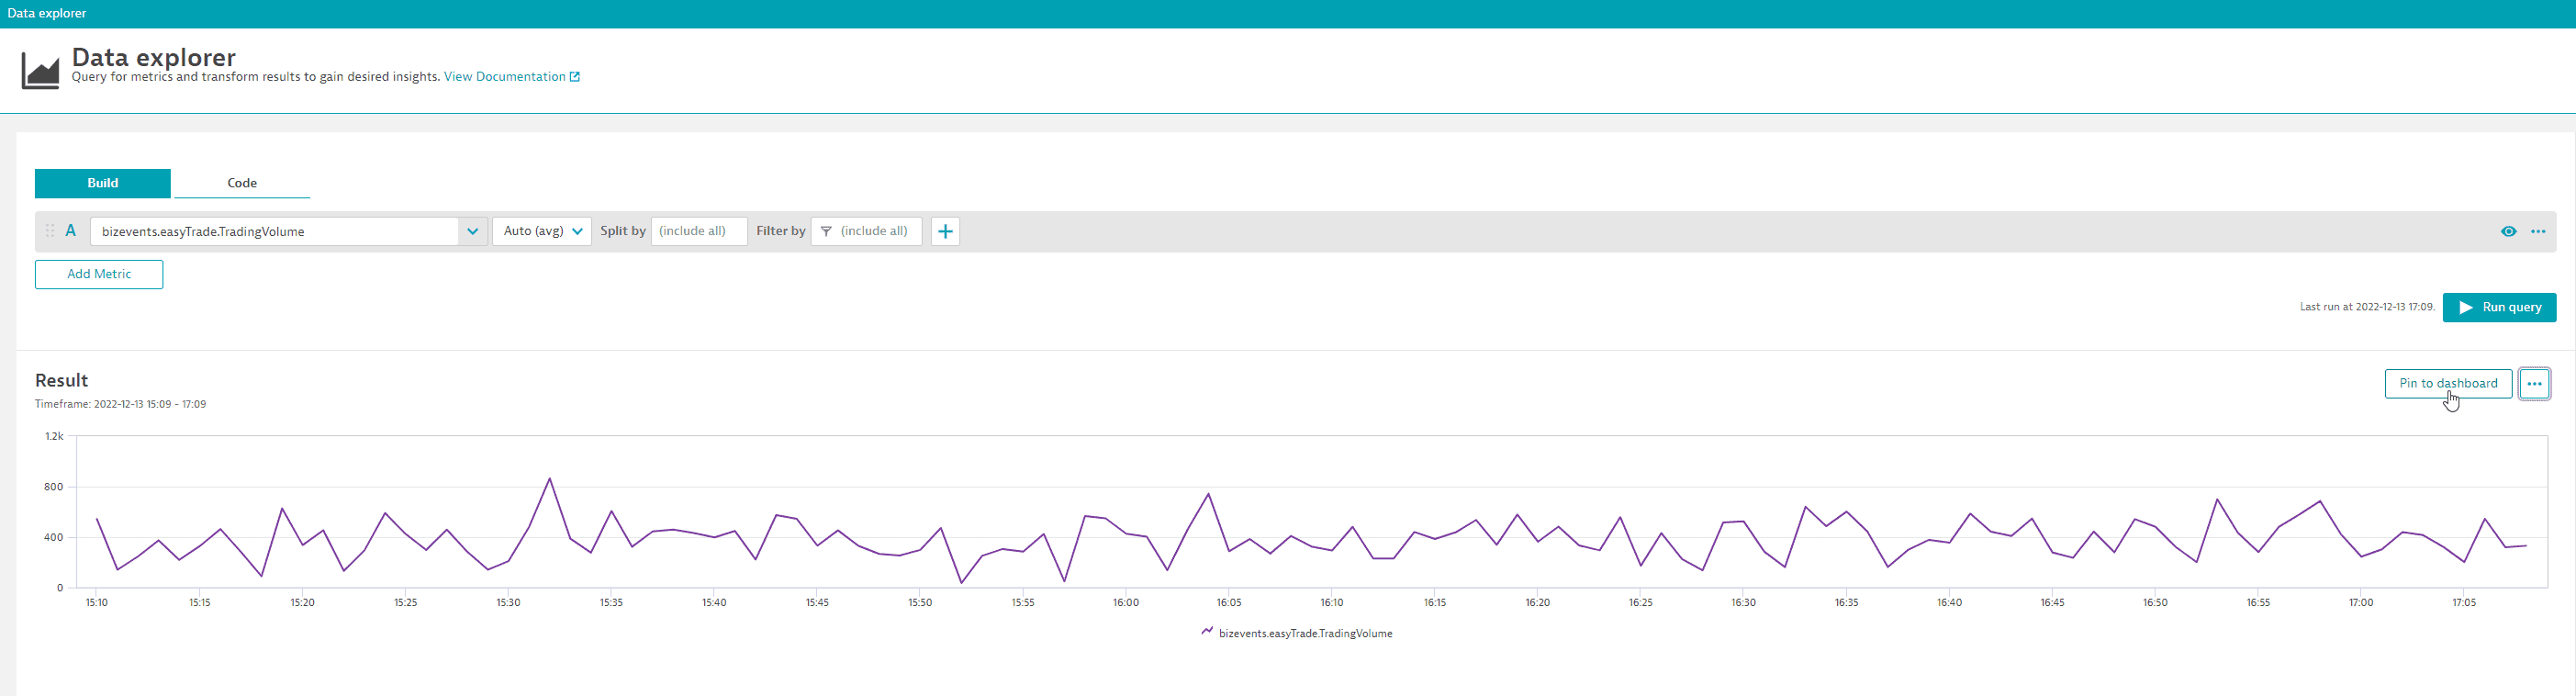
Display metrics in Data Explorer
To display business event metrics
-
Go to Data Explorer.
-
Find your metric in the search window, select Run query, and display the results.
You can also:
- Visualize your metric on a classic dashboard by selecting Pin to dashboard.
- Export your data to a CSV file.
- Share a link.
- Copy the request.
See the example visualization below.
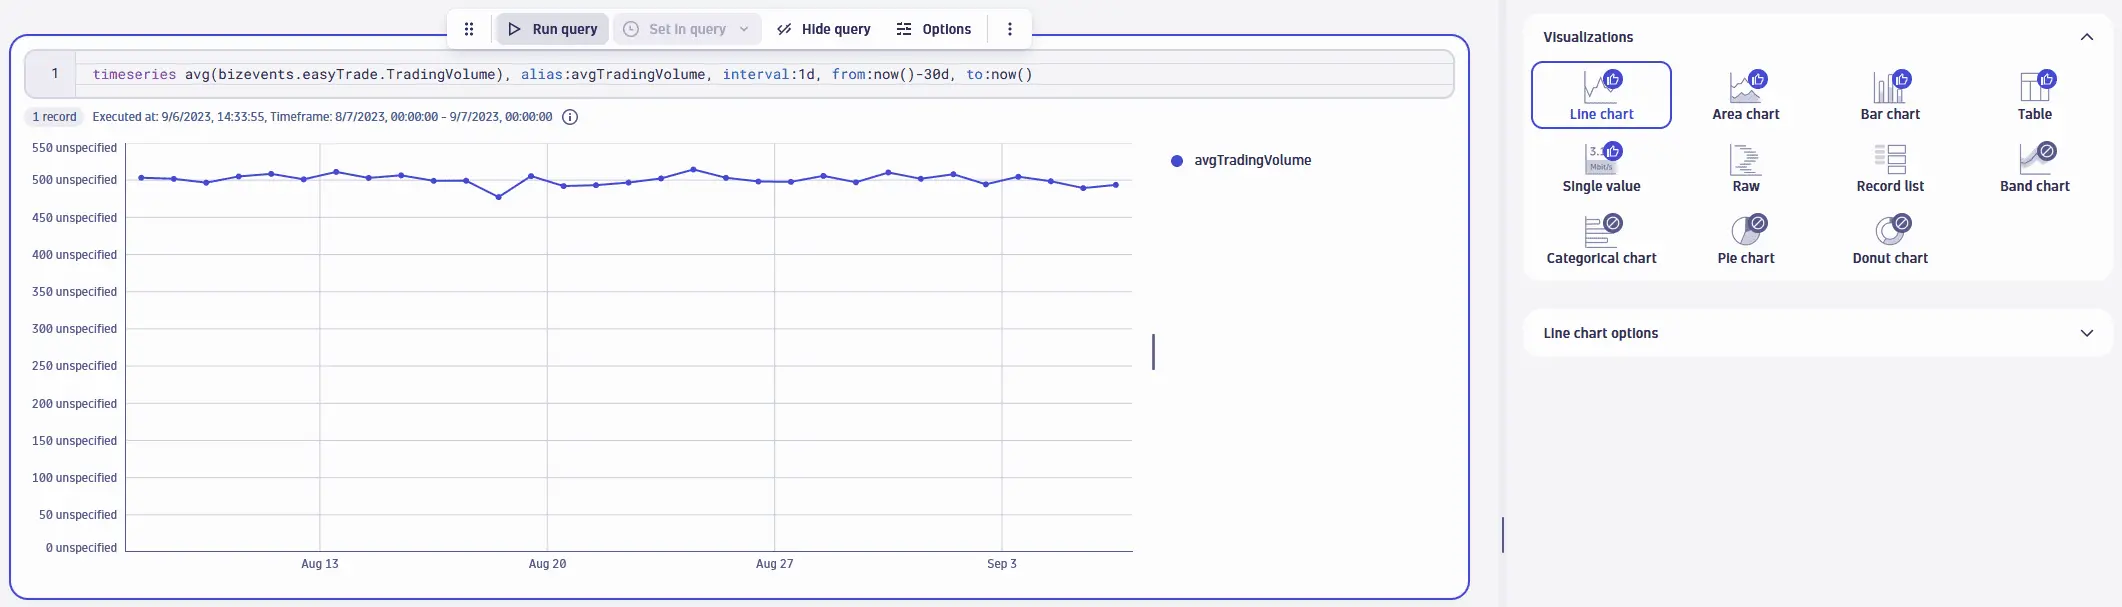
Display metrics in Notebooks 
You can also explore custom metrics based on business events in Grail, for example, by using the DQL timeseries command. The following is an example DQL timeseries query against the bizevents.easyTrade.TradingVolume metric.
timeseries avg(bizevents.easyTrade.TradingVolume), alias:avgTradingVolume, interval:1d, from:now()-30d, to:now()
Run this query in Notebooks (Query Grail > Run query) and view results using the recommended Line chart visualization option.
Create alerts with metrics
To create alerts based on business event metrics
-
Go to
Settings > Anomaly detection > Metric events. -
Select Add metric event and create a custom event where Type is Metric selector. This is the metric key defined earlier, for example,
bizevents.EasyTrade.TradingVolume.Metric events based on business events are only supported with metric selector queries. See Metric selector events for more information.
Unrecognized timestamp handling
If the event timestamp doesn't fall within the allowed range, your metric is replaced in Grail by a metric with the .failed suffix added to the metric key. This new metric will have a recent timestamp, (now()) and the dimension that would have been attached to the metric you wanted to extract. You can also visualize this metric in Data Explorer or Notebooks.