Test pipeline observability
- Latest Dynatrace
- Tutorial
- 9-min read
This guide presents a straightforward method for utilizing Dynatrace to observe and analyze test pipelines effectively. Aimed at both technical and non-technical stakeholders, it focuses on how to efficiently monitor test activities, enabling teams to concentrate on critical aspects of the testing process.
Using observability tools from Dynatrace, redundant data is minimized, allowing for a clear focus on relevant and impactful test events. This approach helps to simplify the testing workflow, leading to a more streamlined and focused operation. Discover how Dynatrace can help you gain clearer insights into your test pipelines, enhancing overall efficiency and productivity.
Target audience
This article is primarily designed for development teams, DevOps engineers, and quality assurance (QA) professionals who are involved in managing and monitoring test pipelines.
Ideal readers are those who are familiar with basic testing processes and have a general understanding of software development practices. While deep expertise in Dynatrace is not required, a fundamental knowledge of its observability tools will be beneficial.
This guide aims to assist those responsible for ensuring the efficiency and effectiveness of testing procedures in their organizations, particularly those looking to enhance their monitoring capabilities and gain more insightful data from their test pipelines.
Scenario
In a fast-paced software development environment, a team of developers and QA engineers faces the challenge of efficiently managing and monitoring their test pipelines. Their current setup involves multiple testing as well as pipeline tools and frameworks, leading to fragmented data and difficulty in obtaining a comprehensive view of the testing lifecycle. This fragmentation hinders their ability to quickly identify and address failing tests, impacting the overall efficiency of the development process.
The team seeks a solution that allows them to centralize test-related data, providing a clear overview of the entire testing pipeline. They want to be alerted only about significant test failures or anomalies, reducing the noise from routine test results. The ideal solution would automatically notify responsible team members about failing tests, offering insights into potential root causes and suggested actions for remediation. Additionally, they aim to minimize manual monitoring of test pipelines, enabling developers and QA engineers to focus more on addressing critical issues rather than sifting through test data.
By implementing the Test Pipeline Observability solution from Dynatrace, the team can achieve these objectives. This approach will allow them to ingest test execution data and metadata from various tools into a centralized platform. With analytics provided by Dynatrace, they can set up dashboards for real-time monitoring and automate the detection of test anomalies. The solution will provide clear visibility into test results, trends, and potential issues, enhancing the team's ability to maintain high-quality software releases.
Prerequisites
Make sure all of these are true before you start:
Access and permissions
- You should have the necessary permissions to configure and access monitoring tools within Dynatrace.
- You should have access and utilize test execution data from various testing tools for ingestion into Dynatrace.
- You can integrate Dynatrace with various testing tools and frameworks used in your pipeline.
Knowledge
- You understand how Dynatrace works.
- You know how to set up Dynatrace Dashboards and alerting systems.
- You know how to ingest test-related events and metadata into Dynatrace, particularly using the Dynatrace API or similar data ingestion methods.
- You know how to set up automated workflows in Dynatrace for automating responses to test pipeline events.
- You have basic understanding of software testing processes and the typical structure of test pipelines in a software development environment.
- You have knowledge of network and data security practices to ensure safe and secure data transmission and storage within the Dynatrace environment.
Steps
The following steps use business events to implement the test pipeline observability use case. This approach is valid for now, but we plan a new event kind for events occurring during the software development lifecycle of a software component. This new event kind will replace business events in the future.
-
Gather and ingest test execution data
Based on your source test pipeline tools and frameworks, collect test execution data. Ingest this data as business events into Dynatrace using the Business events API. For example, you can code helpers or post to business events API directly.
Show me a code example
#!groovy/*** Sends biz_event to a given Dynatrace environment.* @param monitoringTenant url to monitoring environment* @param oauthClientId OAuth client id* @param oauthClientSecret OAuth client secret* @param payload biz_event payload* @return*/def call(def monitoringTenant,def oauthClientId,def oauthClientSecret,def payload) {// Get Access Token via OAuth - see https://developer.dynatrace.com/develop/access-platform-apis-from-outside/ for referencedef ssoResponse = sh(script: """set +xcurl --location --request POST 'https://sso.dynatrace.com/sso/oauth2/token' \\--header 'Content-Type: application/x-www-form-urlencoded' \\--data-urlencode 'grant_type=client_credentials' \\--data-urlencode 'client_id=${oauthClientId}' \\--data-urlencode 'client_secret=${oauthClientSecret}' \\--data-urlencode 'scope=storage:events:write'set -x""", returnStdout: true).trim()// Note: readJSON needs pipeline-utility-steps -> https://www.jenkins.io/doc/pipeline/steps/pipeline-utility-steps/#readjson-read-json-from-files-in-the-workspacedef ssoResponseJSON = readJSON(text: ssoResponse)if (ssoResponseJSON.errorCode) {error(message: "Authentication failed: ${ssoResponse}")}def accessToken = ssoResponseJSON.access_token// Ingest BizEventprintln("Sending BizEvent: ${payload}")sh(script: """set +xcurl --location --request POST '${monitoringTenant}/platform/classic/environment-api/v2/bizevents/ingest' \\--header 'Content-Type: application/json' \\--header 'Authorization: Bearer ${accessToken}' \\--data-raw '${payload}'set -x""")}The data submitted in events depends on your specific goal. You can send each test execution results as a business event, adding the critical information as the payload. This way, you're able to trigger workflows and Grail will store all your important text execution to be queried by DQL for ad-hoc analysis in Notebooks or as input for your dashboards.
-
Create a dashboard
Use DQL to present your data using available visualizations.
-
Set up a workflow
The workflow can be triggered on sending a business event after a test execution. Then, you can create follow-up actions based on the ingested test data. For instance, you can determine the owners of the failing property using the Ownership action and then notify the test owners about test results via a workflow Slack action.
Here's an example of a simple workflow sending the test execution results to a Slack channel:
-
Trigger the execution on a regular interval using CRON
-
Query the data ingested through the business event you set at the beginning of the tutorial Use the Execute DQL query built-in action. The DQL below fetches the data from
CS_TEST_EXECUTION_EVENTevents executed in the last 24 hours. The results are filtered to tests tagged asdata-quality-checks.fetch bizevents, from:now() - 24h| filter event.type == "CS_TEST_EXECUTION_EVENT"| filter contains(test.tags, "data-quality-checks") -
Run the custom JavaScript code to generate the message containing the data retrieved in the previous step.
Show me code
// optional import of sdk modulesimport { execution } from '@dynatrace-sdk/automation-utils';export default async function () {// your code goes here// e.g. get the current executionconst ex = await execution();const res = await ex.result("query_biz_events");const records = res.records;var message = "EXECUTED TESTS:";records.forEach((record, index) => {if (record["test.execution.result"] == "Success") {message += "\n " + "[ Owner: " + record["test.owner.name"] + " ] [ Team: " + record["test.owner.team"] + " ] [ Departement: " + record["test.owner.capability"] + " ]"message += "\n * " + record["test.name"] + " [" + record["test.execution.stage"] + "]" + " - :green_heavy_check_mark: *Success*";message += "\n * " + "Pipeline URL: " + record["sdlc.pipeline.run.url"];}});return message;}The code will generate a message as in the example below
EXECUTED TESTS:[ Owner: john.doe ] [ Team: my-team ] [ Departement: My departement ]* runtimeVulnerabilityAnalyticsTest [sprint] - :green_heavy_check_mark: *Success** Pipeline URL: https://yourserver.org/build/52435771 -
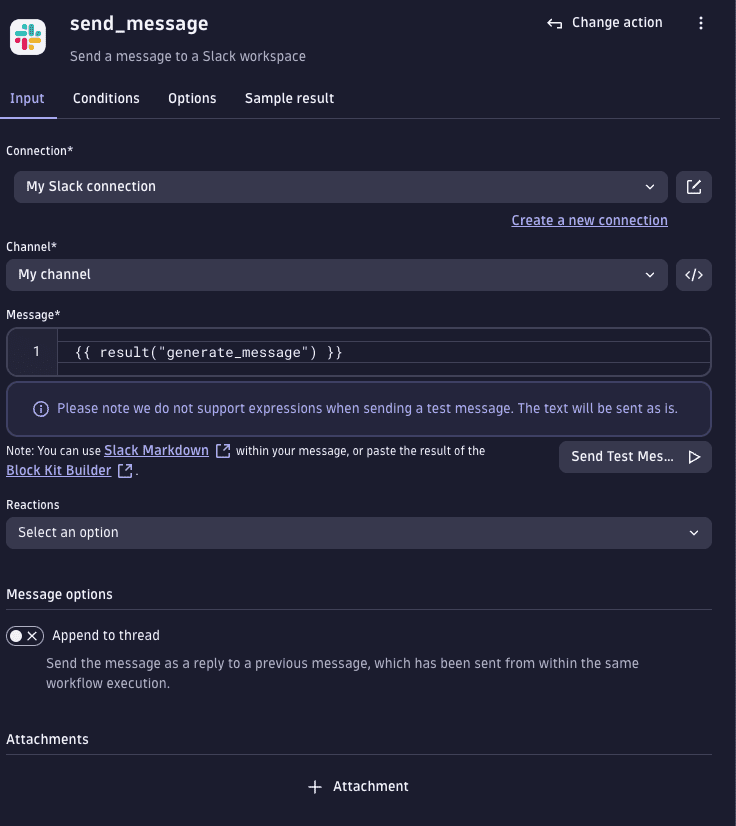
Use the Slack action to send the message to the test owner.
 Slack action
Show me the workflow template
metadata:version: "1"dependencies:apps:- id: dynatrace.automationsversion: ^1.269.0- id: dynatrace.slackversion: ^1.3.6inputs:- type: connectionschema: app:dynatrace.slack:connectiontargets:- tasks.send_message.connectionworkflow:title: E2E Test slack notificationstasks:send_message:name: send_messagedescription: Send a message to a Slack workspaceaction: dynatrace.slack:slack-send-messageinput:channel: C05UMMXSZ2Rmessage: '{{ result("generate_message") }}'reaction: []connection: ""workflowID: "{{ execution().workflow.id }}"channelType: idexecutionID: "{{ execution().id }}"executionDate: "{{ execution().started_at }}"appendToThread: falseselectedRequestType: 0attachmentToggleValue: noneposition:x: 0y: 3predecessors:- generate_messageconditions:states:generate_message: OKgenerate_message:name: generate_messagedescription: Build a custom task running js Codeaction: dynatrace.automations:run-javascriptinput:script: >-// optional import of sdk modulesimport { execution } from '@dynatrace-sdk/automation-utils';export default async function () {// your code goes here// e.g. get the current executionconst ex = await execution();const res = await ex.result("query_biz_events");const records = res.records;var message = "EXECUTED TESTS:";records.forEach((record, index) => {if (record["test.execution.result"] == "Success") {message += "\n " + "[ Owner: " + record["test.owner.name"] + " ] [ Team: " + record["test.owner.team"] + " ] [ Departement: " + record["test.owner.capability"] + " ]"message += "\n * " + record["test.name"] + " [" + record["test.execution.stage"] + "]" + " - :green_heavy_check_mark: *Success*";message += "\n * " + "Pipeline URL: " + record["sdlc.pipeline.run.url"];}});return message;}position:x: 0y: 2predecessors:- query_biz_eventsconditions:states:query_biz_events: OKquery_biz_events:name: query_biz_eventsdescription: Executes DQL queryaction: dynatrace.automations:execute-dql-queryinput:query: |-fetch bizevents, from:now() - 24h| filter event.type == "CS_TEST_EXECUTION_EVENT"| filter contains(test.tags, "data-quality-checks")position:x: 0y: 1predecessors: []description: ""trigger:schedule:rule: nulltrigger:type: croncron: 0 9 * * *timezone: Europe/ViennaisActive: trueisFaulty: falsenextExecution: 2024-02-01T08:00:00.000ZfilterParameters: {}inputs: {}schemaVersion: 3
-
-
Configure anomaly detection
You can also use the Forecast disk and resource utilization action in your workflow to detect anomalies in test/build executions, such as unusually long durations compared to historical data. This information helps to maintain and optimize test environments.
-
Validate and optimize the implementation
After setting up, validate the workflow by running test cases and checking the dashboard for correct data representation. Optimize the setup based on initial observations, ensuring data consistency and accuracy.
-
Monitor and adjust
Continuously monitor the system for performance and efficacy. Make adjustments as needed based on feedback and evolving requirements.
By following these steps, you can effectively implement Dynatrace’s test pipeline observability to enhance testing processes, gain valuable insights, and improve overall efficiency.
Conclusion
Implementing Test Pipeline Observability with Dynatrace provides a practical solution for enhancing test monitoring. This guide has outlined steps to collect and analyze test data, set up monitoring dashboards, and automate responses to important test events. These actions help reduce the manual effort in monitoring tests and allow teams to focus on critical issues, improving the overall testing process.
Teams are advised to apply these practices to their testing environments and discover the full potential of Dynatrace’s observability tools. The insights gained from this implementation can lead to ongoing improvements in software development processes. By continuing to use Dynatrace and its features, teams can ensure consistent quality in their software development efforts.
 Workflows
 Dashboards
 Slack
Slack Anomaly Detection