Memory profiling
- Dynatrace Classic
- How-to guide
- 7-min read
To use the feature, you need a JVM that supports Low-Overhead Heap Profiling, introduced with JEP 331. Note that this feature is available only for Java processes.
Memory profiling enables you to understand the memory allocation and garbage collection behavior of your applications over time. It helps you identify method calls in the context within which most memory was allocated and combine this information with the number of allocated objects. The Survivor perspective helps you to understand the context within which your long-living objects (objects that survive multiple garbage collection cycles) are created.
You have the following options for accessing memory profiling:
-
via diagnostic tools
- Go to
 Profiling & Optimization and select Continuous CPU profiling.
 - In the Actions column of the required process group, select More (…) > Memory allocation.
- Go to
-
via process details
-
Go to
 Hosts Classic and select the required host.
 -
On the host page, go to Process analysis and select the process you're interested in.
If you are using the classic host page design, to find the processes list go to Processes. -
Do one of the following:
-
Select More (…) > Memory profiling to open the All allocations tab.
-
Open the JVM metrics tab and select Analyze suspension to directly open the Survivors tab.
-
-
You can select any timeframe for the analysis, independent of the global timeframe. We recommend that you exclude third-party libraries from the analysis to focus on code that is under your control.
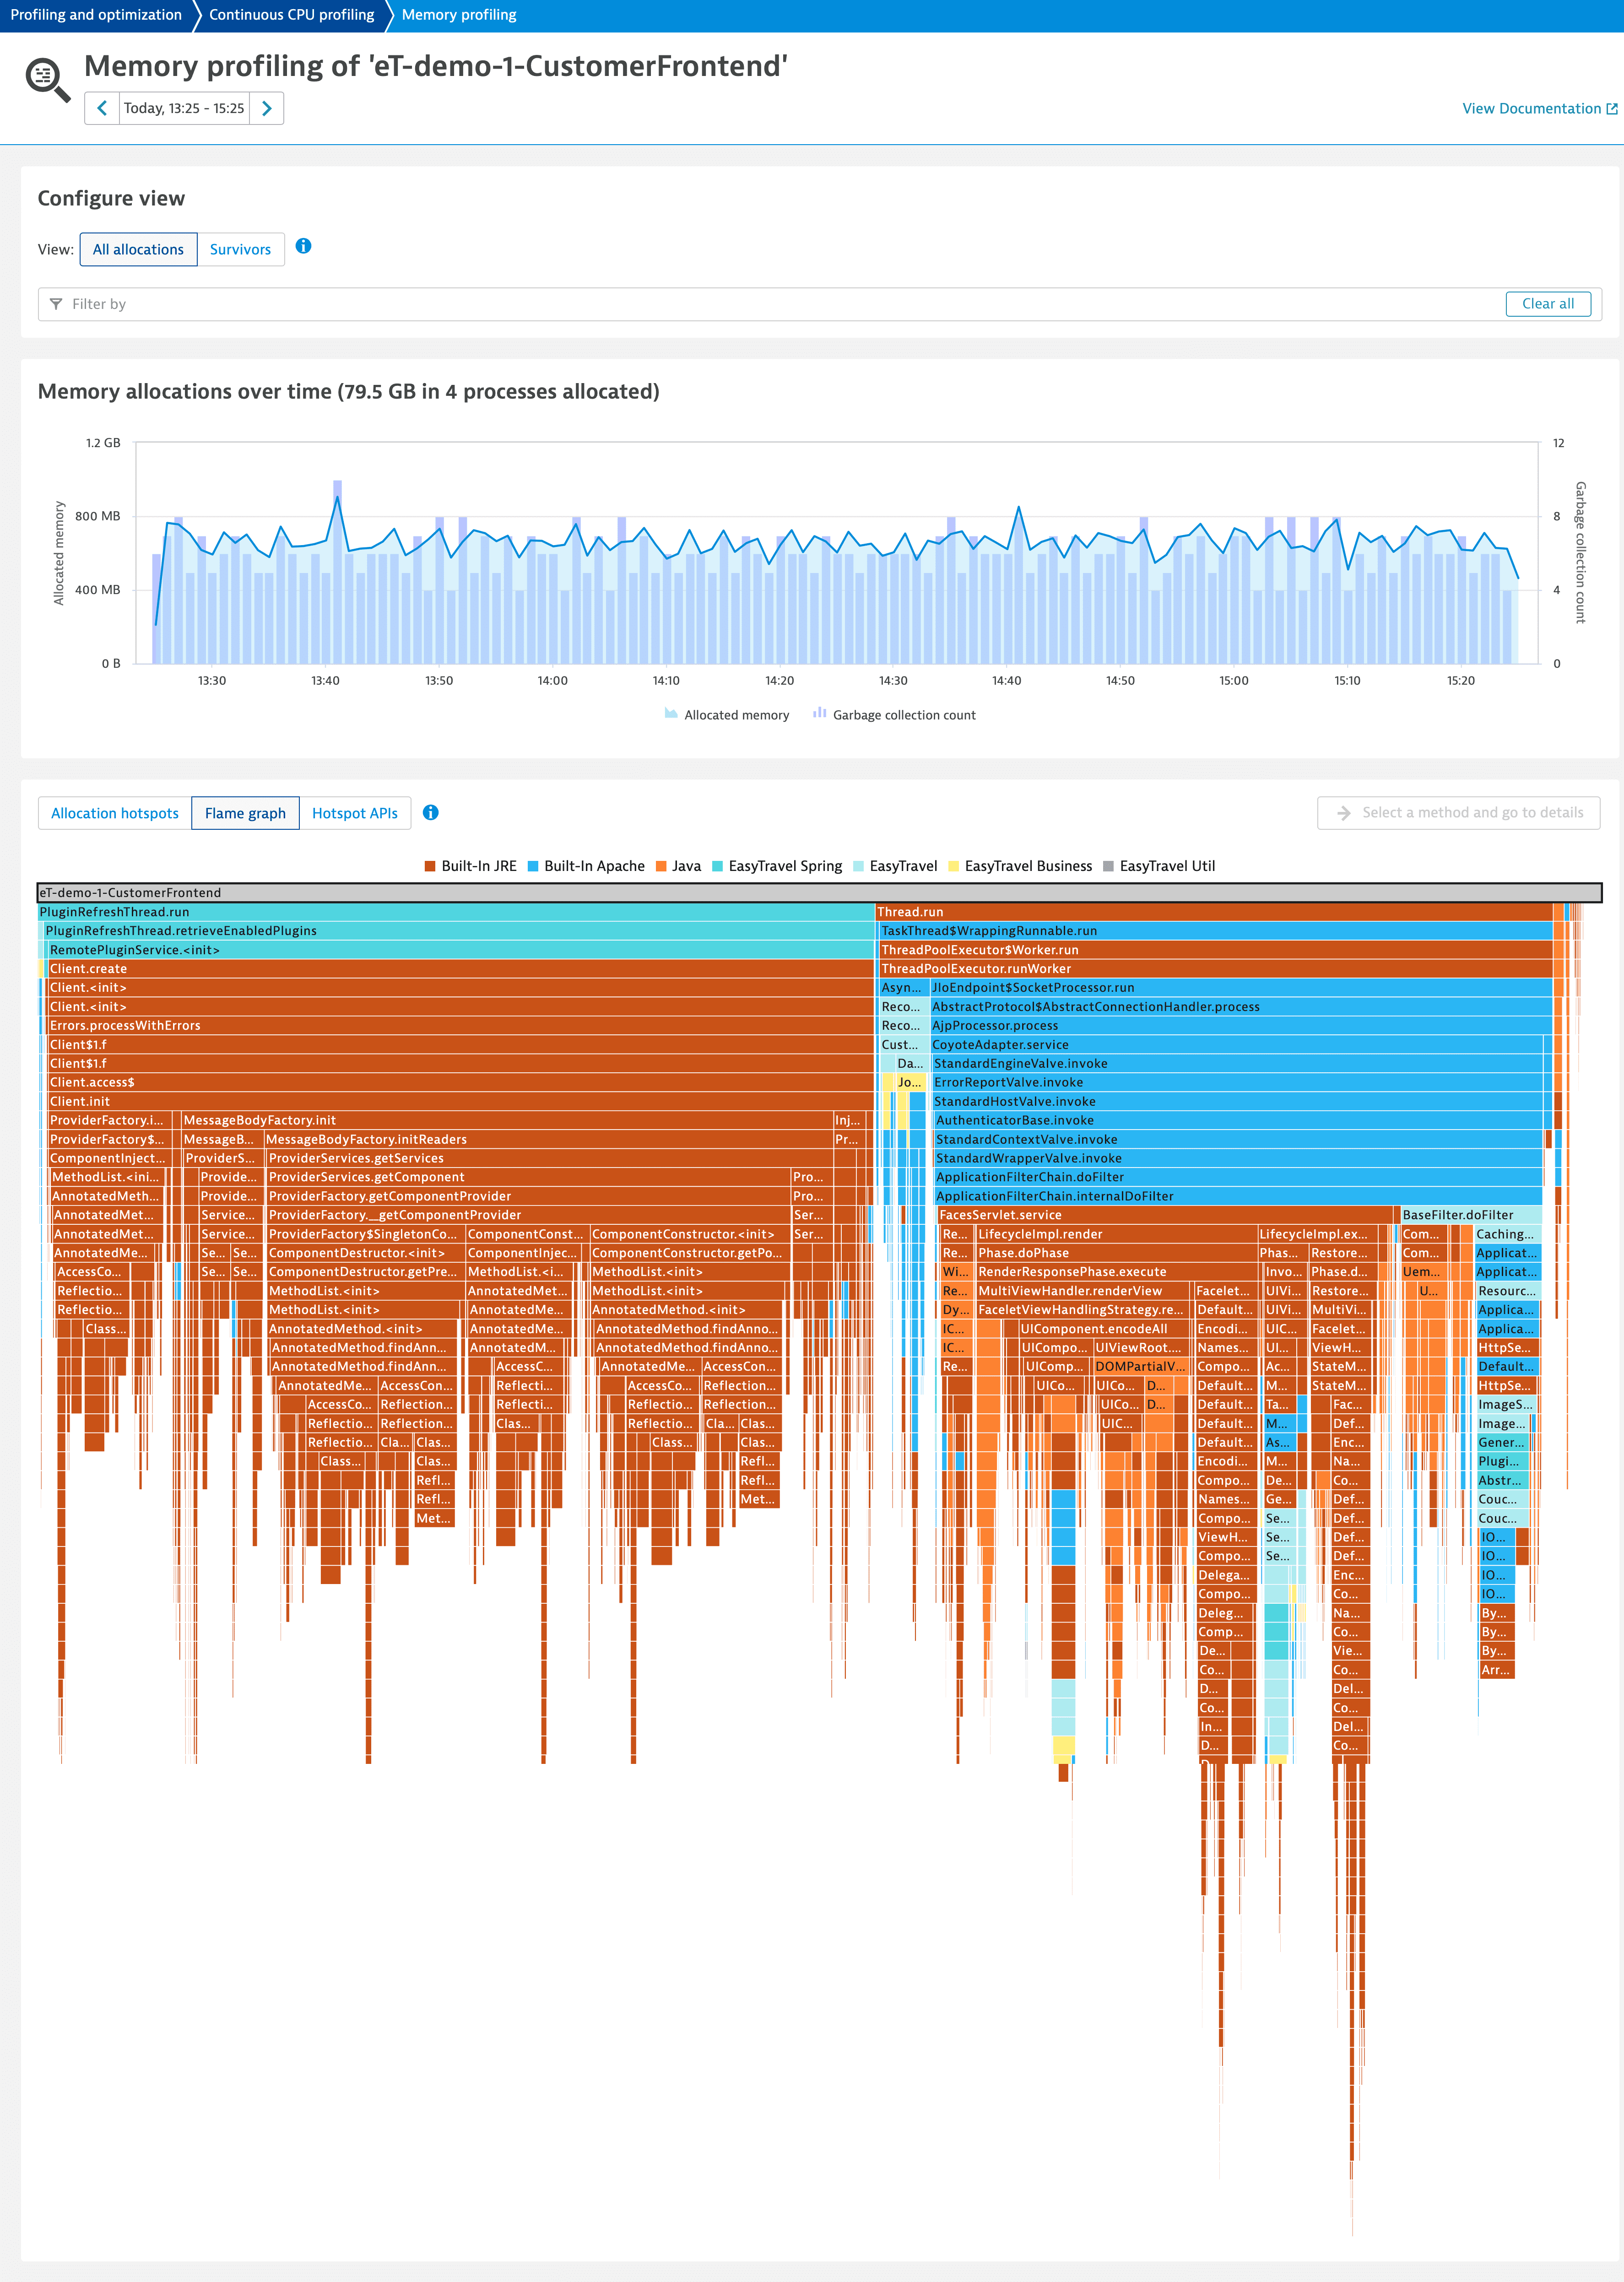
All allocations
The All allocations view shows how many times garbage collection ran and how much memory is allocated. At the bottom of the page, you can find different analysis options, such as Allocation hotspots, Flame graph, and Hotspot APIs.
In the Allocation hotspots tab, a table shows the methods of the analyzed process that consume most of the memory.
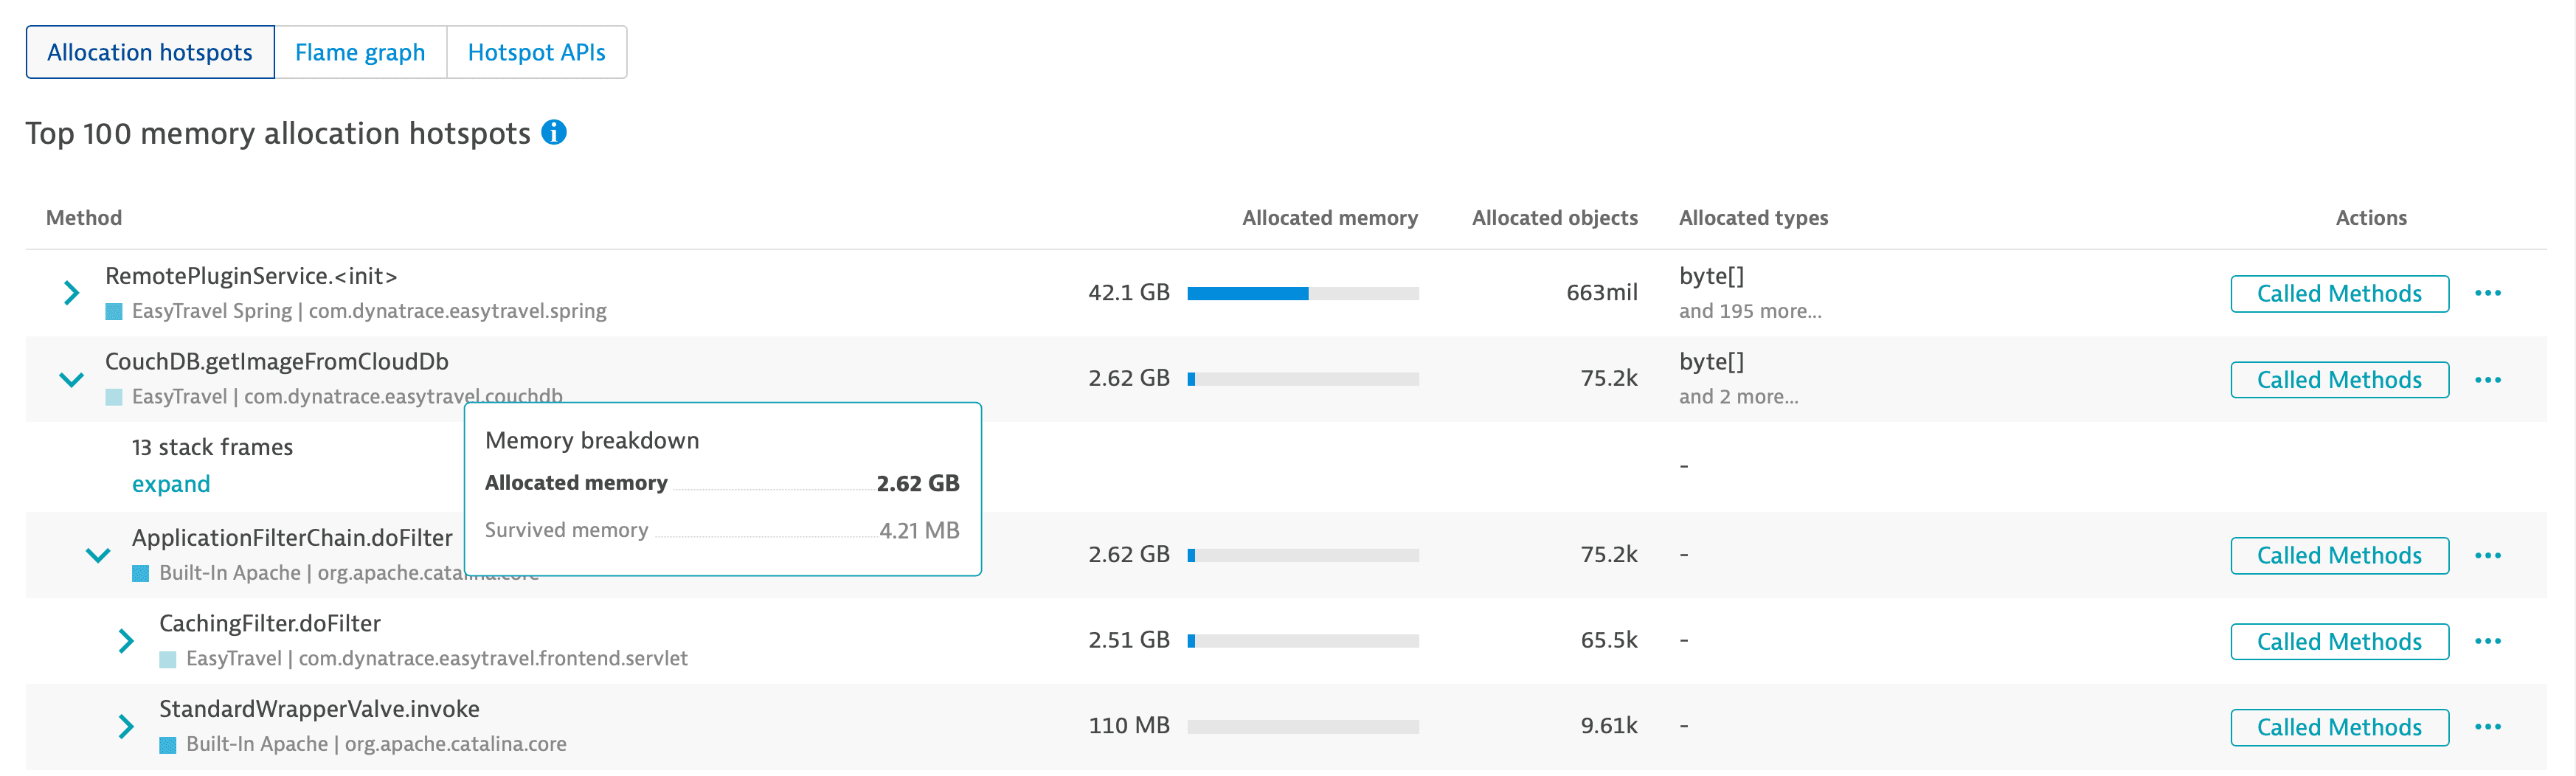
- To see the callers of a method expand the method.
You can see how much memory is allocated, the number of allocated objects, and the allocated memory per type in the method. - To see the sequence of methods called by a method under analysis, select Called Methods in the Actions column.
The Allocated types column shows objects that are allocated only in the method itself. These don't apply to any subsequently called methods.
You can exclude third-party APIs from this view by selecting More (…) > API detection rules in the Actions column.
Called methods
When you select a method in the Allocation hotspots tab or in the Flame graph tab, you can analyze the stack trace by selecting Called methods in the upper-right corner of the tab.
- The Overview tab displays the methods that contribute most to memory consumption and a flame graph for a general overview.
- The Details tab displays a detailed and dynamic flame graph to further analyze the stack trace.
Survivors
When you find out which methods consume most of the memory, you can check their longevity from the Survivors view. The view shows:
- Objects that have survived one or multiple garbage collection.
- The time spent on garbage collection.
- The amount of memory that survived all garbage collections.
Note that objects that survived multiple garbage collections contribute multiple times to the survived memory amount.
At the bottom of the page, you can find different analysis options, such as Survivor hotspots, Flame graph, and Hotspot APIs.
In the Survivor hotspots tab, a table shows the methods that created objects that account for most of the survived memory.
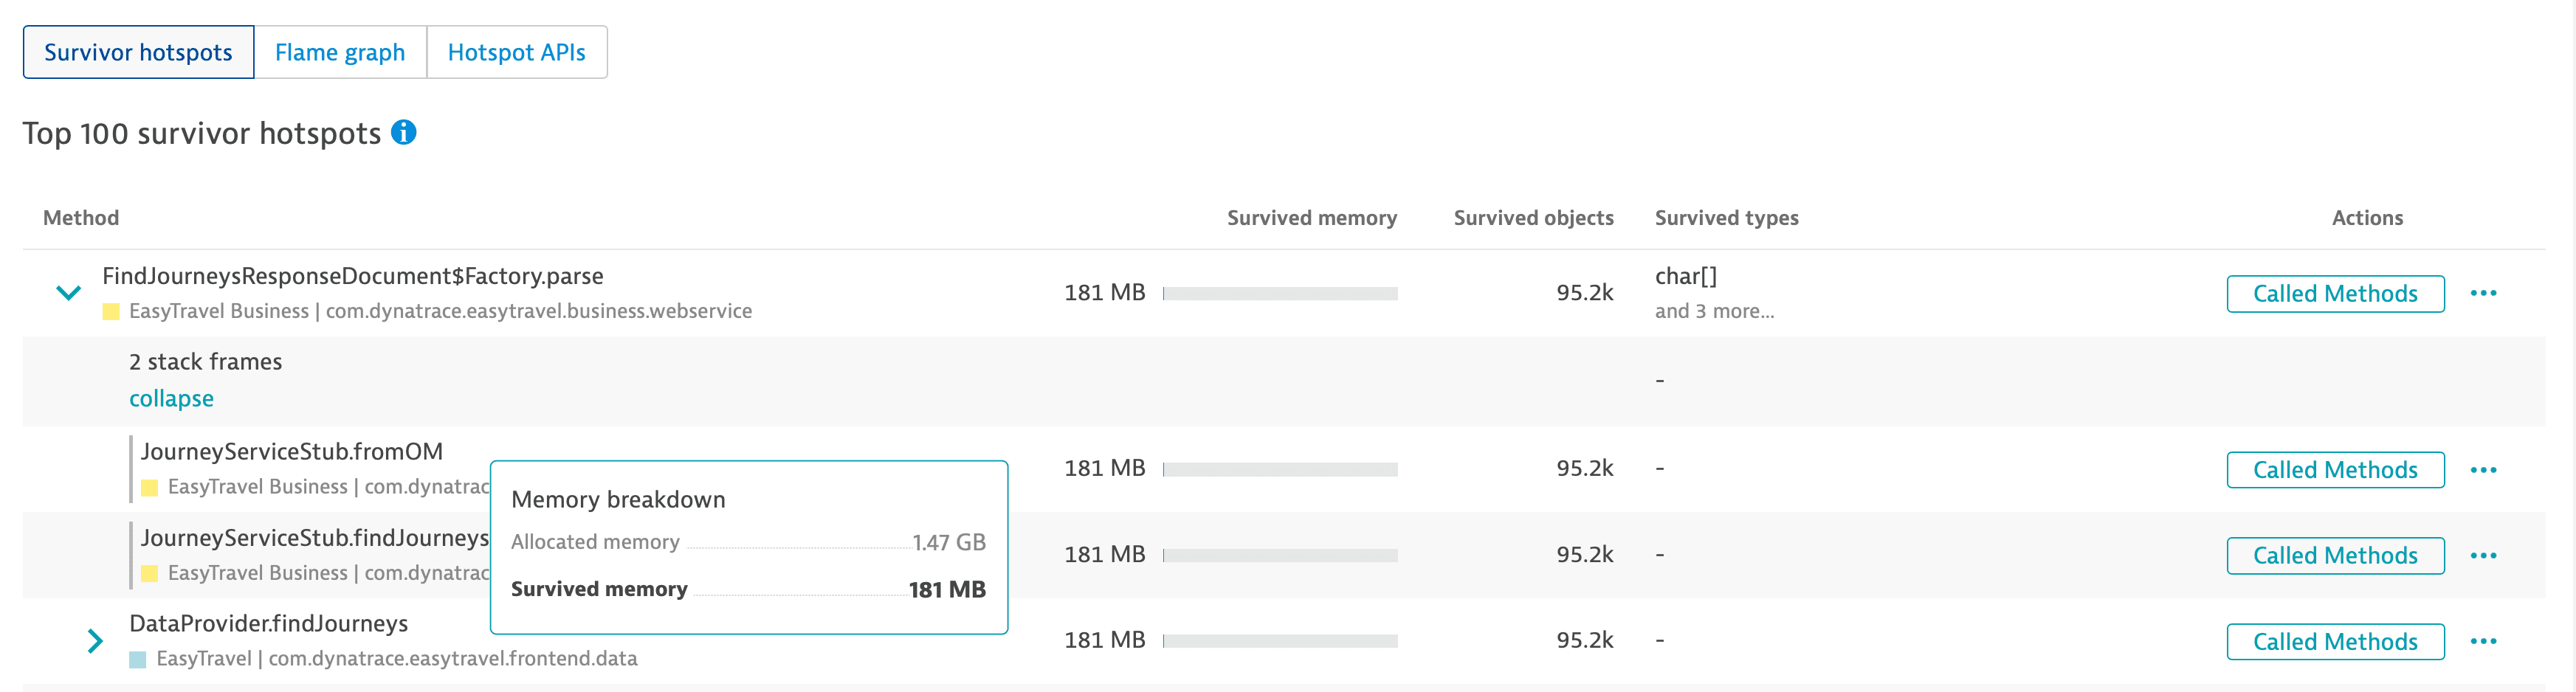
By varying the analysis timeframe you can find the time when these objects were created.
- To see the callers of a method, expand the method.
You can see how much memory that was consumed by the calling methods has survived. - To see the sequence of methods called by a method under analysis, select Called Methods in the Actions column.
The Survived types column shows objects that are allocated only in the method itself. These don't apply to any subsequently called methods.
You can exclude third-party APIs from this view, by selecting More (…) > API detection rules under the Actions column.
Called methods
When you select a method on the Survivor hotspots tab or Flame graph tab, you can analyze the stack trace by selecting Called methods in the upper-right corner of the tab. This page shows every method in the stack trace, including third-party methods.
- The Overview tab displays the methods that contribute most to the survived memory and a flame graph that provides a general overview.
- The Details tab displays a detailed and dynamic flame graph to further analyze the stack trace.
Exclude third-party libraries
To focus the analysis on your code, we recommend that you define third-party library APIs. To do this, you need to mark a user-defined API as a third-party library.
- Go to Settings > Server-side service monitoring > API detection rules.
- Select Expand
 to edit the required API.
 - Turn on This API defines a third party library.
- Save your changes.
- You can leverage a pre-filled version of the API detection rules page from the hotspots tables on the Memory profiling page. In the chosen method row, select More (…) > API detection rules in the Action column.
- You can exclude a library without manually configuring rules from the Built-in APIs list. Create a user-defined rule for the library and mark it as third party. To learn how, see Custom API definitions.
The Called method page is configured to display all methods, including third-party APIs. When you define third-party library APIs, these are not excluded from the Called method views.
Related topics
Profiling & Optimization