Application Security overview
- Explanation
This page refers to the classic Security Overview (previous Dynatrace) or  Security Overview app, which is deprecated.
For the latest Dynatrace experience, use the ready‑made Vulnerability coverage dashboard to stay ahead of your vulnerability posture. It provides insights into process and host coverage, scan activity, and the evolution of vulnerability findings.
After you set up Dynatrace Runtime Vulnerability Analytics, Dynatrace starts monitoring your applications to detect vulnerabilities. Go to Security Overview (previous Dynatrace) or Security Overview for an overview of vulnerabilities in your global environment.
For security reasons, access to this page is restricted to users who are part of the Security admin group for the whole environment, not just for a selected set of management zones.
The Application Security overview page displays the following information.
Vulnerability count
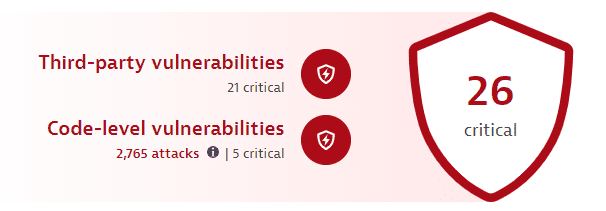
The infographic at the top of the page is based on calculations that take place every 15 minutes and shows
-
In the foreground, the total count of the most severe open vulnerabilities in your environment (
26 criticalin the example above). -
Third-party vulnerabilities: The number of the most severe open critical third-party vulnerabilities (
21 criticalin the example above). Select it to go to Third-Party Vulnerabilities (previous Dynatrace) or Third-Party Vulnerabilities filtered by the highest risk level and the open status.
This feature isn't displayed if third-party vulnerability detection is disabled.
-
Code-level vulnerabilities:
-
The number of open code-level vulnerabilities (
5 criticalin the example above). Select it to go to Code-Level Vulnerabilities (previous Dynatrace) or Code-Level Vulnerabilities filtered by the open status.
This feature isn't displayed if code-level vulnerability detection is disabled.
-
The total number of attacks—exploited, blocked, and allowlisted (
2,765 attacksin the example above)—that occurred over the last 30 days. Select it to go to the unfiltered Attacks (previous Dynatrace) or Attacks.
This feature isn't displayed if Application Protection isn't activated and enabled.
-
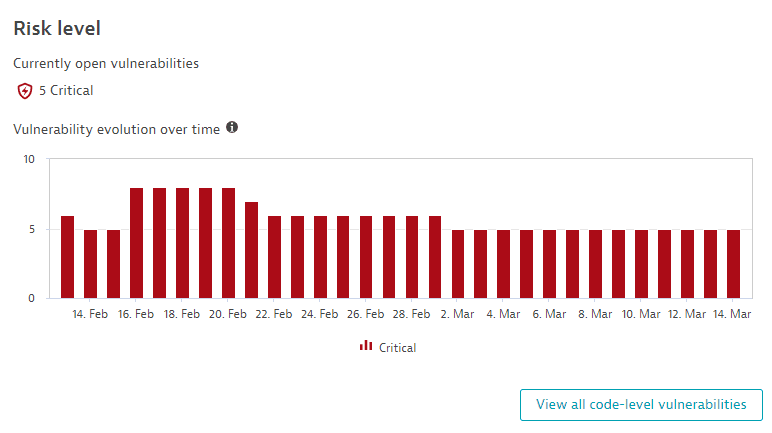
Risk level
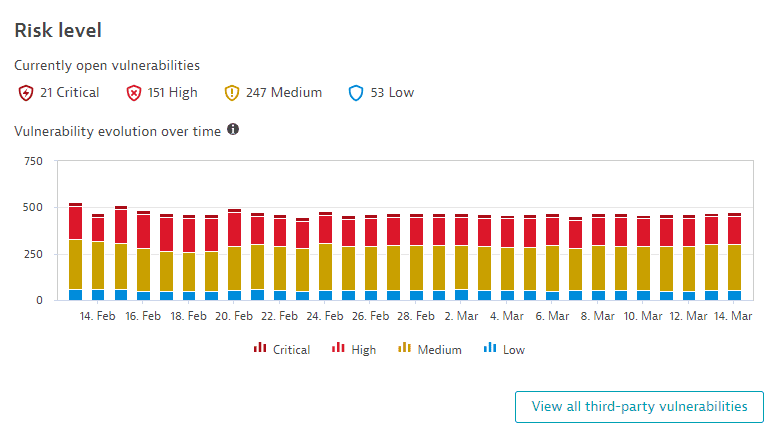
The Risk level section shows a chart of third-party vulnerabilities by risk level (critical, high, medium, low).
This section isn't displayed if third-party vulnerability detection is disabled.
Two perspectives are displayed:
-
Currently open vulnerabilities: The number of third-party vulnerabilities currently open, grouped by risk level (
21 Critical,151 High,247 Medium,53 Lowin the example above). Select any group to go to Third-Party Vulnerabilities (previous Dynatrace) or Third-Party Vulnerabilities filtered by the respective risk level and open state. -
Vulnerability evolution over time: The maximum value of the day for vulnerabilities in your global environment, over the last 30 days, split by risk level. To refine the chart by risk level, select chart legend entries.
Vulnerabilities are constantly reassessed and may change their risk level over time. For details, see Frequently asked questions.
Select View all third-party vulnerabilities to go to the unfiltered list of third-party vulnerabilities in your environment.
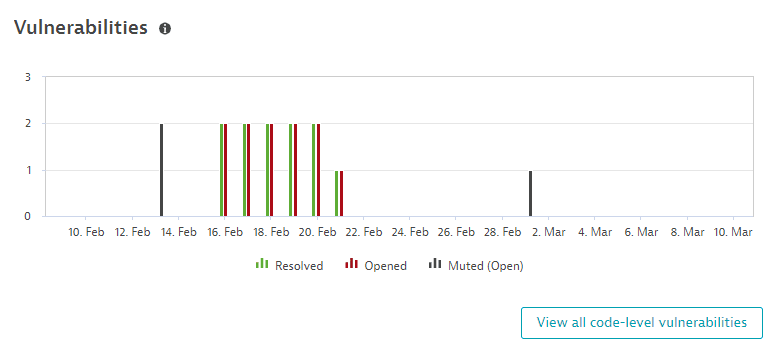
Vulnerabilities
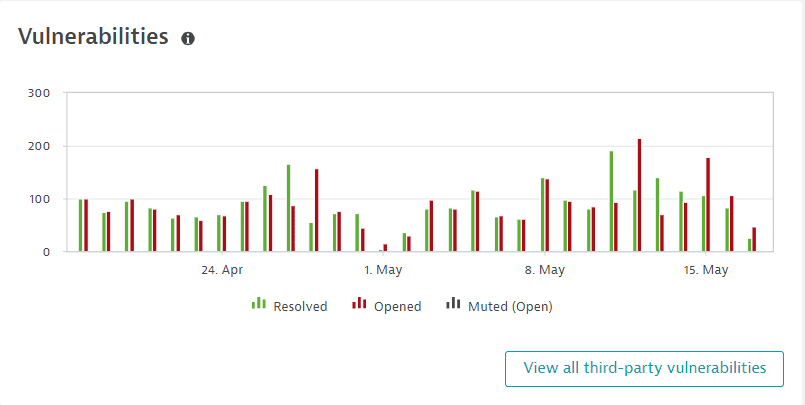
The Vulnerabilities section shows a chart of third-party vulnerabilities in your global environment by status (resolved, open, muted(open)), over the last 30 days. You can see when a vulnerability was opened, reopened, resolved, or muted. To refine the chart by risk level, select chart legend entries.
This section isn't displayed if third-party vulnerability detection is disabled.
Select View all third-party vulnerabilities to go to the unfiltered list of third-party vulnerabilities in your environment.
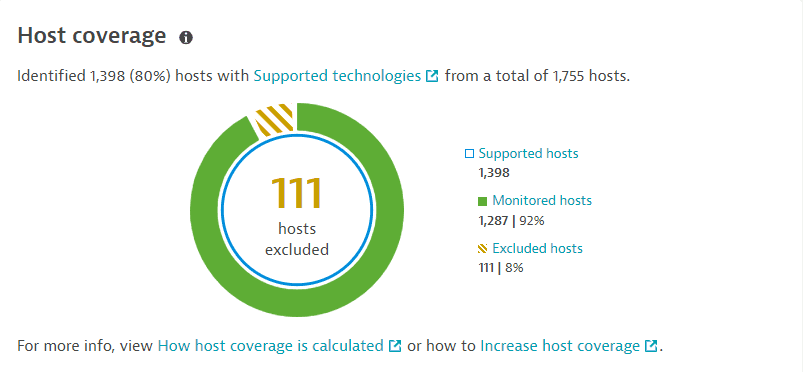
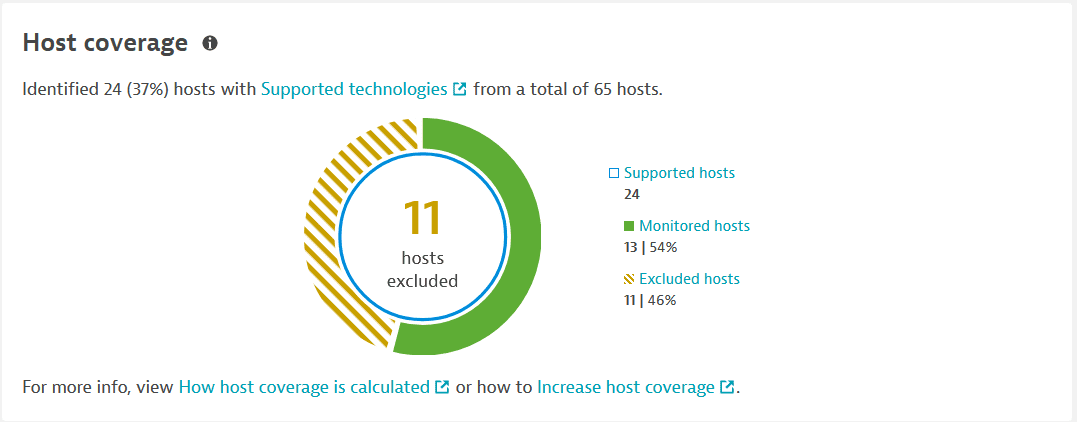
Host coverage
The Host coverage section shows the coverage of hosts on which vulnerability detection is enabled, based on your settings. This helps you determine where there are coverage gaps and how this can relate to the current number of open vulnerabilities in your environment.
This section isn't displayed if third-party vulnerability detection is disabled.
The following information is provided.
-
The number and percentage of supported hosts from the total number of hosts in your environment. For example, if the total number of hosts is 1,755 hosts, and, from this amount, only 1,398 hosts are supported, then the remaining 357 hosts belong to technologies that are not supported by Dynatrace.
-
In the foreground, the number of hosts that are excluded from monitoring by monitoring rules. To improve the coverage gaps, you need to decrease this number. For details, see How to increase host coverage.
-
Supported hosts: All hosts with supported technologies in your environment, regardless of their monitoring status (comprises the monitored and excludes hosts). Select Supported hosts to go to Hosts (previous Dynatrace) or
 Hosts Classic filtered by supported hosts.
 -
Monitored hosts: The supported hosts in your environment on which Third-Party Vulnerability Analytics is enabled, and that are not excluded from monitoring by monitoring rules. Also displayed is the percentage of monitored hosts from the total number of supported hosts. Select Monitored hosts to go to Hosts (previous Dynatrace) or
Hosts Classic filtered to display only the hosts covered by your active monitoring rules. -
Excluded hosts: The number of supported hosts on which Third-Party Vulnerability Analytics is enabled, but that are excluded from monitoring by monitoring rules or by having a relevant technology disabled. Also displayed is the percentage of excluded hosts from the total of supported hosts. Select Excluded hosts to go to Hosts (previous Dynatrace) or
Hosts Classic filtered by excluded hosts.
How host coverage is calculated
Host coverage is calculated based on the last 70 minutes and uses all hosts in your environment that run a supported technology. See below the calculation mechanism for third-party and code-level vulnerabilities.
- Collect: Dynatrace first collects all monitored hosts.
- Filter: All monitored hosts collected are then filtered based on your monitoring rules. If there are hosts that are excluded by monitoring rules, host coverage decreases.
- If there's a decrease in coverage, it can take up to 70 minutes until changes are displayed.
- If there's an increase in coverage, it can take up to 10 minutes until changes are displayed.
How to increase host coverage
To increase the host coverage for third-party and code-level vulnerabilities, follow the instructions below.
- Enable Third-party Vulnerability Analytics globally.
- Enable all the supported technologies that you want Dynatrace to cover. Note that only hosts running technologies that are listed and enabled can be collected.
- In your monitoring rules, look for hosts that are excluded from monitoring, and adapt these rules if you want the respective hosts to be collected.
It can take up to 10 minutes until any change is displayed.
Affected process groups
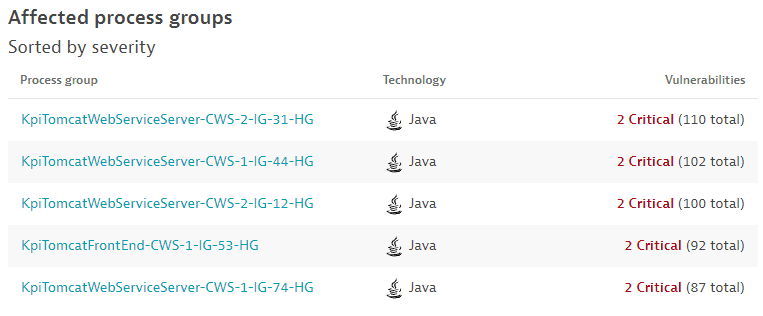
The Affected process groups section shows the top five process groups affected by third-party vulnerabilities, sorted by
- The severity of the vulnerabilities affecting the process group.
- The number of vulnerabilities affecting the process group.
This section isn't displayed if third-party vulnerability detection is disabled.
The following information is provided.
- The name of the process group with a link to the associated process group details page.
- The corresponding technology.
- The number of vulnerabilities affecting that process group out of the total number of vulnerabilities related to it.
For deeper insights, see Manage third-party vulnerabilities.
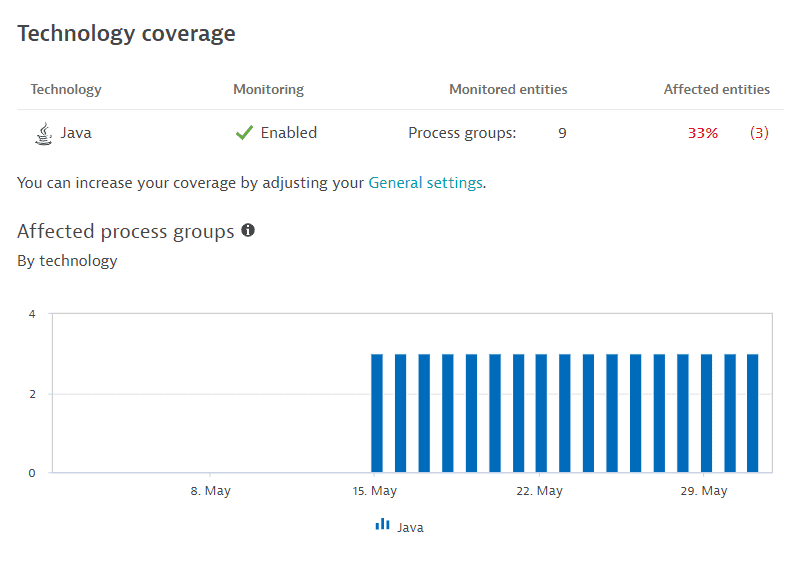
Technology coverage
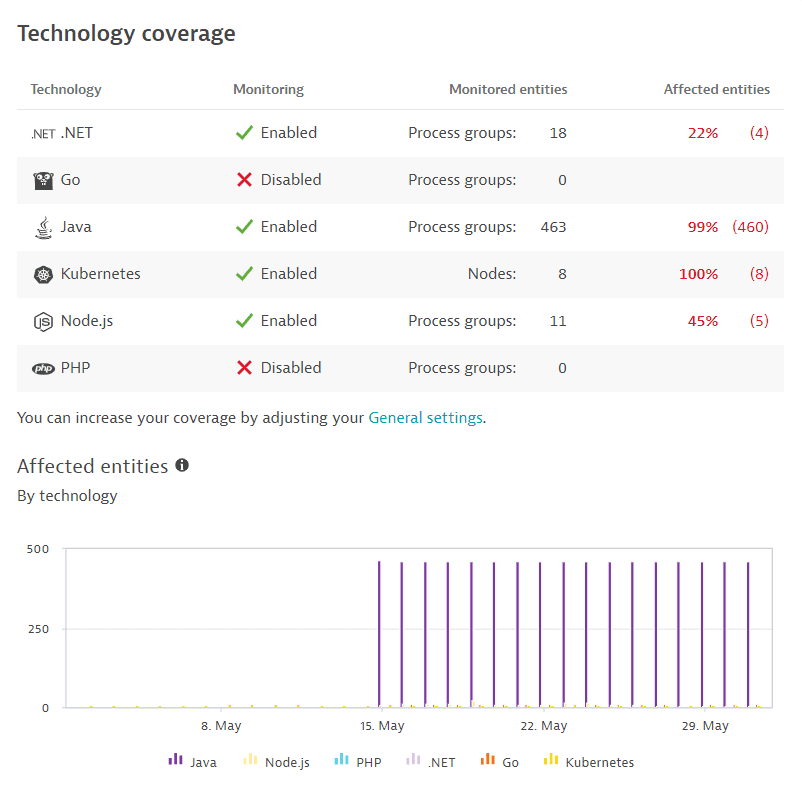
Use case: Gain an overview of the third-party vulnerability coverage by technology to determine which technologies have the most affected entities and which process groups or nodes (in the case of Kubernetes vulnerabilities) are the most vulnerable.
This section isn't displayed if third-party vulnerability detection is disabled.
The following information is displayed.
-
A table listing the supported technologies for third-party vulnerabilities, their monitoring status (enabled or disabled), the monitored entities (process groups or, in the case of Kubernetes vulnerabilities, nodes), and the number and percentage of affected entities from the total number of monitored entities.
-
A chart of the affected entity evolution by technology over the last 30 days. Hover over the data for details. To refine the chart by technology, select chart legend entries.
To increase technology coverage for third-party vulnerabilities
- Enable all the supported technologies that you want Dynatrace to cover.
- In your monitoring rules, look for entities that are excluded from monitoring and adapt these rules if you want the respective entities to be monitored.
Frequently asked questions
Why isn't the host coverage increasing?
If you have followed the steps to increase the Application Security host coverage, yet the number of covered hosts stays the same, follow the instructions below.
Make sure that
- Your OneAgent version is compatible with the supported technologies.
- (…) software component reporting OneAgent features are enabled for all technologies (go to Settings > Preferences > OneAgent features and search for (…) software component reporting).
- There are no OneAgent features configured at the process-group level overriding the global OneAgent configuration. For details, see OneAgent features.
- You restart processes after each change in configuration.
Why doesn't the number of covered hosts match?
If you define tags for hosts covered by Application Security and you notice that the number of hosts on Hosts (previous Dynatrace) or Hosts Classic filtered by your Application Security tags is different from the number of hosts displayed in Security Overview (previous Dynatrace) or Security Overview under Host coverage, follow the instructions below.
- Make sure that your OneAgent version is compatible with the supported technologies.
- Enable (…) software component reporting OneAgent features for all technologies (go to Settings > Preferences > OneAgent features, and search for (…) software component reporting).
- Make sure that there are no OneAgent features configured at the process-group level overriding the global OneAgent configuration. For details, see OneAgent features.
- Enable all supported technologies (go to Settings > Application Security > Vulnerability Analytics > General settings and select Third-party Vulnerability Analytics). For details, see Control by technology.
How many TPVs are counted if their risk level changes?
On the risk-level chart, how many third-party vulnerabilities are counted in one day if their risk level changes several times that day (for example, from Medium to High, and back to Medium again)?
In this case, the vulnerability is counted twice, once for Medium and once for High.
How many TPVs are counted if affected process is restarted?
On the risk-level chart, how many third-party vulnerabilities are counted in one day if the affected process is restarted several times that day, but the vulnerability risk level stays the same (for example, Medium)?
In this case, the vulnerability is counted one time, as Medium.
Related topics
Security OverviewApplication Security