Zscaler Internet Access (ZIA) extension
- Latest Dynatrace
- Extension
Monitor Zscaler Internet Access by ingesting NSS log feeds into Dynatrace to extract web, firewall, DNS, tunnel, and audit metrics.
Get started
Overview
Zscaler Internet Access forwards its NSS log feed types to the Dynatrace Log Ingestion API v2. Each feed carries a sourcetype field that the extension uses to route the log to a dedicated parser. Once parsed, the extension:
- Parses ZIA JSON logs: A log OpenPipeline pipeline recognizes each supported feed by
sourcetypeand extracts the relevant fields. - Extracts metrics: Counter and value metrics (all under the
zia.*namespace) are produced from the parsed logs for web, firewall, DNS, tunnel, and admin-audit events. - Builds a live Smartscape topology: A metrics OpenPipeline pipeline discovers ZIA Location, ZIA User, and ZIA Tunnel entities and the relationships between them (see Smartscape on Grail).
- Visualizes the data: Focused, per-log-type dashboards, plus unified analysis screens (entity detail and inventory) for each discovered ZIA entity.
- Detects problems: Pre-built alert templates raise Dynatrace Problems on the affected ZIA entity.
The supported log feed types:
| Log feed | NSS type | Sourcetype |
|---|---|---|
Web Logs | NSS for Web |
|
Firewall Logs | NSS for Firewall |
|
DNS Logs | NSS for Firewall |
|
Tunnel Logs | NSS for Web |
|
Admin Audit Logs | NSS for Web |
|
Use cases
- Secure Web Gateway visibility: See what users are browsing, catch blocked or risky web activity, and pinpoint slow or bandwidth-heavy traffic by location, user, or application.
- Firewall and network analysis: Understand what the firewall allows or blocks, which rules and network applications drive traffic, and spot capacity or bandwidth pressure per location.
- DNS health: Detect blocked or failing DNS lookups, slow name resolution, and the users or devices generating the most DNS traffic.
- Tunnel monitoring: Track GRE/IPSEC tunnel throughput and Dead Peer Detection activity to catch unstable tunnels before connectivity drops.
- Admin audit and compliance: Track who changed what, and spot spikes in failed admin actions that may signal misconfiguration or unauthorized access.
- Topology-driven investigation: Follow traffic across a live map of locations, users, and tunnels instead of scrolling through raw logs.
Requirements
- Minimum required Dynatrace version: Dynatrace version 1.345.
- OpenPipeline Settings 2.0 enabled on the environment.
- Access to a Zscaler Internet Access Admin Portal with permissions to manage the Nanolog Streaming Service (Cloud NSS Feeds), and the Cloud NSS feature enabled on the ZIA tenant.
- Your Dynatrace environment ID and a Dynatrace API token with the Ingest logs (
logs.ingest) scope, used by the ZIA Cloud NSS feeds to push logs to the Dynatrace Log Ingestion API v2.
Compatibility information
This extension works with Zscaler Cloud NSS Feeds and delivers complete, out-of-the-box observability for the following recommended ZIA feed types:
For these recommended feeds, everything is ready to use from the moment the extension is activated. Logs are parsed automatically, and the extension populates metrics, dashboards, alerts, and Smartscape topology.
The Cloud NSS Feeds you configure in your ZIA tenant determine which log types reach Dynatrace, not the extension, so you always stay in control of what you send. The extension never restricts this: if you configure additional ZIA feed types, their logs are ingested into Dynatrace alongside the rest, ready to explore, query, and retain. The packaged features (metrics, dashboards, alerts, Smartscape topology, and more) are purpose-built for the recommended feed types. For any additional feed types, the ingested log data serves as a foundation on which you can build your own metrics, dashboards, alerts, and analytics tailored to your specific use cases.
Activation and setup
Activation has three parts: activate the extension from Dynatrace Hub, configure the two OpenPipeline dynamic routes, and configure the Zscaler Internet Access Cloud NSS feeds. The prerequisites are listed under Requirements.
1. Activate the extension
Activate the Zscaler Internet Access extension in the Hub app. Upon activation, the extension deploys all its assets, including OpenPipeline parsing rules, but you need to configure the OpenPipeline routing.
2. Configure the OpenPipeline dynamic routes
OpenPipeline Dynamic Routes send incoming data to the extension's pipelines based on a matching DQL condition. Two routes are required—one for the ZIA log feeds and one for the metrics that power the Smartscape topology.
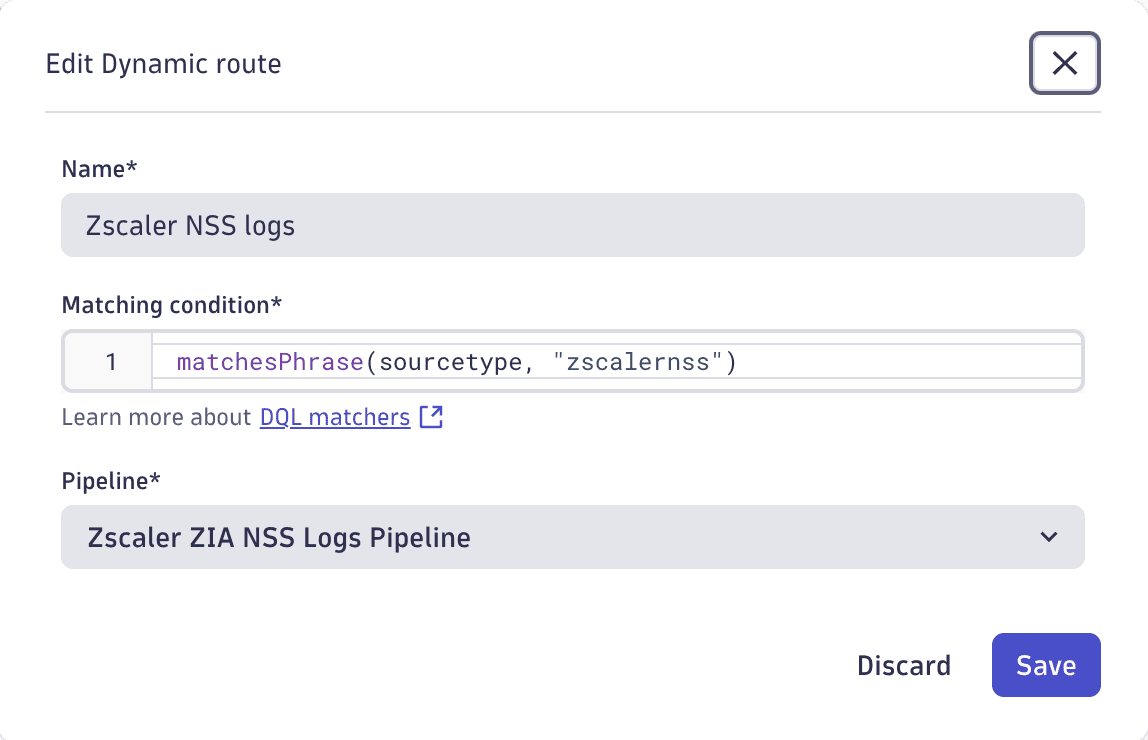
Logs dynamic route: Routes the ZIA log feeds (identified by their sourcetype field) to the log pipeline:
- Open Settings > OpenPipeline > Logs > Dynamic Routing.
- Choose Add Dynamic Route.
- Set the matching condition to
matchesPhrase(sourcetype, "zscalernss")and the Pipeline to Zscaler ZIA NSS Logs Pipeline, then save.
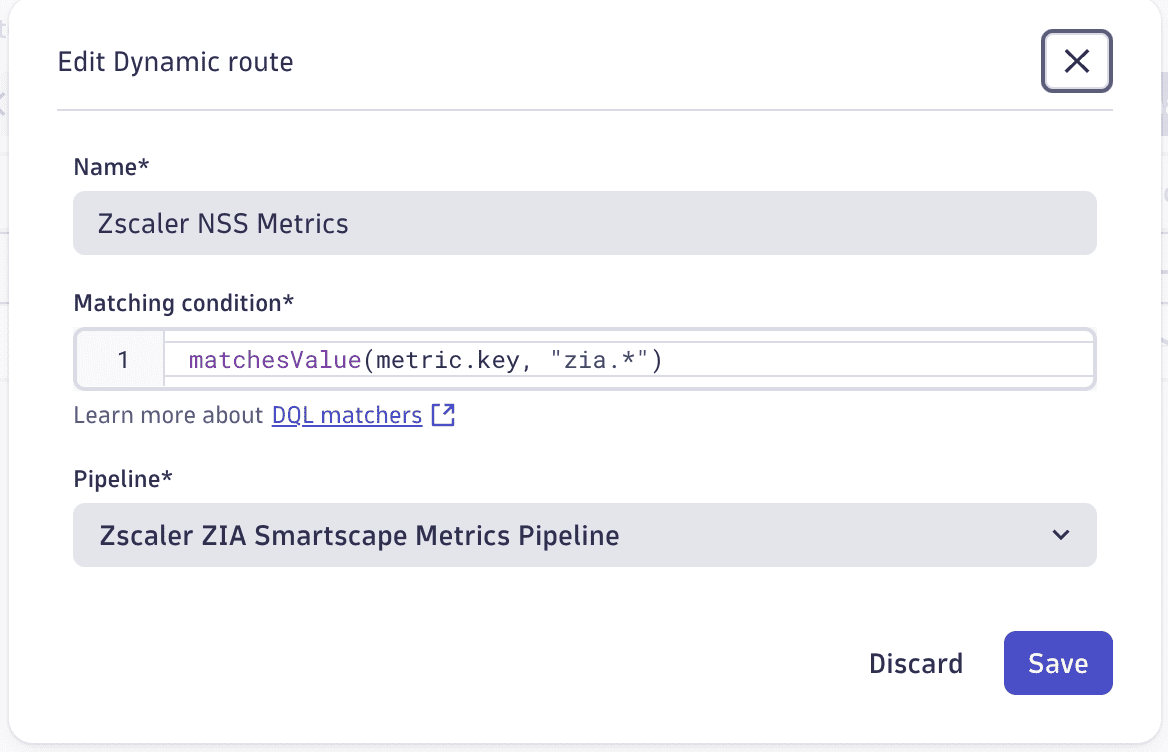
Metrics dynamic route: Routes the zia.* metrics into the Smartscape metrics pipeline so the topology is discovered (see also Smartscape on Grail):
- Open Settings > OpenPipeline > Metrics > Dynamic Routing.
- Choose Add Dynamic Route.
- Set the matching condition to
matchesValue(metric.key, "zia.*")and the Pipeline to Zscaler ZIA Smartscape Metrics Pipeline, then save.
3. Configure the Zscaler Internet Access Cloud NSS feeds
In your ZIA Admin Console, configure a Cloud NSS Feed for each log type.
Navigation: ZIA Admin Console > Administration > Nanolog Streaming Service > Cloud NSS Feeds > Add Cloud NSS Feed
All feeds share the same Dynatrace endpoint and authentication:
| Parameter | Value |
|---|---|
SIEM Type | Other |
API URL |
|
HTTP headers (configure on every feed):
| Header key | Header value |
|---|---|
Authorization |
|
Content-Type |
|
Each feed must use the exact JSON Feed Output Format below so that field names match the pipeline parsers.
Web Logs Feed
| Parameter | Value |
|---|---|
NSS Type | NSS for Web |
Log Type | Web Log |
Feed Output Type | JSON |
JSON Array Notation | Enabled |
Feed Escape Character |
|
Time Zone | GMT |
The following excerpt shows the fields that the extension's OpenPipeline parsers read for metric and topology extraction. For the complete feed format, see the Zscaler Web Logs NSS feed format.
\{"sourcetype":"zscalernss-web","event":\{"datetime":"%d{yy}-%02d{mth}-%02d{dd} %02d{hh}:%02d{mm}:%02d{ss}","reason":"%s{reason}","event_id":"%d{recordid}","protocol":"%s{proto}","action":"%s{action}","transactionsize":"%d{totalsize}","responsesize":"%d{respsize}","requestsize":"%d{reqsize}","urlcategory":"%s{urlcat}","serverip":"%s{sip}","clienttranstime":"%d{ctime}","requestmethod":"%s{reqmethod}","refererURL":"%s{referer}","useragent":"%s{ua}","product":"NSS","location":"%s{location}","ClientIP":"%s{cip}","status":"%s{respcode}","user":"%s{login}","url":"%s{url}","vendor":"Zscaler","hostname":"%s{host}","clientpublicIP":"%s{cintip}","threatcategory":"%s{malwarecat}","threatname":"%s{threatname}","filetype":"%s{filetype}","appname":"%s{appname}","pagerisk":"%d{riskscore}","department":"%s{dept}","urlsupercategory":"%s{urlsupercat}","appclass":"%s{appclass}","dlpengine":"%s{dlpeng}","urlclass":"%s{urlclass}","threatclass":"%s{malwareclass}","dlpdictionaries":"%s{dlpdict}","ft_rulename":"%s{ft_rulename}","fileclass":"%s{fileclass}","bwthrottle":"%s{bwthrottle}","servertranstime":"%d{stime}","contenttype":"%s{contenttype}","unscannabletype":"%s{unscannabletype}","deviceowner":"%s{deviceowner}","devicehostname":"%s{devicehostname}","company":"%s{company}","cloudname":"%s{cloudname}","throttlereqsize":"%d{throttlereqsize}","throttlerespsize":"%d{throttlerespsize}","bwclassname":"%s{bwclassname}","bwrulename":"%s{bwrulename}","app_risk_score":"%s{app_risk_score}","app_status":"%s{app_status}","activity":"%s{activity}","prompt_req":"%s{prompt_req}","inst_level1_type":"%s{inst_level1_type}","inst_level1_id":"%s{inst_level1_id}","inst_level1_name":"%s{inst_level1_name}","inst_level2_type":"%s{inst_level2_type}","inst_level2_id":"%s{inst_level2_id}","inst_level2_name":"%s{inst_level2_name}","inst_level3_type":"%s{inst_level3_type}","inst_level3_id":"%s{inst_level3_id}","inst_level3_name":"%s{inst_level3_name}","datacenter":"%s{datacenter}","datacentercity":"%s{datacentercity}","datacentercountry":"%s{datacentercountry}","dlpdicthitcount":"%s{dlpdicthitcount}","dlpeng":"%s{dlpeng}","dlpidentifier":"%d{dlpidentifier}","dlpmd5":"%s{dlpmd5}","dlprulename":"%s{dlprulename}","trig_dlprulename":"%s{trig_dlprulename}","other_dlprulenames":"%s{other_dlprulenames}","all_dlprulenames":"%s{all_dlprulenames}","filename":"%s{filename}","filesubtype":"%s{filesubtype}","upload_fileclass":"%s{upload_fileclass}","upload_filetype":"%s{upload_filetype}","upload_filename":"%s{upload_filename}","upload_filesubtype":"%s{upload_filesubtype}","upload_doctypename":"%s{upload_doctypename}","rdr_rulename":"%s{rdr_rulename}","fwd_type":"%s{fwd_type}","fwd_gw_name":"%s{fwd_gw_name}","fwd_gw_ip":"%s{fwd_gw_ip}","zpa_app_seg_name":"%s{zpa_app_seg_name}","reqdatasize":"%d{reqdatasize}","reqhdrsize":"%d{reqhdrsize}","respdatasize":"%d{respdatasize}","resphdrsize":"%d{resphdrsize}","reqversion":"%s{reqversion}","respversion":"%s{respversion}","refererhost":"%s{refererhost}","uaclass":"%s{uaclass}","ua_token":"%s{ua_token}","df_hostname":"%s{df_hostname}","df_hosthead":"%s{df_hosthead}","mobappname":"%s{mobappname}","mobappcat":"%s{mobappcat}","mobdevtype":"%s{mobdevtype}","cpubip":"%s{cpubip}","clt_sport":"%d{clt_sport}","srcip_country":"%s{srcip_country}","dstip_country":"%s{dstip_country}","is_src_cntry_risky":"%s{is_src_cntry_risky}","is_dst_cntry_risky":"%s{is_dst_cntry_risky}","srv_dport":"%d{srv_dport}","alpnprotocol":"%s{alpnprotocol}","trafficredirectmethod":"%s{trafficredirectmethod}","userlocationname":"%s{userlocationname}","ruletype":"%s{ruletype}","rulelabel":"%s{rulelabel}","urlfilterrulelabel":"%s{urlfilterrulelabel}","apprulelabel":"%s{apprulelabel}","bamd5":"%s{bamd5}","sha256":"%s{sha256}","ssldecrypted":"%s{ssldecrypted}","externalspr":"%s{externalspr}","keyprotectiontype":"%s{keyprotectiontype}","clientsslcipher":"%s{clientsslcipher}","clienttlsversion":"%s{clienttlsversion}","clientsslsessreuse":"%s{clientsslsessreuse}","cltsslfailreason":"%s{cltsslfailreason}","cltsslfailcount":"%d{cltsslfailcount}","srvsslcipher":"%s{srvsslcipher}","srvtlsversion":"%s{srvtlsversion}","serversslsessreuse":"%s{serversslsessreuse}","srvocspresult":"%s{srvocspresult}","srvcertchainvalpass":"%s{srvcertchainvalpass}","srvwildcardcert":"%s{srvwildcardcert}","srvcertvalidationtype":"%s{srvcertvalidationtype}","srvcertvalidityperiod":"%s{srvcertvalidityperiod}","is_ssluntrustedca":"%s{is_ssluntrustedca}","is_sslselfsigned":"%s{is_sslselfsigned}","is_sslexpiredca":"%s{is_sslexpiredca}","threatseverity":"%s{threatseverity}","urlcatmethod":"%s{urlcatmethod}","devicemodel":"%s{devicemodel}","devicename":"%s{devicename}","devicetype":"%s{devicetype}","deviceostype":"%s{deviceostype}","deviceosversion":"%s{deviceosversion}","deviceappversion":"%s{deviceappversion}","ztunnelversion":"%s{ztunnelversion}","external_devid":"%s{external_devid}","bypassed_traffic":"%d{bypassed_traffic}","bypassed_etime":"%s{bypassed_etime}","flow_type":"%s{flow_type}","pcapid":"%s{pcapid}","productversion":"%s{productversion}","nsssvcip":"%s{nsssvcip}","eedone":"%s{eedone}"\}\}
Firewall Logs Feed
| Parameter | Value |
|---|---|
NSS Type | NSS for Firewall |
Log Type | Firewall Logs |
Firewall Log Type | Both Session and Aggregate Logs |
Feed Output Type | JSON |
JSON Array Notation | Enabled |
Feed Escape Character |
|
Time Zone | GMT |
Feed Output Format
\{"sourcetype":"zscalernss-fw","event":\{"datetime":"%d{yy}-%02d{mth}-%02d{dd} %02d{hh}:%02d{mm}:%02d{ss}","user":"%s{login}","department":"%s{dept}","location":"%s{location}","cdport":"%d{cdport}","csport":"%d{csport}","sdport":"%d{sdport}","ssport":"%d{ssport}","csip":"%s{csip}","cdip":"%s{cdip}","ssip":"%s{ssip}","sdip":"%s{sdip}","tsip":"%s{tsip}","tunsport":"%d{tsport}","tuntype":"%s{ttype}","action":"%s{action}","dnat":"%s{dnat}","stateful":"%s{stateful}","aggregate":"%s{aggregate}","nwsvc":"%s{nwsvc}","nwapp":"%s{nwapp}","proto":"%s{ipproto}","ipcat":"%s{ipcat}","destcountry":"%s{destcountry}","avgduration":"%d{avgduration}","rulelabel":"%s{rulelabel}","inbytes":"%ld{inbytes}","outbytes":"%ld{outbytes}","duration":"%d{duration}","durationms":"%d{durationms}","numsessions":"%d{numsessions}","ipsrulelabel":"%s{ipsrulelabel}","threatcat":"%s{threatcat}","threatname":"%s{threatname}","deviceowner":"%s{deviceowner}","devicehostname":"%s{devicehostname}","cdfqdn":"%s{cdfqdn}","srcip_country":"%s{srcip_country}","threat_score":"%d{threat_score}","threatseverity":"%s{threat_severity}","ips_custom_signature":"%d{ips_custom_signature}","dnatrulelabel":"%s{dnatrulelabel}","recordid":"%d{recordid}","pcapid":"%s{pcapid}","eedone":"%s{eedone}","devicemodel":"%s{devicemodel}","devicename":"%s{devicename}","deviceostype":"%s{deviceostype}","deviceosversion":"%s{deviceosversion}","deviceappversion":"%s{deviceappversion}","external_deviceid":"%s{external_deviceid}","ztunnelversion":"%s{ztunnelversion}","bypassed_session":"%d{bypassed_session}","bypass_etime":"%s{bypass_etime}","flow_type":"%s{flow_type}","datacenter":"%s{datacenter}","datacentercity":"%s{datacentercity}","datacentercountry":"%s{datacentercountry}","rdr_rulename":"%s{rdr_rulename}","fwd_gw_name":"%s{fwd_gw_name}","zpa_app_seg_name":"%s{zpa_app_seg_name}"\}\}
DNS Logs Feed
| Parameter | Value |
|---|---|
NSS Type | NSS for Firewall |
Log Type | DNS Logs |
Feed Output Type | JSON |
JSON Array Notation | Enabled |
Feed Escape Character |
|
Time Zone | GMT |
Feed Output Format
\{"sourcetype":"zscalernss-dns","event":\{"datetime":"%d{yy}-%02d{mth}-%02d{dd} %02d{hh}:%02d{mm}:%02d{ss}","user":"%s{login}","department":"%s{dept}","location":"%s{location}","reqaction":"%s{reqaction}","resaction":"%s{resaction}","reqrulelabel":"%s{reqrulelabel}","resrulelabel":"%s{resrulelabel}","dns_reqtype":"%s{reqtype}","dns_req":"%s{req}","dns_resp":"%s{res}","srv_dport":"%d{sport}","durationms":"%d{durationms}","clt_sip":"%s{cip}","srv_dip":"%s{sip}","category":"%s{domcat}","deviceowner":"%s{deviceowner}","devicehostname":"%s{devicehostname}","ecs_slot":"%s{ecs_slot}","dnsgw_slot":"%s{dnsgw_slot}","istcp":"%d{istcp}","recordid":"%d{recordid}","pcapid":"%s{pcapid}","respipcat":"%s{respipcat}","restype":"%s{restype}","eedone":"%s{eedone}","error":"%s{error}","ecs_prefix":"%s{ecs_prefix}","dnsgw_srv_proto":"%s{dnsgw_srv_proto}","dnsgw_flags":"%s{dnsgw_flags}","http_code":"%s{http_code}","dnsappcat":"%s{dnsappcat}","dnsapp":"%s{dnsapp}","protocol":"%s{protocol}","company":"%s{company}","cloudname":"%s{cloudname}","devicename":"%s{devicename}","devicemodel":"%s{devicemodel}","deviceosversion":"%s{deviceosversion}","deviceostype":"%s{deviceostype}","deviceappversion":"%s{deviceappversion}","devicetype":"%s{devicetype}","datacenter":"%s{datacenter}","datacentercity":"%s{datacentercity}","datacentercountry":"%s{datacentercountry}"\}\}
Tunnel Logs Feed
| Parameter | Value |
|---|---|
NSS Type | NSS for Web |
Log Type | Tunnel |
Record Type | IKE Phase 1, IKE Phase 2, Sample, Tunnel Event |
Feed Output Type | JSON |
JSON Array Notation | Enabled |
Feed Escape Character |
|
Time Zone | GMT |
Feed Output Format
IKE Phase 1
\{"sourcetype":"zscalernss-tunnel","event":\{"datetime":"%d{yy}-%02d{mth}-%02d{dd} %02d{hh}:%02d{mm}:%02d{ss}","destinationport":"%d{dstport}","tunneltype":"IPSEC IKEV %d{ikeversion}","ikeversion":"%d{ikeversion}","lifetime":"%d{lifetime}","recordid":"%d{recordid}","sourceport":"%d{srcport}","spi_in":"%lu{spi_in}","spi_out":"%lu{spi_out}","algo":"%s{algo}","authentication":"%s{authentication}","authtype":"%s{authtype}","destinationip":"%s{destvip}","location":"%s{locationname}","sourceip":"%s{sourceip}","Recordtype":"%s{tunnelactionname}","vendorname":"%s{vendorname}","user":"%s{vpncredentialname}"\}\}
IKE Phase 2
\{"sourcetype":"zscalernss-tunnel","event":\{"datetime":"%d{yy}-%02d{mth}-%02d{dd} %02d{hh}:%02d{mm}:%02d{ss}","tunneltype":"IPSEC IKEV %d{ikeversion}","destportstart":"%d{destportstart}","ikeversion":"%d{ikeversion}","lifebytes":"%d{lifebytes}","lifetime":"%d{lifetime}","recordid":"%d{recordid}","spi":"%d{spi}","srcportstart":"%d{srcportstart}","algo":"%s{algo}","authentication":"%s{authentication}","authtype":"%s{authtype}","destipend":"%s{destipend}","destipstart":"%s{destipstart}","destinationip":"%s{destvip}","location":"%s{locationname}","protocol":"%s{protocol}","sourceip":"%s{sourceip}","srcipend":"%s{srcipend}","srcipstart":"%s{srcipstart}","Recordtype":"%s{tunnelactionname}","tunnelprotocol":"%s{tunnelprotocol}","user":"%s{vpncredentialname}"\}\}
Tunnel Event
\{"sourcetype":"zscalernss-tunnel","event":\{"datetime":"%d{yy}-%02d{mth}-%02d{dd} %02d{hh}:%02d{mm}:%02d{ss}","recordid":"%d{recordid}","sourceport":"%d{srcport}","destinationip":"%s{destvip}","tunnelstatus":"%s{event}","tunnelstatusreason":"%s{eventreason}","location":"%s{locationname}","sourceip":"%s{sourceip}","Recordtype":"%s{tunnelactionname}","user":"%s{vpncredentialname}","tunneltype":"%s{tunneltype}"\}\}
Sample
\{"sourcetype":"zscalernss-tunnel","event":\{"datetime":"%d{yy}-%02d{mth}-%02d{dd} %02d{hh}:%02d{mm}:%02d{ss}","dpdrec":"%d{dpdrec}","recordid":"%d{recordid}","rxpackets":"%d{rxpackets}","sourceport":"%d{srcport}","txpackets":"%d{txpackets}","rxbytes":"%lu{rxbytes}","txbytes":"%lu{txbytes}","destinationip":"%s{destvip}","location":"%s{locationname}","sourceip":"%s{sourceip}","Recordtype":"%s{tunnelactionname}","user":"%s{vpncredentialname}","tunneltype":"%s{tunneltype}"\}\}
Admin Audit Logs Feed
| Parameter | Value |
|---|---|
NSS Type | NSS for Web |
Log Type | Admin Audit Logs |
Feed Output Type | JSON |
JSON Array Notation | Enabled |
Feed Escape Character |
|
Time Zone | GMT |
Feed Output Format
\{ "sourcetype" : "zscalernss-audit", "event" :\{"time":"%s{time}","recordid":"%d{recordid}","action":"%s{action}","category":"%s{category}","subcategory":"%s{subcategory}","resource":"%s{resource}","interface":"%s{interface}","user":"%s{adminid}","clientip":"%s{clientip}","result":"%s{result}","errorcode":"%s{errorcode}","auditlogtype":"%s{auditlogtype}","preaction":%s{preaction},"postaction":%s{postaction}\}\}
After saving each feed, click the Test Connectivity button in the ZIA Admin Console to confirm logs are flowing to Dynatrace.
Details
The Zscaler Internet Access extension collects metrics and topology for:
- ZIA Location
- ZIA User
- ZIA Tunnel
Metrics are extracted from the following Zscaler Internet Access NSS Feed (configure each as a Cloud NSS Feed in your ZIA tenant):
The Zscaler Internet Access extension is packaged with:
- Per-log-type dashboards
- Unified analysis screens (entity detail and inventory) for each discovered ZIA entity
- Alert templates that serve as a starting point for data analysis
- Topology on the Smartscape on Grail
This extension does not include any feature sets. You control what data Zscaler sends to Dynatrace based on the configured Cloud NSS Feeds.
Smartscape on Grail
Node and edge extraction only runs once the zia.* metrics are routed into the extension's metrics pipeline—the metrics dynamic route configured in Configure the OpenPipeline dynamic routes. With that route in place and ZIA logs flowing, the ZIA Location, ZIA User, and ZIA Tunnel entities and their relationships populate in the Smartscape app automatically. Allow a few minutes for entities to appear.
To explore the topology, open the Smartscape app, filter for ZIA Location, ZIA User, or ZIA Tunnel, and select an entity to explore its connections.
Licensing and costs
There is no charge to use the extension. You are only charged for the data that the extension ingests.
The Zscaler Internet Access extension processes logs ingested from the NSS log feeds and extracts metrics from those logs. The extracted metrics consume Davis Data Units (DDUs) (Dynatrace classic license) or Metrics powered by Grail (DPS), according to your license model.
Dynatrace Platform Subscription
In the Dynatrace Platform Subscription, metric ingestion consumes Metrics powered by Grail according to the number of ingested metric data points.
The following formula provides approximate data points ingested per minute, assuming all NSS feeds are enabled.
(( 4 unique web metrics * dimension combinations ) -- web feed (zscalernss-web)+ ( 5 unique firewall metrics * dimension combinations ) -- firewall feed (zscalernss-fw)+ ( 2 unique DNS metrics * dimension combinations ) -- dns feed (zscalernss-dns)+ ( 6 unique tunnel metrics * dimension combinations ) -- tunnel feed (zscalernss-tunnel, Tunnel Samples only)+ ( 2 unique admin-audit metrics * dimension combinations ) -- audit feed (zscalernss-audit)) * 60 minutes * 24 hours * 365 days data points per year
A "dimension combination" is a distinct set of values across a metric's dimensions. Omit any line for a feed you don't configure.
Dynatrace classic license
In the classic licensing model, metric ingestion consumes Davis Data Units (DDUs) at the rate of .001 DDUs per metric data point. Multiply the above formula for annual data points by .001 to estimate annual DDU usage.
DDUs consumed by this extension are eligible for the free tier included with every host.
FAQ
Do I have to use the exact feed parameters and output format shown in the setup?
Yes. All feed parameters and the Feed Output Format listed for each feed in Configure the Zscaler Internet Access Cloud NSS feeds must be configured exactly as documented. The extension's OpenPipeline parsers match each feed on its sourcetype value and then read fields out of the JSON payload by their exact names, so a changed sourcetype, an output type other than JSON, or renamed or missing fields mean the logs are still ingested but are not parsed. Without parsing, no metrics are extracted, and the dashboards, alerts, and Smartscape topology that depend on them stay empty.
I do not see any ZIA entities in Smartscape.
Confirm both OpenPipeline dynamic routes exist: the logs route (matchesPhrase(sourcetype, "zscalernss")) and the metrics route (matchesValue(metric.key, "zia.*")). Entities are built from the extracted metrics, so without the metrics route no topology is discovered. Allow a few minutes after logs start flowing.
I see no data in a dashboard or chart.
Empty charts usually mean the corresponding feed isn't configured, or its field names don't match the expected NSS output format. Verify the feed exists in the ZIA Admin Console and that its Feed Output Format matches the format in Configure the Zscaler Internet Access Cloud NSS feeds exactly.
I do not see tunnel throughput even though the Tunnel feed is enabled.
Tunnel throughput and DPD metrics are extracted only from Tunnel Samples records. Make sure the Tunnel feed's record types include Sample, and note that IKE Phase and Tunnel Event records won't contribute to those metrics.
My alert templates are not triggering.
Alert templates are disabled by default. Enable them from the extension's Content page. Enabling adds them to Anomaly Detection. Also check that the metric an alert depends on is actually being produced (the underlying feed must be configured), and adjust the default thresholds to your environment.
How do I limit costs?
Configure only the ZIA feeds you need, and trim each feed's output format to the fields the extension parses. See Licensing and costs.