Cisco Catalyst Center (DNA Center) extension
- Latest Dynatrace
- Extension
Monitor Cisco Catalyst Center (DNA Center) network infrastructure with device health, performance, client experience, and topology insights.
Get started
Overview
Cisco Catalyst Center is formerly known as Cisco DNA.
Collect information about networks that are managed by the Cisco Catalyst Center.
This extension assumes that you:
- Use Dynatrace for infrastructure monitoring.
- Run Cisco Catalyst Center in their environment.
- Look to extend Dynatrace insights into the Cisco Catalyst platform.
The Cisco Catalyst Center extension uses the Cisco Catalyst API to collect information about networks that are managed by Cisco Catalyst Center.
Use cases
- Integrate operational monitoring of the infrastructure, including Cisco Catalyst and leveraging additional organization, network and device metadata.
- Get root cause analysis of network issues, in the light of the entire application and infrastructure landscape observed by Dynatrace.
- Collect network infrastructure data without having to poll individual devices.
Requirements
-
Network access from a Dynatrace ActiveGate to the Cisco Catalyst Center.
-
You have configured the Cisco Catalyst Center.
-
Optional You have created a
read-onlyrole specific for API access. A specific role is not required, but is necessary for privilege management. If not used, the pre-defined role is used by default.To create a role:
- Go to System > Users & Roles > Role Based Access Control > Create a New Role.
- Define the name (for example,
API-READONLY-ROLE) and an optional description. - For all privileges, select READ.
-
You have created a user for API integration. To create a user:
- Go to System > Users & Roles > User Management > Add User.
- Select a role, whether the read-only role or the pre-defined role.
-
Optional Check access control.
- Go to System > Trust & Privacy > IP Access Control
- If access control filtering is enabled, add the IP address of your Dynatrace system.
Compatibility information
- For Dynatrace Cisco Catalyst Center (DNA Center) extension 3.x:
- Cisco Catalyst Center (DNA) version 2.3.7.6+
- Cisco Catalyst Center API version 2.3.7.6, 2.3.7.9, 3.1.3.0, or 3.1.6.0.
- If your exact version is not listed, the extension is expected to work correctly. Cisco does not publish a new API specification version with every Catalyst Center release—the same API version may cover multiple consecutive platform releases.
- If you're using an earlier Catalyst Center API version, use the Dynatrace Cisco Catalyst Center (DNA Center) extension 2.x version instead.
Activation and setup
To enable the extension, find Cisco Catalyst Center (DNA Center) in the Dynatrace Hub.
Details
This extension can monitor the following entities:
- Catalyst Center
- Catalyst Site
- Catalyst Device
- Catalyst Interface
The extension offers the following features:
- Insights into the configuration, locations, and health status of devices and their interfaces.
- Analysis screens present data hierarchically, helping to quickly diagnose issues by site, role or by device platform.
- Performance and health metrics as well as Cisco Catalyst issues/events. Basic statistics of client devices are also available.
- Extension code (Python) that connects to the Cisco Catalyst API endpoints and scrapes the metrics.
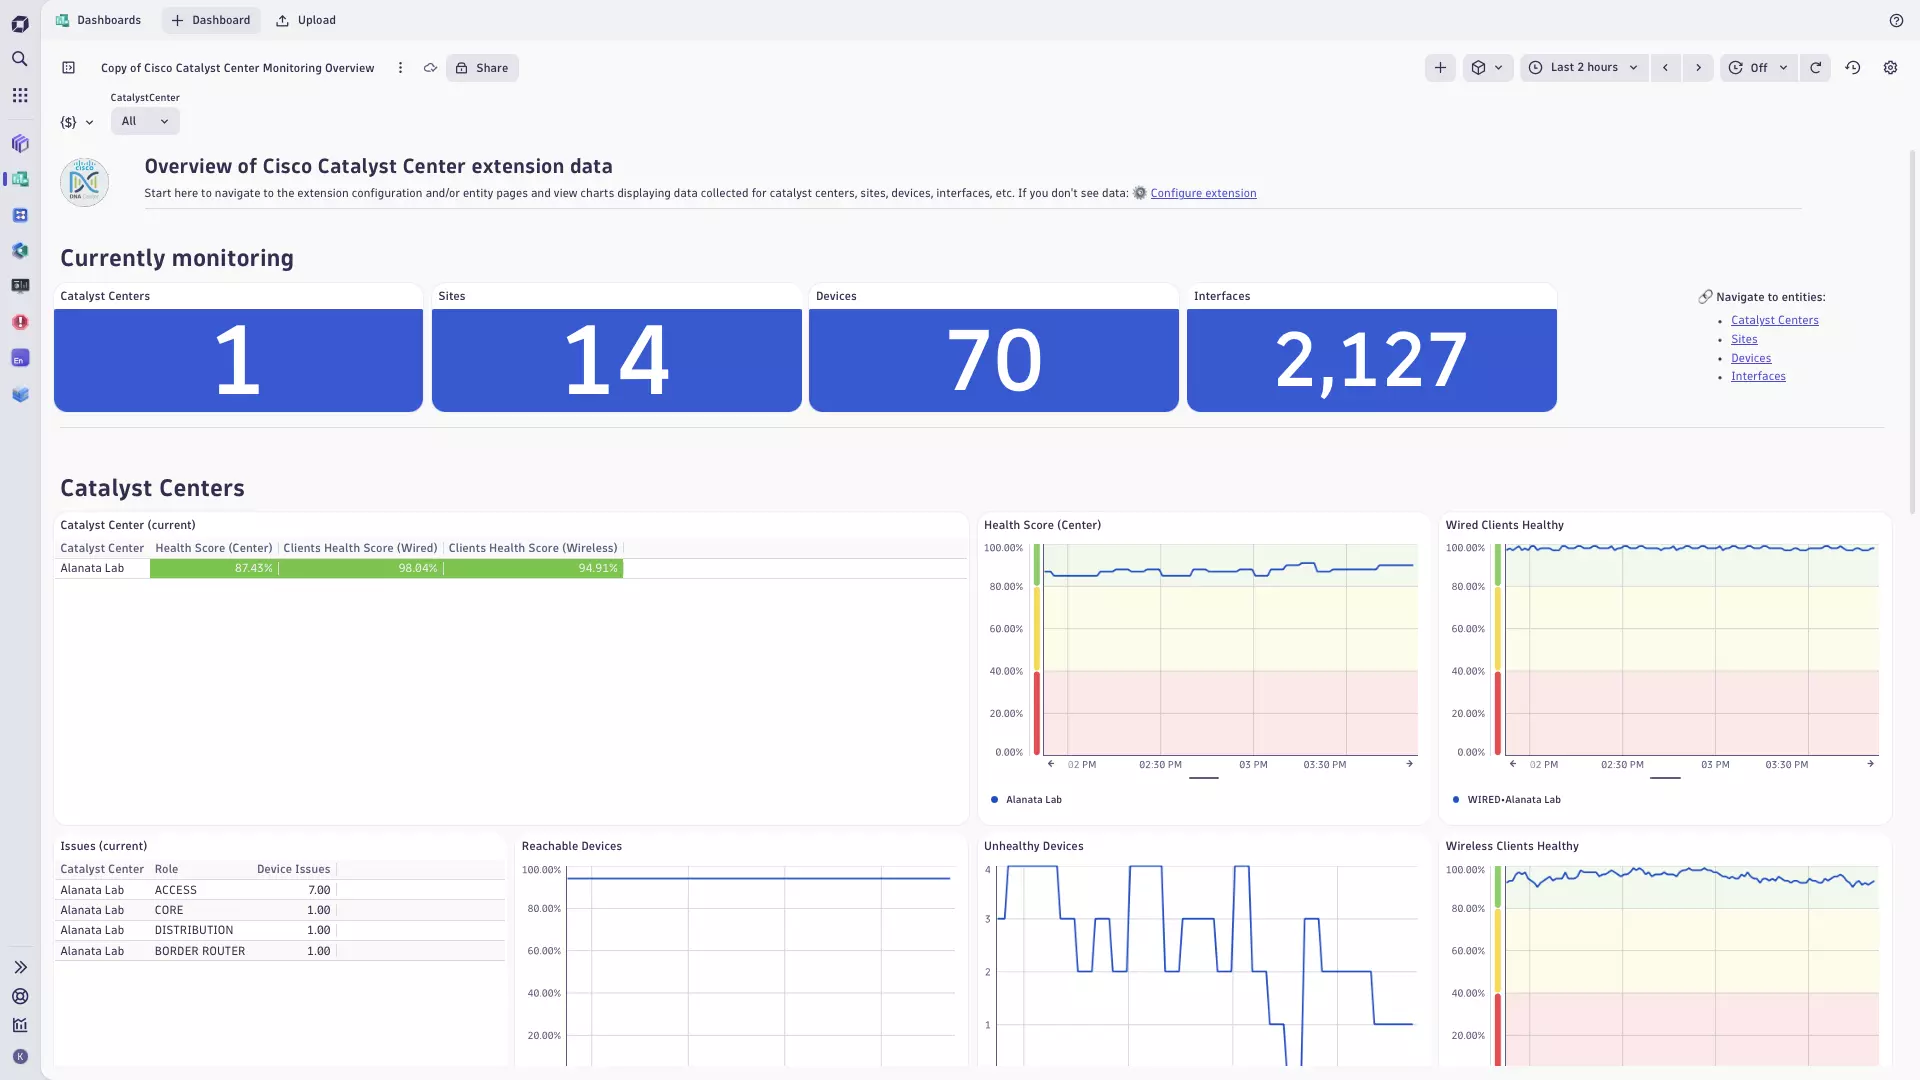
- A dashboard offering high-level Cisco Catalyst platform overview.
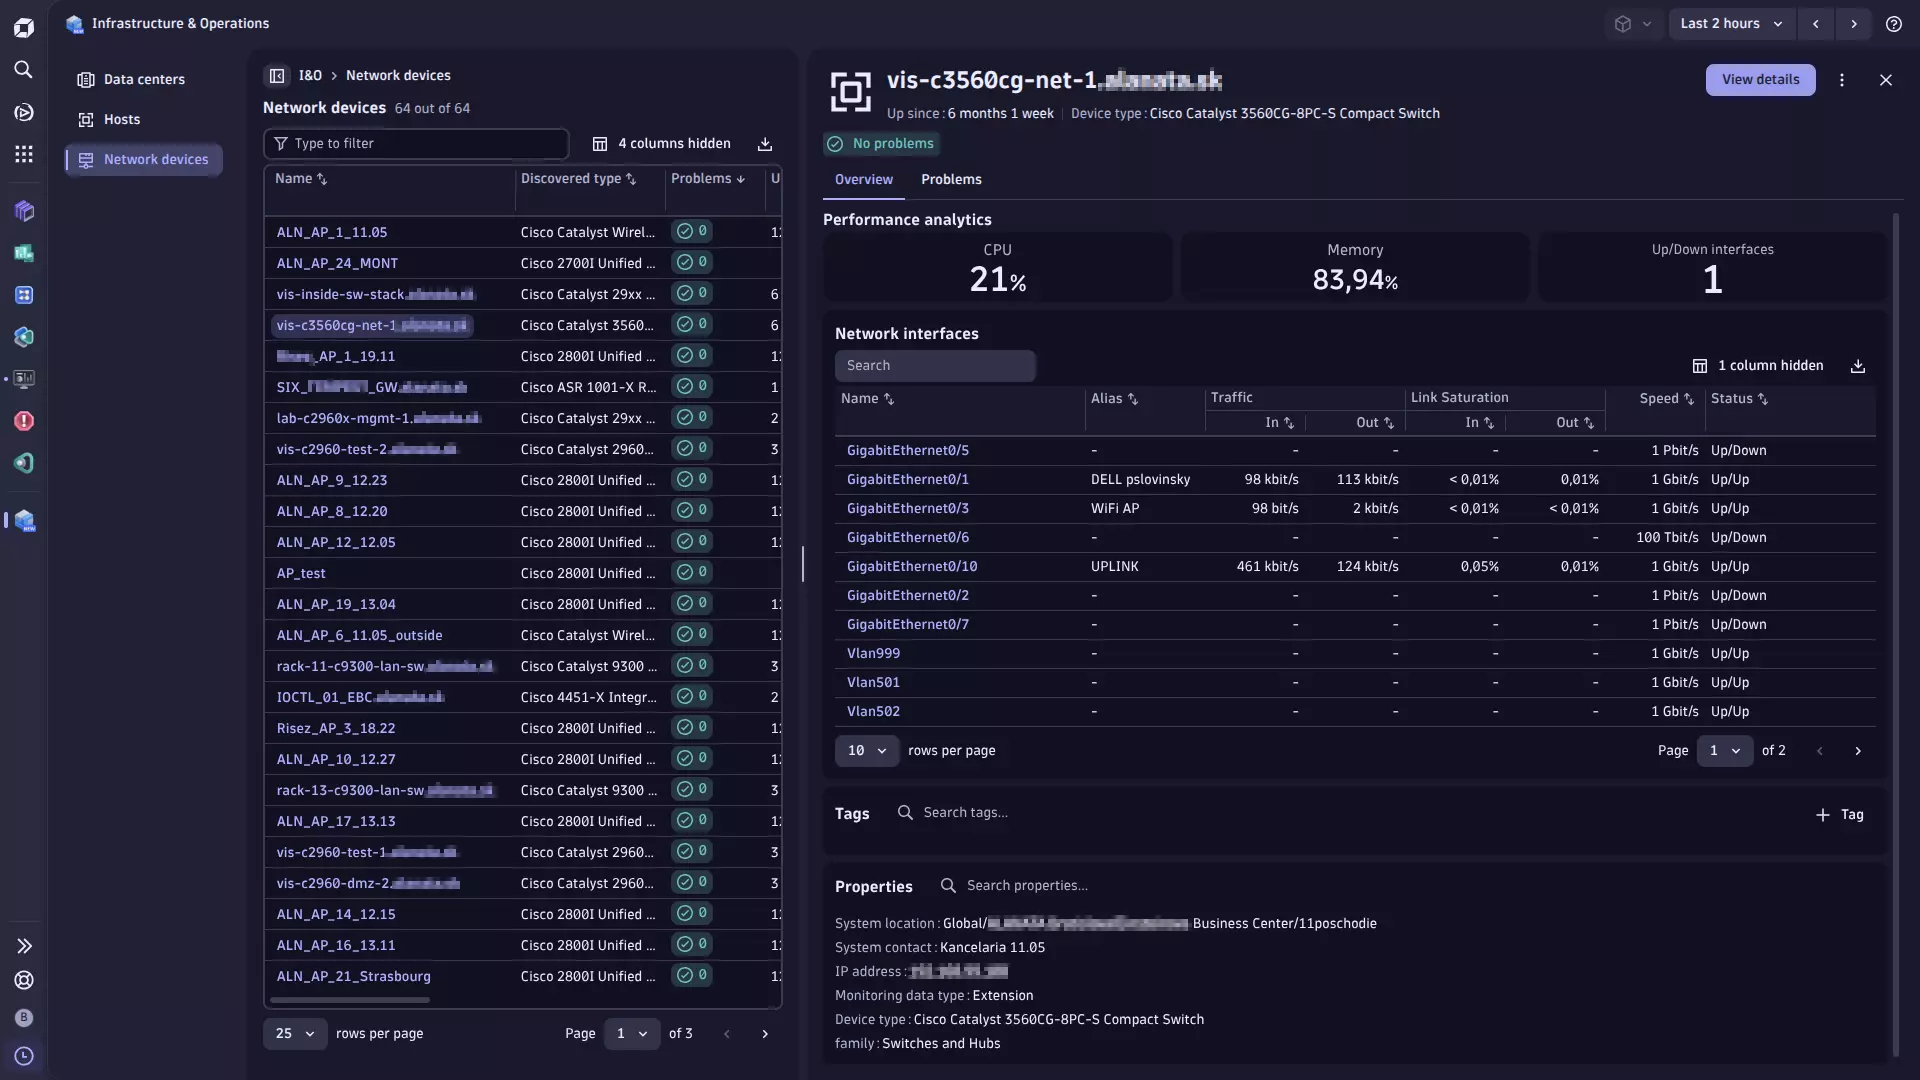
- Unified Analysis pages for Cisco Catalyst Center, devices, sites and interfaces.
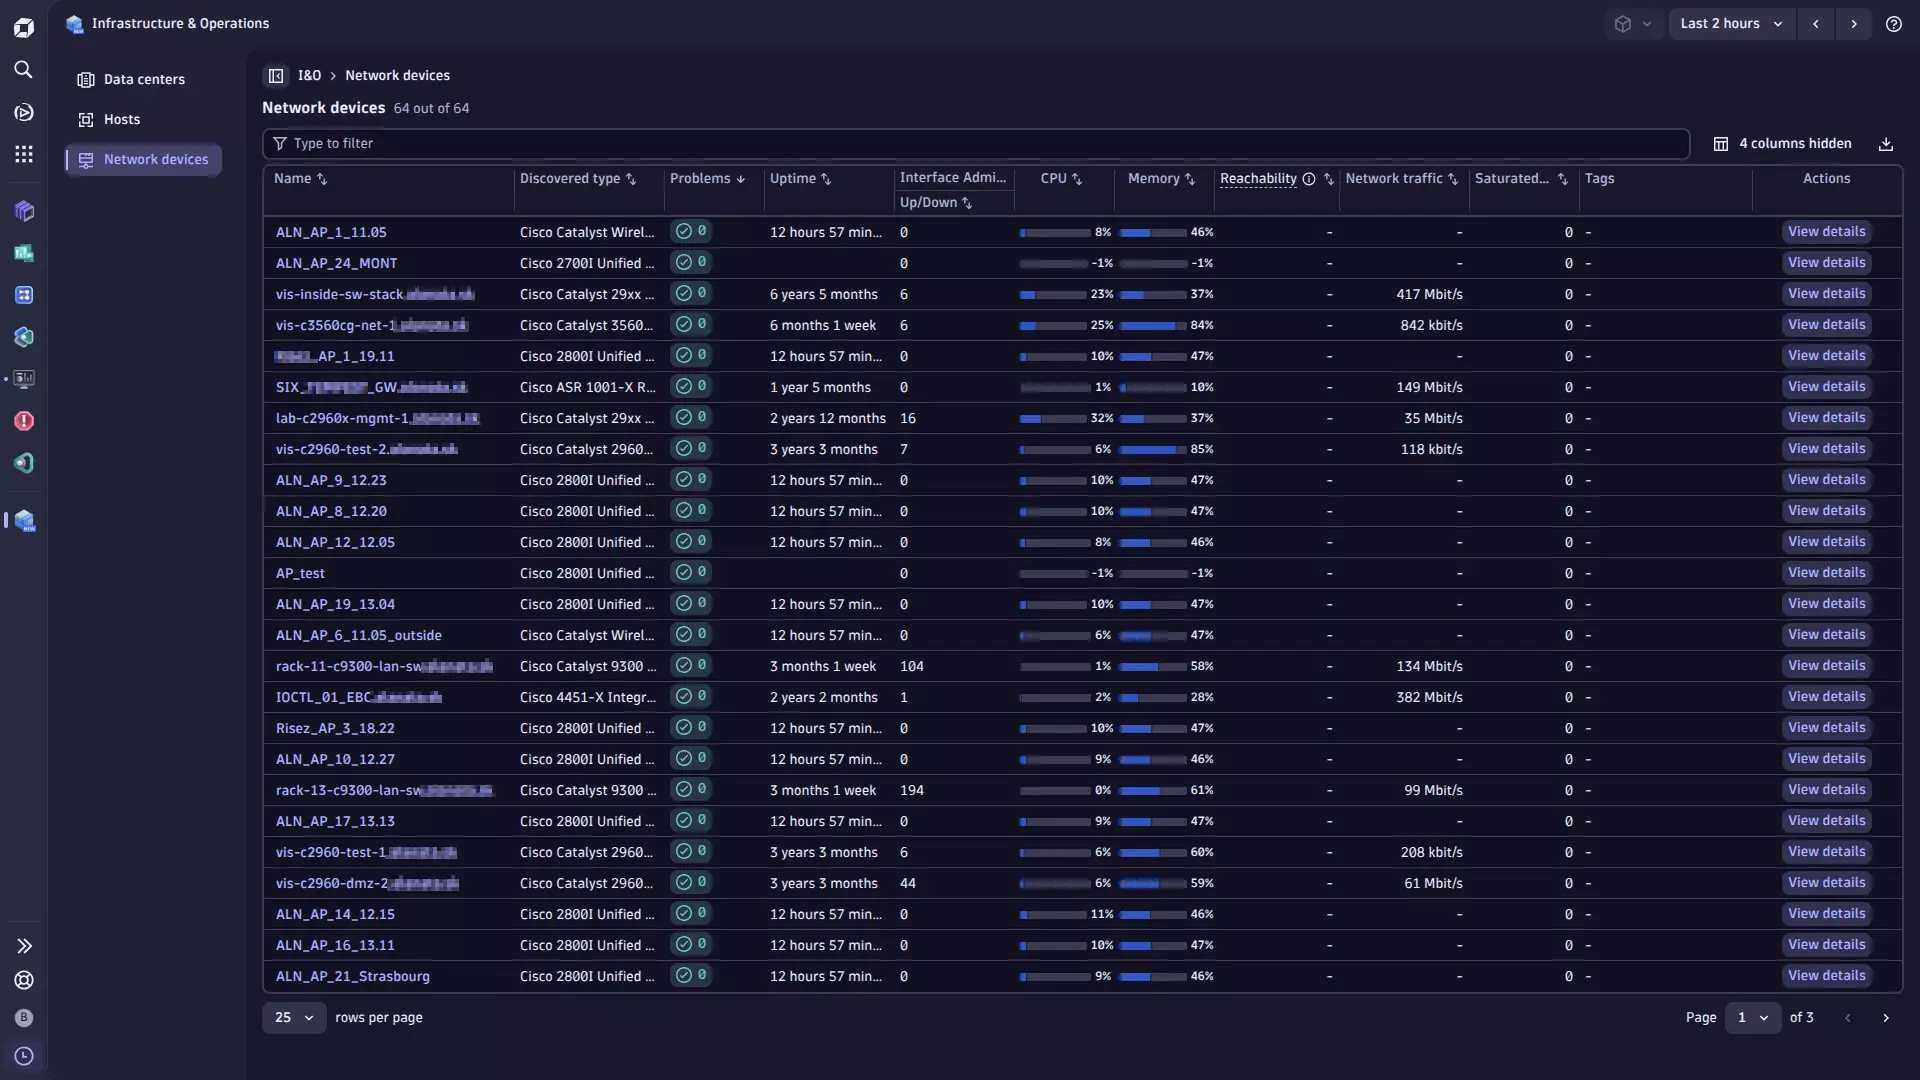
- Analysis screens integrated with
 Infrastructure & Operations.
- Optional issue reporting and event generation based on Catalyst Center issues, configurable to fit your environment.
- Flexible device reporting strategies for adapting data collection to environments of any size.
Reporting strategies
The extension supports three reporting strategies that control how devices are grouped for metric collection. Choose the strategy that fits your environment size and monitoring requirements.
Simple Recommended
The Simple strategy produces the minimum number of API queries and is the easiest configuration to understand and maintain.
All devices are reported using a single, uniform configuration consisting of a collection frequency and a optional device filter applied to the entire Catalyst Center.
The device filter is a combination of three property types: Device Families, Device Roles, and Catalyst Tag Names.
- If you select multiple values for the same property type, the filter evaluates them using
OR. A device matches if it satisfies any of the selected values for that type. - If you configure multiple property types, the filter combines them using
AND. A device must satisfy the condition for each configured property type to be included. Empty property types are excluded from filtering and don't restrict the match.
Flexible Groups
Define multiple reporting groups, each consisting of one collection frequency and one device filter. Groups are evaluated from highest frequency to lowest. A device is reported at the frequency of the first group that matches the filter. Devices that don't match any group aren't reported.
Use the Flexible Groups strategy if different subsets of devices in your environment need different collection frequencies, for example, core switches reported every five minutes and access switches every fifteen minutes.
When you use tag-based filters and a device carries multiple tags, the device might match the filter criteria for more than one group and be polled by multiple queries, even though its metrics are reported only once. In large environments (5,000+ devices) the Flexible Groups strategy can add unnecessary polling load. We recommend to use the Exclusive Groups strategy instead.
Exclusive Groups
Partition devices into strictly separate groups, each associated with exactly one value of a chosen dimension: Family, Role, or Tags.
Use the Tags dimension for the most flexible partitioning. You can assign dedicated catalyst tags to device groups independently of their family or role classification.
The Exclusive Groups strategy guarantees that each device is queried by exactly one reporting group. It eliminates redundant queries by design, without relying on runtime deduplication. It's recommended for large environments (5,000+ devices).
Issue reporting and Dynatrace event integration
The extension includes support for ingesting issues from Catalyst Center.
Issues are either reported as log messages or raised as Dynatrace events.
-
Issues can be reported as log messages. You can configure filtering by issue priority to report only the relevant ones.
-
Issues can be raised as Dynatrace events. This enables the following advanced capabilities:
- Custom event type mapping: Map issue priorities or device families to specific Dynatrace event types (e.g.,
ERROR_EVENT,CUSTOM_ALERT,CUSTOM_INFO). - Default and conditional event overrides: Use a default event type (
ERROR_EVENT) with support for condition-based overrides. - Event Suppression: Optionally suppress certain events entirely using a special suppression value.
Event generation applies only to issues that are already enabled for log message reporting.
- Custom event type mapping: Map issue priorities or device families to specific Dynatrace event types (e.g.,
Catalyst Center events reporting and Dynatrace events ingest integration
The extension supports ingesting events and notifications from Cisco Catalyst Center. Catalyst Center events are reported as log messages, which are ingested by Dynatrace and can subsequently trigger Dynatrace events.
-
To report Catalyst Center events as log messages, configure Catalyst Center event queries by:
- Event ID (see the Cisco Catalyst Center Event Catalog),
- Type (
NETWORK,APP,SYSTEM,SECURITY,INTEGRATIONS), - Category (
INFO,WARN,ALERT,ERROR) to report only the relevant ones.
-
Catalyst Center events reported as log messages can also be raised as Dynatrace events.
Extension metrics grouping via feature sets
Metrics collected by the Cisco Catalyst extension are categorized in the following feature sets:
- Default: Provides an overview of the overall health status in Cisco Catalyst Center.
Includes interface and device-specific metrics used in Infrastructure & Operations. - Center: Contains overall network health metrics, client counts, and site-level metrics for Catalyst Sites managed by Cisco Catalyst Center.
- Device: Covers metrics for Catalyst Devices managed by Cisco Catalyst Center.
- Interface: Captures metrics for Catalyst Interfaces on managed devices.
- Self-monitoring: Optional Metrics for fine-tuning and diagnostics of the extension itself.
Discovery frequencies adjustment
If you reduce the metrics collection frequency (for example, when adapting to a large environment constraints), it is also recommended to adjust discovery-related configuration parameters accordingly. These parameters should be increased proportionally, since they track semi-static attributes that do not need to be refreshed as frequently. Entity attributes and metrics dimension values are then updated according to the defined discovery frequencies.
These discovery intervals determine how often relatively static attributes are queried from Cisco Catalyst Center. By increasing these values proportionally, you reduce unnecessary load without compromising data accuracy.
| Parameter | Recommended multiplier | Recommended frequency, based on a five-minute metric frequency |
|---|---|---|
Sites discovery frequency | 12 | 60 minutes |
Devices discovery frequency | 6 | 30 minutes |
Interfaces discovery frequency | 3 | 15 minutes |
Licensing and costs
Using the extension consumes your Dynatrace license based on the number of metric data points and log volume the extension ingests.
License consumption depends on which licensing model you use: Dynatrace Platform Subscription (DPS) or Classic License.
- Dynatrace Platform Subscription (DPS): Billed per metric data point and per GiB of log ingest.
- Classic License:
.001 DDUsper metric data point;.0005 DDUsper log line. For more information, see DDUs for metrics.
Metric data points
The extension reports metrics in two independent schedules:
- Center and site metrics run at the shared
Metrics Collection Frequencyinterval. - Device and interface metrics run per reporting group, each with its own frequency.
For the Simple strategy there is one group. For Flexible Groups or Exclusive Groups, sum over all defined groups.
// Center and site metrics (featureSets: center, site)// runs at <metrics_collection_frequency> minutes(8 // center-level: health score, device counts, client counts, cc events+ 9 * <Number of sites> // per site: client health, device counts, issue count) * 60 / <metrics_collection_frequency> * 24 * 365// Device and interface metrics (featureSets: default, device, interface)// For each reporting group g with frequency f_g and its monitored device/interface set:+ SUM over all reporting groups g:(14 * <Devices in group g> // cpu, memory, uptime, health, reachability,// temperature, issue count/events, memory size,// total interface count+ 3 * <Interfaces in group g> // admin status, oper status, if.status+ 11 * <UP interfaces in group g> // speed, tx/rx rate, utilization, discards, errors,// bytes_in, bytes_out) * 60 / f_g * 24 * 365// Optional: self-monitoring metrics (featureSet: self-monitoring)// ~38 metrics at <metrics_collection_frequency>; error-tracking metrics reported only when errors occur+ ~38 * 60 / <metrics_collection_frequency> * 24 * 365
For the Simple strategy with a single uniform frequency f, the device term simplifies to:
( 14 * <Total monitored devices>+ 3 * <Total monitored interfaces>+ 11 * <Total UP interfaces>) * 60 / f * 24 * 365
Log volume
Discovery runs report entity attributes as log events. Log ingest costs apply. Assume an estimated size of 5,000 bytes per log record.
(1 * <Number of sites> // site discovery log events) * 60 / <sites_discovery_frequency> * 24 * 365+ (1 * <Number of monitored devices> // device discovery log events) * 60 / <devices_discovery_frequency> * 24 * 365+ (1 * <Number of monitored interfaces> // interface discovery log events) * 60 / <interfaces_discovery_frequency> * 24 * 365
Multiply the total annual log record count by 0.000005 GiB to get annual log ingest volume.
Feature sets
When activating your extension using a monitoring configuration, you can limit monitoring to one of the feature sets. To work properly, the extension has to collect at least one metric after the activation.
In highly segmented networks, feature sets can reflect the segments of your environment. Then, when you create a monitoring configuration, you can select a feature set and a corresponding ActiveGate group that can connect to this particular segment.
All metrics that aren't categorized into any feature set are considered to be the default and are always reported.
A metric inherits the feature set of a subgroup, which in turn inherits the feature set of a group. Also, the feature set defined on the metric level overrides the feature set defined on the subgroup level, which in turn overrides the feature set defined on the group level.
default
| Metric name | Metric key | Description |
|---|---|---|
| — | com.dynatrace.extension.network_device.cpu_usage | — |
| — | com.dynatrace.extension.network_device.memory_usage | — |
| — | com.dynatrace.extension.network_device.sysuptime | — |
| — | com.dynatrace.extension.network_device.memory_total | — |
| — | com.dynatrace.extension.network_device.if.status | — |
| — | com.dynatrace.extension.network_device.if.bytes_in.count | — |
| — | com.dynatrace.extension.network_device.if.bytes_out.count | — |
self-monitoring
| Metric name | Metric key | Description |
|---|---|---|
| Device Count Query Duration | sfm.cisco.cc.get_devices_by_query_count.duration | Duration of the get_devices_by_query_count API call used to determine total device count before paginated collection. |
| Device Count Query Errors | sfm.cisco.cc.get_devices_by_query_count.error | Number of errors during get_devices_by_query_count API call. |
| Device Query Page Duration | sfm.cisco.cc.get_devices_by_query.duration | Duration of a single paginated get_devices_by_query API call used to collect device data. |
| Device Query Page Errors | sfm.cisco.cc.get_devices_by_query.error | Number of errors during a paginated get_devices_by_query API call. |
| Device Discovery Count Query Duration | sfm.cisco.cc.get_network_devices_count_by_params.duration | Duration of the get_network_devices_count_by_params API call used to determine device count during BASIC discovery. |
| Device Discovery Count Query Errors | sfm.cisco.cc.get_network_devices_count_by_params.error | Number of errors during get_network_devices_count_by_params API call. |
| Device Discovery Query Page Duration | sfm.cisco.cc.get_network_devices_by_params.duration | Duration of a single paginated get_network_devices_by_params API call used for BASIC device discovery. |
| Device Discovery Query Page Errors | sfm.cisco.cc.get_network_devices_by_params.error | Number of errors during a paginated get_network_devices_by_params API call. |
| Physical Topology Query Duration | sfm.cisco.cc.get_physical_topology.duration | Duration of the get_physical_topology API call used to collect physical network topology data. |
| Physical Topology Query Errors | sfm.cisco.cc.get_physical_topology.error | Number of errors during get_physical_topology API call. |
| Site Count Query Duration | sfm.cisco.cc.get_sites_count.duration | Duration of the get_sites_count API call used to determine total site count before paginated collection. |
| Site Count Query Errors | sfm.cisco.cc.get_sites_count.error | Number of errors during get_sites_count API call. |
| Site Query Page Duration | sfm.cisco.cc.get_sites.duration | Duration of a single paginated get_sites API call used to collect site data. |
| Site Query Page Errors | sfm.cisco.cc.get_sites.error | Number of errors during a paginated get_sites API call. |
| Site Topology Query Duration | sfm.cisco.cc.get_sites_topology.duration | Duration of the get_sites_topology API call used to collect site hierarchy topology. |
| Site Topology Query Errors | sfm.cisco.cc.get_sites_topology.error | Number of errors during get_sites_topology API call. |
| Interface Count Query Duration | sfm.cisco.cc.get_interfaces_by_query_count.duration | Duration of the get_interfaces_by_query_count API call used to determine total interface count before paginated collection. |
| Interface Count Query Errors | sfm.cisco.cc.get_interfaces_by_query_count.error | Number of errors during get_interfaces_by_query_count API call. |
| Interface Query Page Duration | sfm.cisco.cc.get_interfaces_by_query.duration | Duration of a single paginated get_interfaces_by_query API call used to collect interface data. |
| Interface Query Page Errors | sfm.cisco.cc.get_interfaces_by_query.error | Number of errors during a paginated get_interfaces_by_query API call. |
| Interface Discovery Count Query Duration | sfm.cisco.cc.get_intent_api_interfaces_count.duration | Duration of the get_intent_api_interfaces_count API call used to determine interface count during Intent API discovery. |
| Interface Discovery Count Query Errors | sfm.cisco.cc.get_intent_api_interfaces_count.error | Number of errors during get_intent_api_interfaces_count API call. |
| Interface Discovery Query Page Duration | sfm.cisco.cc.get_intent_api_interfaces.duration | Duration of a single paginated get_intent_api_interfaces API call used for Intent API interface discovery. |
| Interface Discovery Query Page Errors | sfm.cisco.cc.get_intent_api_interfaces.error | Number of errors during a paginated get_intent_api_interfaces API call. |
| Network Health Query Duration | sfm.cisco.cc.get_network_health.duration | Duration of the get_network_health API call used to collect overall network health scores. |
| Network Health Query Errors | sfm.cisco.cc.get_network_health.error | Number of errors during get_network_health API call. |
| Client Health Query Duration | sfm.cisco.cc.get_client_health.duration | Duration of the get_client_health API call used to collect client health scores. |
| Client Health Query Errors | sfm.cisco.cc.get_client_health.error | Number of errors during get_client_health API call. |
| Site Health Summaries Query Duration | sfm.cisco.cc.get_site_health_summaries.duration | Duration of the get_site_health_summaries API call used to collect site-level health summary data. |
| Site Health Summaries Query Errors | sfm.cisco.cc.get_site_health_summaries.error | Number of errors during get_site_health_summaries API call. |
| Issues Query Duration | sfm.cisco.cc.issues.duration | Duration of the issues API call used to collect Catalyst Center issues data. |
| Issues Query Errors | sfm.cisco.cc.issues.error | Number of errors during issues API call. |
| Event Notifications Query Duration | sfm.cisco.cc.events.duration | Duration of the events API call used to collect Catalyst Center event notifications data. |
| Event Notifications Query Errors | sfm.cisco.cc.events.error | Number of errors during events API call. |
| Group Records Fetched | sfm.cisco.cc.group.records_fetched.gauge | Total number of raw device or interface records fetched from the API for this reporting configuration group. |
| Group Entities Reported | sfm.cisco.cc.group.entities_reported.gauge | Number of entities (devices or interfaces) reported to Dynatrace for this reporting configuration group. |
| Group Overlap Devices | sfm.cisco.cc.group.overlap_devices.gauge | Number of devices matching this group filter that are reported by a different reporting configuration. Only emitted when OVERLAP strategy is active and overlap count is greater than zero. |
site
| Metric name | Metric key | Description |
|---|---|---|
| Wired Clients Score | cisco.cc.site.client_health_wired | Site's Wired Clients Health Score |
| Wireless Clients Score | cisco.cc.site.client_health_wireless | Site's Wireless Clients Health Score |
| Clients | cisco.cc.site.client_count.gauge | Site's Clients Summary Count |
| Wired Clients | cisco.cc.site.wired_client_count.gauge | Site's Wired Clients Summary Count |
| Wireless Clients | cisco.cc.site.wireless_client_count.gauge | Site's Wireless Clients Summary Count |
| Healthy Clients | cisco.cc.site.client_good_health_percentage | Site's Healthy Clients Summary Percentage |
| Devices | cisco.cc.site.network_device_count.gauge | Site's Devices Summary Count |
| Healthy Devices | cisco.cc.site.network_device_good_health_percentage | Site's Healthy Devices Summary Percentage |
| Site Issues | cisco.cc.site.issue_count.gauge | Pending Site Issues |
center
| Metric name | Metric key | Description |
|---|---|---|
| Health score (Center) | cisco.cc.center.health_score | Cisco Catalyst Network topology - Overall health score |
| Healthy devices | cisco.cc.center.healthy_devices | Cisco Catalyst Network topology - Healthy devices |
| Unhealthy devices | cisco.cc.center.unhealthy_devices | Cisco Catalyst Network topology - Unhealthy devices |
| Clients health score | cisco.cc.client.health_score | Cisco Catalyst Client - Overall client health score |
| Clients Count | cisco.cc.client.client_count.gauge | Cisco Catalyst Client - Clients count |
| Unique Clients Count | cisco.cc.client.client_unique_count.gauge | Cisco Catalyst Client - Unique Clients Count |
| Clients health score count | cisco.cc.client.health_score_count.gauge | Cisco Catalyst Client - Clients health score by score type |
| Catalyst Center Notification Count | cisco.cc.center.notification_count.gauge | Number of Cisco Catalyst Center event notifications reported per collection interval |
device
| Metric name | Metric key | Description |
|---|---|---|
| Health | cisco.cc.device.health | Device's Health |
| CPU | cisco.cc.device.cpu | Device's CPU consumption |
| Memory | cisco.cc.device.memory | Device's Memory consumption |
| Average Temperature | cisco.cc.device.temperature | Device's Avg Temperature |
| Device Issues | cisco.cc.device.issue_count.gauge | Pending Device Issues |
| Reachability | cisco.cc.device.reachability | Device's Reachability (1: Reachable | 0: Not Reachable) |
| Uptime | cisco.cc.device.uptime.gauge | Device Uptime in Seconds |
| Issue Events | cisco.cc.device.issue_events.gauge | Issue events over selected timeframe |
interface
| Metric name | Metric key | Description |
|---|---|---|
| Interface Count | cisco.cc.device.total_interface_count.gauge | Total Number of Interfaces for Device |
| Admin Status | cisco.cc.interface.admin_status | Interface's Admin Status (1: UP | 0: DOWN) |
| Oper Status | cisco.cc.interface.oper_status | Interface's Status (1: UP | 0: DOWN) |
| Speed | cisco.cc.interface.speed | — |
| TX Rate | cisco.cc.interface.txRate | — |
| TX Utilization | cisco.cc.interface.txUtilization | — |
| TX Discards | cisco.cc.interface.txDiscards | — |
| TX Errors | cisco.cc.interface.txError | — |
| RX Rate | cisco.cc.interface.rxRate | — |
| RX Utilization | cisco.cc.interface.rxUtilization | — |
| RX Discards | cisco.cc.interface.rxDiscards | — |
| RX Errors | cisco.cc.interface.rxError | — |
FAQ
How many devices/interfaces/sites can I monitor with this extension?
Practical tests reveal the following rule of thumb: 1,000 devices per each one minute monitoring interval.
This means that with a five-minute monitoring interval, it should be achievable to monitor 5,000 devices with a single ActiveGate.
The primary limiting factor in such estimations is the performance of the Catalyst Center itself. In large environments—particularly those with devices carrying many interfaces, where the total interface count reaches the order of hundreds of thousands—consider defining multiple collection configurations, assigning longer collection frequencies to some of the device groups. The right balance should be tuned according to your business requirements and the Catalyst Center's own performance.
This is an estimation. Results in your environment may vary, depending on:
-
The reporting strategy in use.
The Simple strategy uses the fewest API queries. Exclusive Groups has a predictable query count (one per group). Flexible Groups may issue more queries depending on how many groups are defined and whether query deduplication reduces overlaps.
-
The number of interfaces on each of the monitored devices.
-
The number of sites that the Catalyst Center manages.
-
Your Catalyst Center response time and network connection throughput between Catalyst Center and the ActiveGate.
The estimation assumes that
- You use the Simple reporting strategy, or an equivalent single-query configuration.
- You have six interfaces per device, or 30,000 interfaces per five-minute monitoring interval.
- You have 500 sites.
- Catalyst Center responds within single-digit seconds.
- The connection from Catalyst Center to ActiveGate is via a local area network.
- The Catalyst Center extension runs on an ActiveGate with the dedicated performance profile. See About Extensions for more details on performance profiles.
Should I split monitoring configuration into many instances to scale the extension out?
One monitoring configuration should track one Catalyst Center. Multiple monitoring configurations should be used to track multiple Catalyst Centers.
This is important to retain consistency in the Catalyst Center locations reporting. If you split a single Catalyst Center instance between more than one monitoring configuration, for example by using tag-based filters, you may end up with duplicate entities representing individual Catalyst Center locations. This results in double-counted metrics for these locations.
Can I increase monitoring intervals to five minutes, or 10 minutes, or 15 minutes?
We recommend a one-minute monitoring interval to retain high data fidelity for alerting and Dynatrace Intelligence reasoning. In very large environments, increasing monitoring interval may help with scalability; this however is always occupied with data fidelity loss. We don't recommend going beyond five.
Please note that data on entities that do not change often. This data is already collected less frequently and you can adjust it further. For more information, see Discovery frequencies adjustment.
Why are health, CPU, or memory values for some devices on the dashboard negative?
The Catalyst API returns negative values for non-reachable devices.
Do I need to enable all feature sets?
No, not all feature sets are required.
- The self-monitoring feature set is optional. It is only needed for fine-tuning and diagnostics of the extension itself.
- If you want to view platform screens (for generic network device and interface metrics) within Infrastructure & Operations, only the default feature set is needed.
- If you want to view both classic screens and all platform screens (for generic network device and interface metrics and for Cisco Catalyst device and interface metrics), enable all feature sets except self-monitoring.
I am getting a "SSL: CERTIFICATE_VERIFY_FAILED certificate verify failed" error (self-signed certificate in certificate chain error).
This indicates that the Catalyst endpoint uses a self-signed certificate. If you trust the endpoint, you can skip certification verification. To do this, in the connection settings, set Check SSL Certificate to false.
What if I need to configure separate proxy servers for different Catalyst endpoints?
If you need to use different HTTP proxy servers for different Catalyst endpoints, you should create a separate extension configuration for each proxy. The proxy defined in a configuration applies to all Catalyst endpoints within that configuration. To ensure that the correct proxy is used for each endpoint, define each proxy-endpoint pair in its own dedicated configuration.
Does the extension support monitoring of other entities, such as SSIDs or details on the access points?
Not yet.
We look forward to your feedback on the enhancements that would make this extension better fitted to your environment. Post your product idea in the Dynatrace community.
In the Python 3 log file, I see the error "Read timed out".
If you see a Read timed out message, it means the extension opened a connection to the Catalyst Center but didn't receive a response within the configured timeout. A common cause is that the extension is sending too many requests in a short time, causing the Catalyst Center to rate-limit or delay responses.
To troubleshoot:
-
Confirm that the network connection between the extension and the Catalyst Center is allowed.
-
If
DEC:CC10orHTTP 429messages appear in the log before theRead timed outerror, the Catalyst Center is rate-limiting the extension.A potential solution is to increase the Metrics Collection Frequency in the configuration, for example to 15 minutes, to reduce the overall request rate. If increasing the value helps, fine-tune it as needed. Also check that the page size settings in Expert Configuration (
devices_page_size,interfaces_page_size, and related fields) are set to their default values. The default values are the maximum allowed and reduce the number of requests. Smaller page sizes mean more requests. -
If
DEC:CC10orHTTP 429messages do not appear before theRead timed outerror, open the Cisco Catalyst Extension Self-Monitoring dashboard and look at the Overall Metrics Data Collection Time graph.Based on the value in the graph, increase the
client_timeout_secondssetting in the connection configuration to a value higher than the one shown in the graph.
The Dynatrace gateway reports the error "Memory threshold exceeded" in the ruxitagent_extensionmodule log.
This issue can be resolved in several ways. In some cases, applying just one of the following steps is sufficient, while in others a combination may be needed:
-
Use one configuration per Catalyst Center.
Each extension configuration monitors one Catalyst Center and caches its data in a single OS process. If you're monitoring many Catalyst Centers, or one large Catalyst Center that consumes significant memory, move each Catalyst Center to its own dedicated extension configuration. Each configuration runs as a separate OS process, distributing the memory load across multiple processes.
-
Increase RAM on the ActiveGate server. Allocating more RAM to the ActiveGate machine can help prevent memory limit breaches.
-
Increase Extension Execution Controller limits. Adjust the limits in the
extensionsuser.conffile as described in the Dynatrace documentation, see Extension Execution Controller custom configuration. For example, you can add:# Memory settingsdslimit_python_mem=3000mem_soft_limit_percent=70.0mem_hard_limit_percent=80.0
On the Cisco Catalyst Center Monitoring Overview dashboard, I can see data for sites and devices, but there is no data at all for interfaces.
The Dynatrace entity instance limit for interfaces is 100,000.
If your Catalyst Center contains more than 100,000 interfaces, you may have reached the Dynatrace entity instance limit for Network Interface and Catalyst Interface entities.
To verify this, run the following DQL query:
timeseries entity_count_per_entity_type =sum(dt.sfm.server.monitored_entities.entity_count_per_entity_type,filter: in(dt.me_type_name, array("network:interface", "cisco_cc:interface"))),by: { dt.me_type_name }| fieldsAdd entity_count_per_entity_type.single_value = arrayLast(entity_count_per_entity_type)| fields `entity type`=dt.me_type_name, `entity count`=entity_count_per_entity_type.single_value
If the value is greater than 100,000, contact Dynatrace Support and request an increase of the entity limit for network interfaces (network:interface) and Catalyst interfaces (cisco_cc:interface) to 2.4 million for your tenant.
I have a high number of queries from the extension to the Catalyst Center, or high DDU/DPS consumption. How can I reduce them?
Query volume and DPS consumption can be reduced in several ways.
-
Switch to a query-efficient reporting strategy.
The reporting strategy controls how many API queries are issued to Catalyst Center per collection cycle. Switching from Flexible Groups to Exclusive Groups or Simple strategy is the most effective single change for reducing query volume and DPS consumption.
- Simple (default)—one query per endpoint for all devices. Fewest queries; recommended for most environments.
- Exclusive Groups—one query per filter group; groups must not overlap. Predictable query count; best for large environments.
- Flexible Groups—one query per filter group; groups may overlap (deduplication applied). Most flexible, but highest query count.
-
Increase the Metric collection frequency interval.
This has the most significant impact on query usage for this extension.
-
Increase the discovery intervals for Sites discovery frequency, Devices discovery frequency, and Interfaces discovery frequency.
Discovery calls add to the overall query volume; increasing these intervals reduces the discovery query rate.
-
Disable feature sets you don't need.
This reduces the amount of data collected and lowers query volume and DPS usage.
Disabling feature sets results in missing data.
-
Reduce the number of reported entities.
DPS cost is proportional to the number of metric data points ingested. Use the reporting strategy configuration to scope collection to the device families and roles you need. Disabling the Interface feature set eliminates interface metrics, which contribute the largest share of DPS cost per device. For the exact DPS formula, see Licensing and cost.
After upgrading Cisco Catalyst to the next version, metrics data are no longer reported. In the Python 3 log file, I see the error: "error: BAPI not found with technicalName <url path> and restMethod GET".
This issue typically occurs because the Catalyst Center REST API bundle was not automatically upgraded, even though the platform itself was.
To resolve this issue, disable and then re-enable the Catalyst Center REST API bundle. This forces a refresh and restores access to the affected endpoints.
- Log in to your Cisco Catalyst (DNA) Center system menu, go to Platform > Manage (or the equivalent path for your version).
- In the Bundles tab, locate the Catalyst Center REST API bundle.
- Disable the bundle, wait a few seconds, and then re-enable it.
- Restart the extension. Disable and then re-enable its configuration.
To troubleshoot the Catalyst endpoint itself and validate the REST API bundle:
- In the Cisco Catalyst (DNA) Center system menu, go to Platform > Developer Toolkit.
- In the APIs tab, locate the
<url path>API endpoint in question by searching in the URL column. Ensure that GET is specified in the Method column. - Select Try at the end of the line in the Actions column.
- Execute the query. Typically, deselect all query parameters and select Run.
In the log I see Error: Callback Method=monitor took x seconds ... longer than the interval of 60.0s
By default, the extension collects Center and Site health metrics every 5 minutes, as configured in Polling > Center and Site Metrics Collection Frequency. Device and interface metrics are collected separately, each on its reporting group frequency, which by default is 5 minutes as well. Each collection runs as its own scheduled task. When a scheduled collection takes longer than its configured interval, the extension detects it and automatically skips the next scheduled run to prevent concurrent data collections.
To analyze this further, you can use the Cisco Catalyst Extension Self-Monitoring dashboard (provided that you've activated the self-monitoring feature set). This dashboard provides insights into data collection durations and even individual paged queries with the page offset as a dimension.
Recommended actions:
- Increase the relevant collection or reporting frequency (for example, from 5 to 10 minutes or more).
- Deactivate some feature sets if you require high data fidelity but can exclude specific metrics.
- Switch to the Simple reporting strategy if you're using Flexible Groups or Exclusive Groups; fewer total queries means shorter collection time.
After making the adjustment, recheck the data collection times to ensure the issue is resolved.
What is the expected performance impact of running API calls against the controller(s)? We are seeing some performance constraints in the Catalyst Center GUI.
The performance impact cannot be estimated with precision as it depends on how your Catalyst Center is configured. The rate limit default is 100 API calls per minute, however it can be adjusted for individual endpoints and the maximum amount varies by API type, ranging from 20 to 500. When a limit is reached, the system returns an HTTP 429 (Too Many Requests) response.
To keep its own impact within those limits, the extension uses pre-calculated API endpoints and paginated queries to reduce the total number of calls. It also has built-in rate limiting: by default, it sends at most 100 API calls per minute, matching the Catalyst Center default. When this limit is reached, the extension automatically waits before retrying.
One pattern that can still affect the Catalyst Center GUI is the extension peak load at the start of each collection cycle. When data collection runs (for example, every 5 minutes), the extension sends multiple paged queries as quickly as possible to capture data for that specific timestamp. Because queries are not spread evenly across the interval, the controller receives more requests at once at the start of each cycle. If this is the cause of the issues you observe, consider:
- Switching to the Simple strategy if you're using Flexible Groups or Exclusive Groups, to reduce the total query count.
- Limiting (reducing) the number of queries for specific APIs. You can review the actual API endpoints called by the extension at Catalyst Center > Platform > Runtime Dashboard.
- Reducing the
max_calls_per_minutesetting in Expert Capture configuration to spread requests out more evenly. The default is 100 per minute and lowering this value increases the time needed to complete a full data collection cycle. - Increasing the
client_timeout_secondssetting in the connection configuration if individual requests are timing out.
Is it recommended to add a catch-all group as the last entry when using the Flexible Groups strategy?
No, especially in larger environments.
A filter that is empty or broad enough to match all remaining devices causes a full-table scan. The Catalyst Center response returns all devices regardless of the filter position in the group, whether a device is already claimed by an earlier group, or whether you intend to report its metrics. After the response arrives, the extension ownership logic filters out already-claimed devices, however the full fetch and its load on your Catalyst Center are unavoidable. The performance impact grows linearly with the number of managed devices.
Instead of a catch-all group:
- To report only specific device groups and exclude everything else, claim only those devices. Devices that match no group are not reported.
- To enforce strict, non-overlapping groups where each device is fetched exactly once, use the Exclusive Groups strategy. It enforces mutual exclusivity at the query level, so no device is fetched more than once.