Cisco ACI/APIC extension
- Latest Dynatrace
- Extension
Monitor Cisco ACI fabric, tenants, EPGs, and contracts for health, performance, and faults via the APIC REST API with topology insights.
Get started
Overview
The Cisco ACI/APIC extension uses Cisco APIC REST API to collect information about the network fabric managed by Application Policy Infrastructure Controllers (APIC).
The extension provides detailed visibility into the ACI Fabric and Tenants.
The extension collects performance metrics, health scores, and faults from ACI Fabric components, including leaf and spine nodes, controller cluster elements, and Layer 1 physical and Management interfaces. It also gathers information about Tenants and their Application Profiles, Private Networks, Bridge Domains, Contracts, and Endpoint Groups (EPGs).
Use cases
- Detailed monitoring of ACI Fabric and Tenants health and performance
- Integration with broader infrastructure and application monitoring in Dynatrace
- Root cause analysis of network issues, in light of the entire application and infrastructure landscape observed by Dynatrace.
Requirements
- Connectivity is required between the ActiveGate, where the extension is deployed, and the Application Policy Infrastructure Controller.
Create a specific APIC user
For Dynatrace integration, we recommend creating a specific user with read-only privileges. You can define users locally on APIC or authenticate them remotely, based on APIC login policies.
This is an example of creating a locally authenticated user:
- Select Admin > AAA > Users (left panel) > Local (right area) > Action > Create Local User
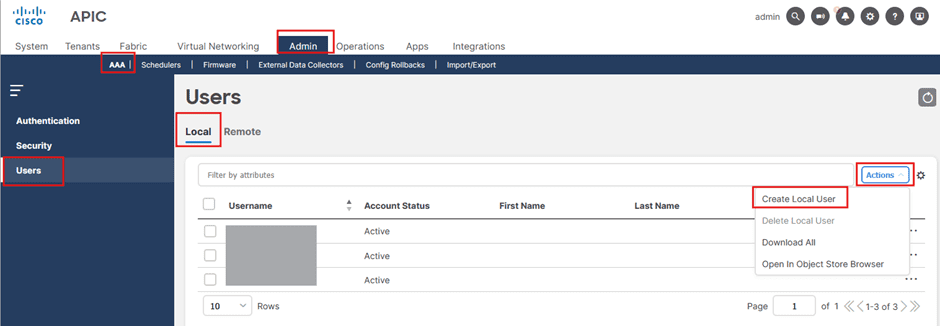
-
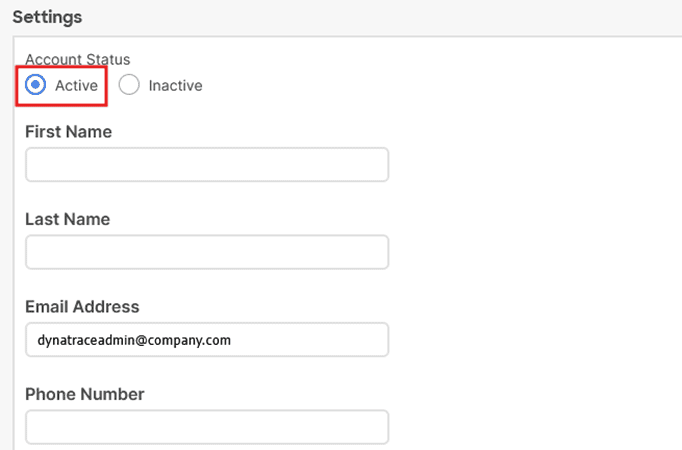
Provide required information:
- General
- Username
- Password
- Confirm password
- Setting
- Set account status as
Active - Contact information
- Set account status as
- General
-
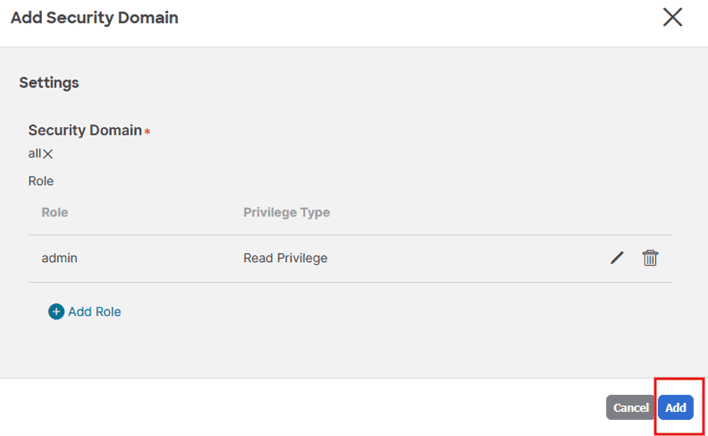
Add Security Domains
- Select Select Security Domain.
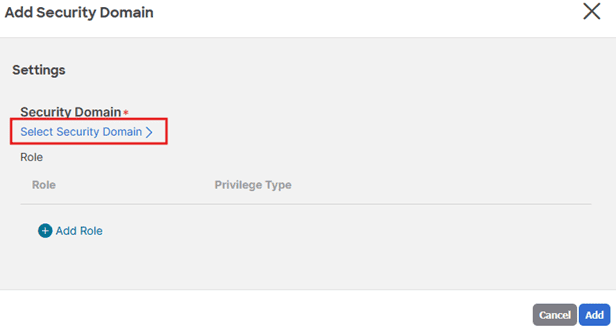 Select Security Domain
- Choose security domain:
all.
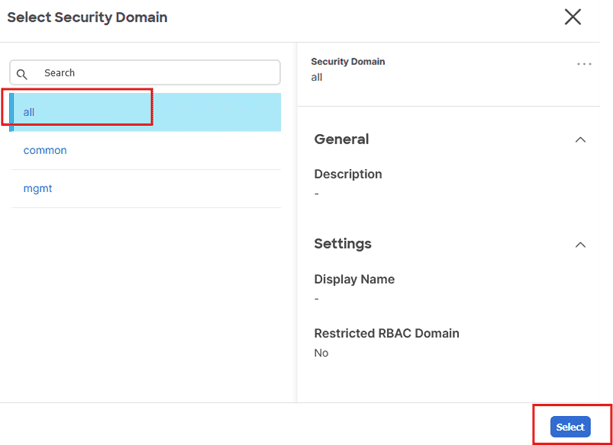
- Select Add Role.
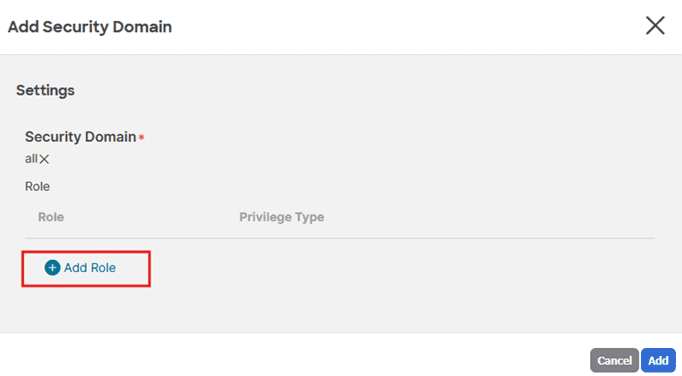
- Select Select Role.
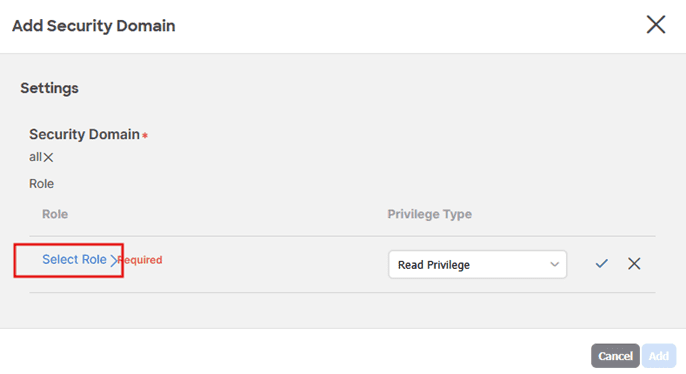
- Select the
adminrole and confirm.
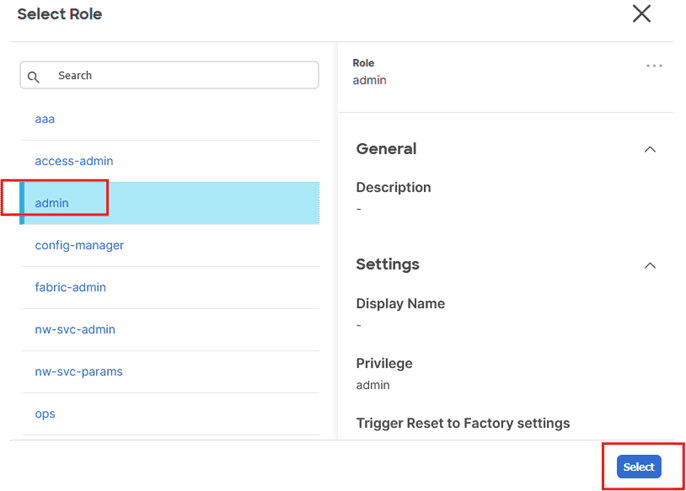
- Confirm the selected
Read Privilege.
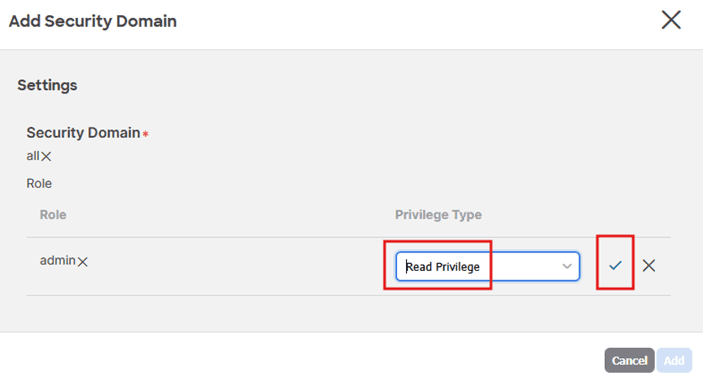
- Select Add.
-
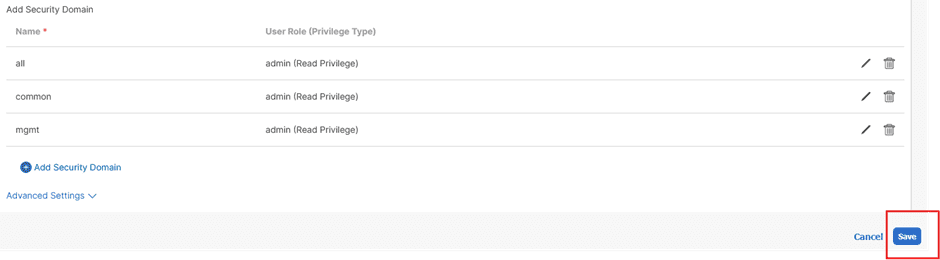
Repeat the previous steps for security domains
commonandmgmt -
Confirm Save to create a new user.
Compatibility information
- Cisco APIC version 6.0 and above
- API interface on Cisco ACI/APIC is available by design. Integration was implemented and tested on ACI/APIC version 6.0(7e).
Activation and setup
- Find the extension in Dynatrace Hub and add it to your environment.
- Create a new monitoring configuration.
Details
The extension package contains
- Extension code that integrates with APIC REST API endpoints to collect metrics
- Dashboards providing high-level overviews of the ACI Fabric and Tenants
- Unified Analysis pages for Fabric pods, nodes, node systems, controller nodes, and physical/management interfaces
- Unified Analysis pages for Tenants, Application Profiles, Private Networks, Bridge Domains, Contracts, EPGs, and EPG Contract Providers/Consumers
- Explorer screens in
 Infrastructure & Operations (latest Dynatrace) for fabrics, pods, fabric nodes, tenants, application profiles, endpoint groups, bridge domains, VRFs, and contracts, and ACI tabs on the network device and network interface screens
- Fault reporting available both as log records and as Davis events. The Davis events follow the ACI fault lifecycle (a problem opens when a fault is raised and closes when it's cleared, acknowledged, or deleted)
Summary of the monitored entities
- Fabric
- Fabric Pods
- Fabric Nodes
- Node Systems (spines and leaves), which are network devices in Infrastructure & Operations
- Controller Cluster Elements (network devices in Infrastructure & Operations)
- L1 Physical Interfaces (network interfaces in Infrastructure & Operations)
- Management Interfaces (network interfaces in Infrastructure & Operations)
- Controller Physical Interfaces (network interfaces in Infrastructure & Operations)
- Tenants
- Application Profiles
- Private Networks (VRFs)
- Bridge Domains
- Contracts
- Endpoint Groups (EPGs)
- Relationships
- The logical hierarchy of the fabric: Fabric > Pods > Fabric Nodes > Systems > Interfaces
- The logical hierarchy of the tenants: Fabric > Tenants > Application Profiles > EPGs, with Private Networks, Bridge Domains, and Contracts under their Tenant
- Between EPGs and the Contracts they provide or consume
- Between EPGs and their Bridge Domains
- Between Bridge Domains and their Private Networks (VRFs), in latest Dynatrace (Smartscape) only
The ACI extension metrics grouping (featureSets)
The following featureSets categorize various metrics collected by the Cisco ACI extension from the APIC controller:
default– Provides an overview of overall Cisco ACI health, including interface and device-specific metrics used in the Infrastructure & Operations application.fabric– Covers Fabric-related metrics.fabric_if_stats– Captures Fabric interface metrics with a 5-minute aggregation.tenants– Covers Tenant-related metrics.tenants_stats– Captures ingress and egress metrics for Tenant entities with a 15-minute aggregation.self-monitoring(optional) – Metrics for fine-tuning and diagnostics of the extension itself.
Fabric interface metrics are aggregated over 5-minute intervals and reported at least once every 5 minutes. Tenant entity ingress and egress metrics are aggregated over 15-minute intervals and reported at least once every 15 minutes.
Faults reporting and event integration
The APIC keeps a list of faults: problems it found in the fabric, for example, a port that is down. The extension reads this list and sends the faults to Dynatrace in two ways:
- As log records (Report Faults as Log Messages): one log record per fault. It's sent again only when the fault changes its lifecycle state, severity, cause, or acknowledgement.
- As Davis events (Report Faults as Davis Events): a Davis event opens a Davis problem. Only faults that the extension also reports as log records become Davis events.
From the APIC to Dynatrace, step by step:
- Reading: The extension reads the faults every Fault Collection Frequency. When it's empty, the extension uses the Metrics Collection Frequency. Each read goes back to the last read that worked, plus the Fault subsequent collection window (hours), so a failed read misses nothing.
- Filtering: The Faults Filter selects the fault severities to report. A fault passes when the filter includes its current, highest, or original severity. For example, a fault that was critical and is now minor still passes a filter for critical faults.
- The log record: Its log level comes from the fault severity: critical is
CRITICAL, major isERROR, minor and warning areWARN, info and cleared areINFO. The fault itself is in the propertiesfault_code,fault_severity,fault_lc(the lifecycle state),fault_type, andfault_cause. - The object: The extension links the log record and the Davis event to the object the fault is on, for example, an interface, a fabric node, a pod, a tenant, or an endpoint group. In latest Dynatrace, this is the Smartscape node of the object, and the objects above it, up to the fabric or the tenant, are its related entities. In Dynatrace Managed, it's the entity of the object. When your configuration doesn't report that object, the fault is linked to an object above it, at the latest to the fabric.
- The Davis event: The Default Davis Event Type for Faults and the List of conditions to override Default Davis Event Type set the event type of each fault, from its severity, type, and domain.
SUPPRESSsends no event. The Davis problem opens and closes with the APIC fault lifecycle. For details, see the FAQ entry How does a fault open and close a Davis problem?
After a start or a restart:
- Every restart is a start, for example, an extension upgrade or a configuration change. The extension keeps its fault state in memory only, so after a restart, the extension can send duplicate log records and Davis events for faults it had already reported.
- The extension reports faults that changed within Max age of faults on start (days) (1 day by default) again: each receives a second log record, and the extension sends its Davis event again. An open Davis problem isn't duplicated, because the event has the same title.
- The extension doesn't report active faults that last changed before the Max age of faults on start (days) window until they change again. It doesn't keep their Davis problems open, so the problems end after their timeout. To include these faults, raise Max age of faults on start (days), for example, to 30 for a month.
Fault records (optional): with Report Faults Records as Log Messages, the extension also sends fault records as log records. A fault record is one state change of a fault and can be useful for custom processing. After a start, the extension reads fault records from one fault collection interval back. Older fault records aren't reported.
Licensing and costs
There is no charge to use the extension. You are only charged for the data that the extension ingests.
The Cisco ACI/APIC extension ingests custom metrics, which consume Davis Data Units (DDUs) (Dynatrace classic license) or Metrics powered by Grail (DPS), according to your license model.
The extension ingests various metrics at 5-, 15-, and 60-minute intervals as described in the following code blocks. The calculations are approximate and assume that:
- All feature sets are enabled.
- A single log record is 5000 bytes.
- The number of faults and fault records depends on your environment.
Metrics calculations:
-
5-minute intervals
10 (featureSet: fabric)+ 8 * <Number of Fabric Pods> (featureSet: fabric)+ 2 * <Number of Fabric Nodes> (featureSet: fabric)+ (6 + 37) * <Number of leaf or spine Fabric Nodes> (featureSets: default and fabric)+ 3 * <Number of controller Fabric Nodes> (featureSet: fabric)+ (3 + 8) * <Number of Layer 1 Physical Interfaces with the traffic> (spines and leaves, featureSets: default and fabric-if-stats)+ (1 + 3) * <Number of Layer 1 Physical Interfaces without the traffic> (spines and leaves, featureSets: default and fabric-if-stats)+ (3 + 8) * <Number of Management Interfaces with the traffic> (spines and leaves, featureSets: default and fabric-if-stats)+ (1 + 3) * <Number of Management Interfaces without the traffic> (spines and leaves, featureSets: default and fabric-if-stats)+ (1 + 2) * <Number of Controller Physical Interfaces> (controllers, featureSet: fabric)+ <Number of faults grouped by type, domain, severity and delegated flag> (featureSet: fabric)+ 5 * <Number of Tenants> (featureSet: tenants)+ 1 * <Number of Application Profiles> (featureSet: tenants)+ 1 * <Number of Private Networks> (featureSet: tenants)+ 1 * <Number of Bridge Domains> (featureSet: tenants)+ 3 * <Number of EPGs> (featureSet: tenants)+ 8 // Optional - Self monitoring metrics (featureSet: self-monitoring) -
15-minute interval (tenants-stats featureSet)
12 * <Number of Tenants>+ 12 * <Number of Application Profiles>+ 12 * <Number of Private Networks>+ 12 * <Number of Bridge Domains>+ 12 * <Number of EPGs> -
60-minute intervals
<Number of Fabric Pods>+ <Number of Fabric Nodes>+ <Number of leaf or spine Fabric Nodes>+ <Number of controller Fabric Nodes>+ <Number of Layer 1 Physical Interfaces>+ <Number of Management Interfaces>+ <Number of Controller Physical Interfaces>+ <Number of Tenants>+ <Number of Application Profiles>+ <Number of Private Networks>+ <Number of Bridge Domains>+ <Number of EPGs>+ <Number of EPG Contract Providers>+ <Number of EPG Contract Consumers>+ <Number of relation between Bridge Domain and EPG>+ <Number of faults> (if configured to report faults as log records)+ <Number of fault records> (if configured to report fault records as log records)
To calculate your hourly consumption, sum all metrics ingested at the various intervals:
([5-minute metrics] * 12) + ([15-minute metrics] * 4) + (60-minute metrics) = Metric data points per 60 minutes
Dynatrace Platform Subscription
In the Dynatrace Platform Subscription, metric ingestion consumes Metrics powered by Grail according to the number of ingested metric data points.
To calculate the approximate yearly consumption, apply the following calculation: <metric data points per 60 minutes> * 24 hours * 365 days.
For logs, regular consumption applies. See Log Analytics.
Dynatrace classic license
In the classic licensing model, metric ingestion consumes Davis Data Units (DDUs) at the rate of .001 DDUs per metric data point. Multiply the preceding formula for annual data points by .001 to estimate annual DDU usage.
Logs ingestion consumes DDUs at the rate of .0005 DDU per log line. For logs, regular DDU consumption applies. See DDU consumption for Log Management and Analytics or DDUs for Log Monitoring Classic.
The preceding DDU cost doesn't include any possible log events or custom events that the extension triggers. For more information, see DDU events.
FAQ
Do I need to enable all feature sets?
No, not all feature sets are required.
self-monitoringis optional and is only needed for fine-tuning and diagnostics of the extension itself.- If you want the Explorer screens of the network devices and network interfaces in Infrastructure & Operations (latest Dynatrace), the
defaultfeature set is enough. - If you want all fabric screens with their metrics, the Unified Analysis pages (Dynatrace Managed), and the Explorer screens, enable the
fabricandfabric_if_statsfeature sets. - If you want the tenant screens, the Unified Analysis pages (Dynatrace Managed), and the Explorer screens, enable the
tenantsandtenants_statsfeature sets.
Why does the extension create fabric, pod, and fabric node Smartscape nodes when only the default feature set is on?
The default feature set reports network devices and network interfaces. Each device belongs to a fabric node, each fabric node to a pod, and each pod to the fabric. Without these three nodes, the devices would have no place in the topology. A fault that isn't on a device or an interface also needs one of these nodes to link to. So the extension creates the fabric, pod, and fabric node Smartscape nodes with every feature set.
The nodes come from metrics and from log records:
- The fabric: from the extension's status metric
cisco.aci.apic.status, in every collection. - Fabric nodes: from a metric, in every collection, and from a log record every Entity Attribute Reporting Frequency (60 minutes by default). The log record adds the details: host name, role, admin state, fabric state, address, model, serial number, and version.
- Pods: from a log record every Entity Attribute Reporting Frequency. With the
fabricfeature set, also from a metric, in every collection.
What this means:
- Pods without
fabric, and inactive fabric nodes: only their log record updates them. A view with a shorter timeframe than the Entity Attribute Reporting Frequency may not show them. - Where faults go: the extension links a fault to a node only when your configuration creates it. For example, with
tenantsandtenants_statsboth off, there are no tenant nodes, so the extension links a fault on a tenant object to the fabric.
Can I increase the monitoring interval to 15 minutes?
We recommend a 5-minute monitoring interval. In very large environments, increasing the monitoring interval may help with scalability. This always comes at the cost of data fidelity. We don't recommend going beyond 15 minutes.
If you need higher data fidelity for entity health metrics, you can reduce the monitoring interval to 1 minute. Note that if the number of samples within a 1-minute interval is zero, the health metric isn't reported. This can occur due to APIC sampling behavior and the timing of the extension's data collection.
How are health scores colored on the screens?
The screens color a health score by the default levels of the APIC. These are the colors the APIC GUI shows next to a health score, for example, on the Summary tab of a tenant.
| Level | Health score | Color |
|---|---|---|
Excellent | 91-100 | green |
Good | 76-90 | yellow |
Fair | 51-75 | orange |
Poor | 0-50 | red |
- The levels are the defaults of the APIC health level policy (
uni/fabric/hsPols/lvls). If your fabric uses other levels, the screens still use these defaults. - The health tiles, the health columns of the tables, and the color mark at the start of each row use the last reported health score.
How does a fault open and close a Davis problem?
The APIC moves every fault through a lifecycle. The Davis problem follows it.
| APIC fault state | Davis problem |
|---|---|
soaking, soaking-clearing | none |
raised | opens |
raised-clearing | stays open |
retaining | closes within about a minute |
deleted (an acknowledged fault that cleared, or a fault whose object was removed) | closes |
acknowledged while still active | an info event marks it, and the problem closes |
- The title:
[<fault code>] <cause> - <affected object>. It stays the same for the whole life of the fault. Severity, description, and state are event properties. - The event type: chosen per fault. The extension checks the List of conditions to override Default Davis Event Type from top to bottom against the severity, type, and domain of the fault. The first match sets the Davis event type. Without a match, the extension uses the Default Davis Event Type for Faults.
SUPPRESS, in a condition or as the default, sends no event for those faults. The extension matches on the highest severity the fault has had, and the event propertyfault_event_severityshows which severity that was. - Keeping the problem open: a Davis event ends by itself after a timeout, so the extension resends it for an open fault before that. With the default settings, the timeout is 60 minutes and the resend comes after about 45 minutes. One or two failed reads don't close the problem.
- The closing event: it carries the property
fault_close_reasonwith the valueapic_cleared,apic_gone, orapic_acknowledged.
Special cases:
- A short fault between two reads: the extension sees a fault raised and cleared between two reads only when it's already cleared. The extension then opens a problem that closes after one minute, so the fault shows in the problem history.
- A severity change to another event type: the problem continues under the new event type. The old event closes with
fault_close_reason=severity_changed.
Expert settings:
- Skip faults that cleared between two collections (default:
false) turns off the one-minute problem for short faults. - Keep the Davis problem open when a fault is acknowledged (default:
false) prevents the problem from closing when a fault is acknowledged.
Why does one fault create two Davis events?
A fault on a network device is reported twice, once for each of the device's two classic entities, so the fault shows wherever you look. Only one of the two events is linked to Smartscape. The property event_copy_target indicates which copy an event is.
| Event 1 | Event 2 | |
|---|---|---|
Target classic entity | The Node System ( | Its Network device ( |
Linked to Smartscape | No—the Node System has no Smartscape node | Yes—the interface or device of the fault, its fabric node, pod, and fabric |
|
|
|
-
Unified Analysis pages (Dynatrace Managed): the two events attach to two entities, the Node System and the Network device. Each entity page shows its own event. Nothing is counted twice and no filter is needed.
-
Latest Dynatrace (Explorer screens in
Infrastructure & Operations, Smartscape, dashboards, DQL): only the smartscapeevent is linked to Smartscape nodes, so a node view counts each fault once. A query over all Davis events returns both. To keep one event per fault:fetch dt.davis.events| filter cisco_aci_event_type == "cisco_aci_fault_info"| filterOut event_copy_target == "classic_only"
A fault on anything else, for example, on the fabric, a pod, or a tenant object, is reported once, with event_copy_target = smartscape. Events from versions that predate this property don't carry it.
Feature sets
When activating your extension using a monitoring configuration, you can limit monitoring to one of the feature sets. To work properly, the extension has to collect at least one metric after the activation.
In highly segmented networks, feature sets can reflect the segments of your environment. Then, when you create a monitoring configuration, you can select a feature set and a corresponding ActiveGate group that can connect to this particular segment.
All metrics that aren't categorized into any feature set are considered to be the default and are always reported.
A metric inherits the feature set of a subgroup, which in turn inherits the feature set of a group. Also, the feature set defined on the metric level overrides the feature set defined on the subgroup level, which in turn overrides the feature set defined on the group level.
default
| Metric name | Metric key | Description |
|---|---|---|
| — | com.dynatrace.extension.network_device.sysuptime | — |
| — | com.dynatrace.extension.network_device.memory_usage | — |
| — | com.dynatrace.extension.network_device.memory_free | — |
| — | com.dynatrace.extension.network_device.memory_total | — |
| — | com.dynatrace.extension.network_device.memory_used | — |
| — | com.dynatrace.extension.network_device.cpu_usage | — |
| — | com.dynatrace.extension.network_device.if.status | — |
| — | com.dynatrace.extension.network_device.if.bytes_in.count | — |
| — | com.dynatrace.extension.network_device.if.bytes_out.count | — |
| Fabric Monitoring Endpoint Status | cisco.aci.apic.status | Fabric - Extension Monitoring Endpoint Status. A state metric representing a monitored Fabric endpoint, whose value is always 1 and its dimensions indicate its endpoint configuration details, including how faults are reported (as log records or as Davis events) and the enabled feature sets. |
self-monitoring
| Metric name | Metric key | Description |
|---|---|---|
| Overall Metrics Data Collection Time | sfm.cisco.aci.monitor.run.duration | Total duration of all queries to collect data reported as metrics and log records |
| Metrics Data Collection Error | sfm.cisco.aci.monitor.run.error | Indicates whether an error occurred during the most recent data collection. |
| Paged Data Query Duration | sfm.cisco.aci.fetch_class_page.duration | Duration of paged queries to collect data reported as metrics and log records |
| Paged Data Query Errors | sfm.cisco.aci.fetch_class_page.error | Number of errors that occurred during the most recent paged queries to collect data reported as metrics and log records |
| Paged Data Count Query Duration | sfm.cisco.aci.fetch_class_count.duration | Duration of queries to get object counts for paged queries |
| Paged Data Count Query Errors | sfm.cisco.aci.fetch_class_count.error | Number of errors that occurred during the most recent queries to get object counts for paged queries |
| Object Count Query Duration | sfm.cisco.aci.fetch_count_query.duration | Duration of queries to get object counts reported as metrics |
| Object Count Query Errors | sfm.cisco.aci.fetch_count_query.error | Number of errors that occurred during the most recent queries to get object counts reported as metrics |
fabric-if-stats
| Metric name | Metric key | Description |
|---|---|---|
| Egress Bytes Cumulative | cisco.aci.l1_phys_if.eqpt_egr_total_hist_5min.bytes_cum.count | Physical Interface - Egress Bytes Cumulative |
| Egress Bytes Rate | cisco.aci.l1_phys_if.eqpt_egr_total_hist_5min.bytes_rate | Physical Interface - Egress Bytes Rate |
| Egress Packets rate | cisco.aci.l1_phys_if.eqpt_egr_total_hist_5min.pkts_rate | Physical Interface - Egress Packets rate |
| Egress Link Utilization | cisco.aci.l1_phys_if.eqpt_egr_total_hist_5min.util_avg | Physical Interface - Egress Link Utilization |
| Ingress Bytes Cumulative | cisco.aci.l1_phys_if.eqpt_ingr_total_hist_5min.bytes_cum.count | Physical Interface - Ingress Bytes Cumulative |
| Ingress Bytes rate | cisco.aci.l1_phys_if.eqpt_ingr_total_hist_5min.bytes_rate | Physical Interface - Ingress Bytes Rate |
| Ingress Packets rate | cisco.aci.l1_phys_if.eqpt_ingr_total_hist_5min.pkts_rate | Physical Interface - Ingress Packets rate |
| Ingress Link Utilization | cisco.aci.l1_phys_if.eqpt_ingr_total_hist_5min.util_avg | Physical Interface - Ingress Link Utilization |
| Egress Bytes Cumulative | cisco.aci.mgmt_if.eqpt_egr_total_hist_5min.bytes_cum.count | Management Interface - Egress Bytes Cumulative |
| Egress Bytes Rate | cisco.aci.mgmt_if.eqpt_egr_total_hist_5min.bytes_rate | Management Interface - Egress Bytes Rate |
| Egress Packets rate | cisco.aci.mgmt_if.eqpt_egr_total_hist_5min.pkts_rate | Management Interface - Egress Packets rate |
| Egress Link Utilization | cisco.aci.mgmt_if.eqpt_egr_total_hist_5min.util_avg | Management Interface - Egress Link Utilization |
| Ingress Bytes Cumulative | cisco.aci.mgmt_if.eqpt_ingr_total_hist_5min.bytes_cum.count | Management Interface - Ingress Bytes Cumulative |
| Ingress Bytes Rate | cisco.aci.mgmt_if.eqpt_ingr_total_hist_5min.bytes_rate | Management Interface - Ingress Bytes Rate |
| Ingress Packets rate | cisco.aci.mgmt_if.eqpt_ingr_total_hist_5min.pkts_rate | Management Interface - Ingress Packets rate |
| Ingress Link Utilization | cisco.aci.mgmt_if.eqpt_ingr_total_hist_5min.util_avg | Management Interface - Ingress Link Utilization |
fabric
| Metric name | Metric key | Description |
|---|---|---|
| Global pcTag | cisco.aci.apic.global_pc_tags | Fabric Capacity - Global pcTag |
| MAC Endpoints | cisco.aci.apic.global_mac_endpoints | Fabric Capacity - MAC Endpoints |
| IPv6 Endpoints | cisco.aci.apic.global_ipv6_endpoints | Fabric Capacity - IPv6 Endpoints |
| IPv4 Endpoints | cisco.aci.apic.global_ipv4_endpoints | Fabric Capacity - IPv4 Endpoints |
| Proxy Database Entries | cisco.aci.apic.global_proxy_db_entries | Fabric Capacity - MAC + IP Endpoints |
| Fabric Health AVG | cisco.aci.apic.health_avg | Fabric Health AVG in a 5 minute sampling interval |
| Fabric Health MAX | cisco.aci.apic.health_max | Fabric Health MAX in a 5 minute sampling interval |
| Fabric Health MIN | cisco.aci.apic.health_min | Fabric Health MIN in a 5 minute sampling interval |
| Fabric Total Health Score | cisco.aci.apic.health_total | Fabric Total Health Score |
| Admin State (in-service) | cisco.aci.cluster_element.admin_state_in_service | Cluster Element - Admin State of the cluster is: in-service |
| Health State (fully-fit) | cisco.aci.cluster_element.health_fully_fit | Controller - Health State is: fully-fit |
| Operational State (available) | cisco.aci.cluster_element.oper_state_available | Controller - Operational State is: available |
| Administrative State | cisco.aci.cnw_phys_if.admin_status | Controller Physical Interface - Administrative State |
| Operational Status | cisco.aci.cnw_phys_if.oper_status | Controller Physical Interface - Operational Status |
| Admin State (on) | cisco.aci.fabric_node.admin_state_on | Fabric Node - Admin State is: on |
| Fabric State (active) | cisco.aci.fabric_node.fabric_state_active | Fabric Node - Fabric State is: active |
| Fabric Pod Controllers | cisco.aci.fabric_pod.controllers | Fabric Pod - Controllers |
| Fabric Pod Nodes | cisco.aci.fabric_pod.fabric_nodes | Fabric Pod - Nodes |
| Fabric Health AVG | cisco.aci.fabric_pod.health_avg | Fabric Pod - Fabric Health AVG in a 5 minute sampling interval |
| Fabric Health MAX | cisco.aci.fabric_pod.health_max | Fabric Pod - Fabric Health MAX in a 5 minute sampling interval |
| Fabric Health MIN | cisco.aci.fabric_pod.health_min | Fabric Pod - Fabric Health MIN in a 5 minute sampling interval |
| Fabric Total Health Score | cisco.aci.fabric_pod.health_total | Fabric Pod - Fabric Total Health Score |
| Fabric Pod Leaves | cisco.aci.fabric_pod.leaves | Fabric Pod - Leaves |
| Fabric Pod Spines | cisco.aci.fabric_pod.spines | Fabric Pod - Spines |
| Faults by Domain | cisco.aci.fault_count.domain | Faults by Domain |
| Faults by Type | cisco.aci.fault_count.type | Faults by Type |
| Administrative State | cisco.aci.l1_phys_if.admin_status | Physical Interface - Administrative State |
| Interface Health | cisco.aci.l1_phys_if.health | Physical Interface - Health |
| Operational State | cisco.aci.l1_phys_if.oper_status | Physical Interface - Operational State |
| Administrative State | cisco.aci.mgmt_if.admin_status | Management Interface - Administrative State |
| Interface Health | cisco.aci.mgmt_if.health | Management Interface - Health |
| Operational Port State | cisco.aci.mgmt_if.oper_status | Management Interface - Operational Port State |
| System Health Score | cisco.aci.system.health | System - Health Score |
| System Health AVG | cisco.aci.system.health_avg | System - System Node Health AVG in a 5 minute sampling interval |
| System Health MAX | cisco.aci.system.health_max | System - System Node Health MAX in a 5 minute sampling interval |
| System Health MIN | cisco.aci.system.health_min | System - System Node Health MIN in a 5 minute sampling interval |
| Total L2 Endpoints | cisco.aci.system.l2_total_ep_last | Leaf Layer2 usage statistics - Total L2 Endpoints in a 5 minute sampling interval |
| L2 Endpoints Capacity | cisco.aci.system.l2_total_ep_max | Leaf Layer2 usage statistics - L2 Endpoints capacity in a 5 minute sampling interval |
| L2 Endpoints Usage | cisco.aci.system.l2_total_ep_perc | Leaf Layer2 usage statistics - Total L2 Endpoints divided by L2 Endpoints capacity |
| TCAMs | cisco.aci.system.pol_tcams | Leaf Policy entries usage statistics - TCAMs = (Cumulative - Baseline) |
| Policy Usage Capacity | cisco.aci.system.pol_tcams_max | Leaf Policy entries usage statistics - Policy Usage Capacity |
| TCAMs Usage | cisco.aci.system.pol_tcams_perc | Leaf Policy entries usage statistics - TCAMs Usage = (Cumulative - Baseline) / Capacity |
| Policy Usage Baseline | cisco.aci.system.pol_usage_base | Leaf Policy entries usage statistics - Policy Usage Baseline |
| Policy Usage Cumulative | cisco.aci.system.pol_usage_cum | Leaf Policy entries usage statistics - Policy Usage Cumulative |
| System Kernel CPU Utilization AVG | cisco.aci.system.proc_sys_cpu_kernel_avg | System - Kernel CPU Utilization AVG |
| System Kernel CPU Utilization AVG Last | cisco.aci.system.proc_sys_cpu_kernel_avg_last | System - Kernel CPU Utilization AVG Last |
| System User CPU Utilization AVG | cisco.aci.system.proc_sys_cpu_user_avg | System - User CPU Utilization AVG |
| System User CPU Utilization AVG Last | cisco.aci.system.proc_sys_cpu_user_avg_last | System - User CPU Utilization AVG Last |
| System Load Average (1 min) | cisco.aci.system.proc_sys_load_avg | System - one-minute load average of the switch operating system |
| System Load Average (1 min) Last | cisco.aci.system.proc_sys_load_avg_last | System - one-minute load average of the switch operating system (last value) |
| System Memory Free Last | cisco.aci.system.proc_sys_mem_free_last | System - Memory Free Last |
| System Memory Total Last | cisco.aci.system.proc_sys_mem_total_last | System - Memory Total Last |
| System Memory Used Last | cisco.aci.system.proc_sys_mem_used_last | System - Memory Used Last |
| System Memory Used % Last | cisco.aci.system.proc_sys_mem_used_perc_last | System - Memory Used % Last |
| System Uptime | cisco.aci.system.system_uptime | System - Uptime |
| IPv4 Addresses | cisco.aci.system.v4_addresses | Leaf Layer3 v4/32 total entries usage statistics - IPv4 Addresses = (Cumulative - Baseline) |
| Total v4 Endpoints Capacity | cisco.aci.system.v4_addresses_max | Leaf Layer3 total entries usage capacity - Total v4 Endpoints capacity current value |
| IPv4 Addresses Usage | cisco.aci.system.v4_addresses_perc | Leaf Layer3 v4/32 total entries usage statistics, Leaf Layer3 total entries usage capacity - IPv4 Addresses Usage = (Cumulative - Baseline) / Capacity |
| Total v4 32 Endpoints Baseline | cisco.aci.system.v4_ep_base | Leaf Layer3 v4/32 total entries usage statistics - Total v4 32 Endpoints Baseline |
| Total v4 32 Endpoints Cumulative | cisco.aci.system.v4_ep_cum | Leaf Layer3 v4/32 total entries usage statistics - Total v4 32 Endpoints Cumulative |
| Total Vlan Entries Baseline | cisco.aci.system.vlan_usage_total_base | Leaf Vlan entries usage statistics - Total vlan entries Baseline |
| Total Vlan Entries Cumulative | cisco.aci.system.vlan_usage_total_cum | Leaf Vlan entries usage statistics - Total Vlan Entries Cumulative |
| Vlans | cisco.aci.system.vlan_vlans | Leaf Vlan entries usage statistics - Vlans = (Cumulative - Baseline) |
| Vlan Entries Capacity | cisco.aci.system.vlan_vlans_max | Leaf Vlan entries usage statistics - Vlan Entries Capacity |
| Vlans Usage | cisco.aci.system.vlan_vlans_perc | Leaf Vlan entries usage statistics - Vlans Usage = (Cumulative - Baseline) / Capacity |
tenants
| Metric name | Metric key | Description |
|---|---|---|
| Application Profile Health | cisco.aci.app_profile.health | Application Profile - Health |
| Bridge Domain Health | cisco.aci.bridge_domain.health | Bridge Domain - Health |
| Endpoint Group Contract Consumers | cisco.aci.endpoint_group.contract_consumers | Endpoint Group - Contract Consumers |
| Endpoint Group Contract Providers | cisco.aci.endpoint_group.contract_providers | Endpoint Group - Contract Providers |
| Endpoint Group Health | cisco.aci.endpoint_group.health | Endpoint Group - Health |
| Private Network Health | cisco.aci.private_network.health | Private Network - Health |
| Application Profiles | cisco.aci.tenant.app_profiles | Application Profiles |
| Bridge Domains | cisco.aci.tenant.bridge_domains | Bridge Domains |
| Contracts | cisco.aci.tenant.contracts | Contracts |
| Tenant health | cisco.aci.tenant.health | Tenant - Health |
| Private Networks | cisco.aci.tenant.private_networks | Private Networks |
tenants-stats
| Metric name | Metric key | Description |
|---|---|---|
| — | cisco.aci.app_profile.l2_egr_bytes_ag_hist.multicast_cum | — |
| Application Profile Multicast Egress Bytes Rate | cisco.aci.app_profile.l2_egr_bytes_ag_hist.multicast_rate | Application Profile - Multicast Egress Bytes Rate in a 15 minute sampling interval |
| — | cisco.aci.app_profile.l2_egr_bytes_ag_hist.unicast_cum | — |
| Application Profile Unicast Egress Bytes Rate | cisco.aci.app_profile.l2_egr_bytes_ag_hist.unicast_rate | Application Profile - Unicast Egress Bytes Rate in a 15 minute sampling interval |
| — | cisco.aci.app_profile.l2_ingr_bytes_ag_hist.drop_cum | — |
| Application Profile Ingress Drop Rate | cisco.aci.app_profile.l2_ingr_bytes_ag_hist.drop_rate | Application Profile - Ingress Drop Rate in a 15 minute sampling interval |
| — | cisco.aci.app_profile.l2_ingr_bytes_ag_hist.flood_cum | — |
| Application Profile Ingress Flood Rate | cisco.aci.app_profile.l2_ingr_bytes_ag_hist.flood_rate | Application Profile - Ingress Flood Rate in a 15 minute sampling interval |
| — | cisco.aci.app_profile.l2_ingr_bytes_ag_hist.multicast_cum | — |
| Application Profile Multicast Ingress Bytes Rate | cisco.aci.app_profile.l2_ingr_bytes_ag_hist.multicast_rate | Application Profile - Multicast Ingress Bytes Rate in a 15 minute sampling interval |
| — | cisco.aci.app_profile.l2_ingr_bytes_ag_hist.unicast_cum | — |
| Application Profile Unicast Ingress Bytes Rate | cisco.aci.app_profile.l2_ingr_bytes_ag_hist.unicast_rate | Application Profile - Unicast Ingress Bytes Rate in a 15 minute sampling interval |
| — | cisco.aci.bridge_domain.l2_egr_bytes_ag_hist.multicast_cum | — |
| Bridge Domain Multicast Egress Bytes Rate | cisco.aci.bridge_domain.l2_egr_bytes_ag_hist.multicast_rate | Bridge Domain - Multicast Egress Bytes Rate in a 15 minute sampling interval |
| — | cisco.aci.bridge_domain.l2_egr_bytes_ag_hist.unicast_cum | — |
| Bridge Domain Unicast Egress Bytes Rate | cisco.aci.bridge_domain.l2_egr_bytes_ag_hist.unicast_rate | Bridge Domain - Unicast Egress Bytes Rate in a 15 minute sampling interval |
| — | cisco.aci.bridge_domain.l2_ingr_bytes_ag_hist.drop_cum | — |
| Bridge Domain Ingress Drop Rate | cisco.aci.bridge_domain.l2_ingr_bytes_ag_hist.drop_rate | Bridge Domain - Ingress Drop Rate in a 15 minute sampling interval |
| — | cisco.aci.bridge_domain.l2_ingr_bytes_ag_hist.flood_cum | — |
| Bridge Domain Ingress Flood Rate | cisco.aci.bridge_domain.l2_ingr_bytes_ag_hist.flood_rate | Bridge Domain - Ingress Flood Rate in a 15 minute sampling interval |
| — | cisco.aci.bridge_domain.l2_ingr_bytes_ag_hist.multicast_cum | — |
| Bridge Domain Multicast Ingress Bytes Rate | cisco.aci.bridge_domain.l2_ingr_bytes_ag_hist.multicast_rate | Bridge Domain - Multicast Ingress Bytes Rate in a 15 minute sampling interval |
| — | cisco.aci.bridge_domain.l2_ingr_bytes_ag_hist.unicast_cum | — |
| Bridge Domain Unicast Ingress Bytes Rate | cisco.aci.bridge_domain.l2_ingr_bytes_ag_hist.unicast_rate | Bridge Domain - Unicast Ingress Bytes Rate in a 15 minute sampling interval |
| — | cisco.aci.endpoint_group.l2_egr_bytes_ag_hist.multicast_cum | — |
| Endpoint Group Multicast Egress Bytes Rate | cisco.aci.endpoint_group.l2_egr_bytes_ag_hist.multicast_rate | Endpoint Group - Multicast Egress Bytes Rate in a 15 minute sampling interval |
| — | cisco.aci.endpoint_group.l2_egr_bytes_ag_hist.unicast_cum | — |
| Endpoint Group Unicast Egress Bytes Rate | cisco.aci.endpoint_group.l2_egr_bytes_ag_hist.unicast_rate | Endpoint Group - Unicast Egress Bytes Rate in a 15 minute sampling interval |
| — | cisco.aci.endpoint_group.l2_ingr_bytes_ag_hist.drop_cum | — |
| Endpoint Group Ingress Drop Rate | cisco.aci.endpoint_group.l2_ingr_bytes_ag_hist.drop_rate | Endpoint Group - Ingress Drop Rate in a 15 minute sampling interval |
| — | cisco.aci.endpoint_group.l2_ingr_bytes_ag_hist.flood_cum | — |
| Endpoint Group Ingress Flood Rate | cisco.aci.endpoint_group.l2_ingr_bytes_ag_hist.flood_rate | Endpoint Group - Ingress Flood Rate in a 15 minute sampling interval |
| — | cisco.aci.endpoint_group.l2_ingr_bytes_ag_hist.multicast_cum | — |
| Endpoint Group Multicast Ingress Bytes Rate | cisco.aci.endpoint_group.l2_ingr_bytes_ag_hist.multicast_rate | Endpoint Group - Multicast Ingress Bytes Rate in a 15 minute sampling interval |
| — | cisco.aci.endpoint_group.l2_ingr_bytes_ag_hist.unicast_cum | — |
| Endpoint Group Unicast Ingress Bytes Rate | cisco.aci.endpoint_group.l2_ingr_bytes_ag_hist.unicast_rate | Endpoint Group - Unicast Ingress Bytes Rate in a 15 minute sampling interval |
| — | cisco.aci.private_network.l2_egr_bytes_ag_hist.multicast_cum | — |
| Private Network Multicast Egress Bytes Rate | cisco.aci.private_network.l2_egr_bytes_ag_hist.multicast_rate | Private Network - Multicast Egress Bytes Rate in a 15 minute sampling interval |
| — | cisco.aci.private_network.l2_egr_bytes_ag_hist.unicast_cum | — |
| Private Network Unicast Egress Bytes Rate | cisco.aci.private_network.l2_egr_bytes_ag_hist.unicast_rate | Private Network - Unicast Egress Bytes Rate in a 15 minute sampling interval |
| — | cisco.aci.private_network.l2_ingr_bytes_ag_hist.drop_cum | — |
| Private Network Ingress Drop Rate | cisco.aci.private_network.l2_ingr_bytes_ag_hist.drop_rate | Private Network - Ingress Drop Rate in a 15 minute sampling interval |
| — | cisco.aci.private_network.l2_ingr_bytes_ag_hist.flood_cum | — |
| Private Network Ingress Flood Rate | cisco.aci.private_network.l2_ingr_bytes_ag_hist.flood_rate | Private Network - Ingress Flood Rate in a 15 minute sampling interval |
| — | cisco.aci.private_network.l2_ingr_bytes_ag_hist.multicast_cum | — |
| Private Network Multicast Ingress Bytes Rate | cisco.aci.private_network.l2_ingr_bytes_ag_hist.multicast_rate | Private Network - Multicast Ingress Bytes Rate in a 15 minute sampling interval |
| — | cisco.aci.private_network.l2_ingr_bytes_ag_hist.unicast_cum | — |
| Private Network Unicast Ingress Bytes Rate | cisco.aci.private_network.l2_ingr_bytes_ag_hist.unicast_rate | Private Network - Unicast Ingress Bytes Rate in a 15 minute sampling interval |
| — | cisco.aci.tenant.l2_egr_bytes_ag_hist.multicast_cum | — |
| Tenant Multicast Egress Bytes Rate | cisco.aci.tenant.l2_egr_bytes_ag_hist.multicast_rate | Tenant - Multicast Egress Bytes Rate in a 15 minute sampling interval |
| — | cisco.aci.tenant.l2_egr_bytes_ag_hist.unicast_cum | — |
| Tenant Unicast Egress Bytes Rate | cisco.aci.tenant.l2_egr_bytes_ag_hist.unicast_rate | Tenant - Unicast Egress Bytes Rate in a 15 minute sampling interval |
| — | cisco.aci.tenant.l2_ingr_bytes_ag_hist.drop_cum | — |
| Tenant Ingress Drop Rate | cisco.aci.tenant.l2_ingr_bytes_ag_hist.drop_rate | Tenant - Ingress Drop Rate in a 15 minute sampling interval |
| — | cisco.aci.tenant.l2_ingr_bytes_ag_hist.flood_cum | — |
| Tenant Ingress Flood Rate | cisco.aci.tenant.l2_ingr_bytes_ag_hist.flood_rate | Tenant - Ingress Flood Rate in a 15 minute sampling interval |
| — | cisco.aci.tenant.l2_ingr_bytes_ag_hist.multicast_cum | — |
| Tenant Multicast Ingress Bytes Rate | cisco.aci.tenant.l2_ingr_bytes_ag_hist.multicast_rate | Tenant - Multicast Ingress Bytes Rate in a 15 minute sampling interval |
| — | cisco.aci.tenant.l2_ingr_bytes_ag_hist.unicast_cum | — |
| Tenant Unicast Ingress Bytes Rate | cisco.aci.tenant.l2_ingr_bytes_ag_hist.unicast_rate | Tenant - Unicast Ingress Bytes Rate in a 15 minute sampling interval |