Upgrade to New Database Monitoring
- Latest Dynatrace
- Upgrade guide
- 6-min read
- Published Jul 26, 2026
New Database Monitoring is a significantly improved  Databases experience for PostgreSQL and MySQL that delivers deeper insights and faster troubleshooting powered by Smartscape.
Until you activate, new capabilities such as Tables, Indexes, and Database schema appear with an Activate New Database Monitoring to get this feature prompt.
Why upgrade?
New Database Monitoring delivers a significantly improved experience for both PostgreSQL and MySQL users.
- Database auto-discovery for PostgreSQL: A single endpoint configuration can now monitor all databases within a PostgreSQL instance. Previously, you had to add a separate endpoint configuration for each database. Leave the list of databases to monitor empty to include all databases, or provide a list to limit the scope.
- Tables and indexes observability: Monitor table and index size, growth, and usage to spot bloat, unused indexes, and other optimization opportunities.
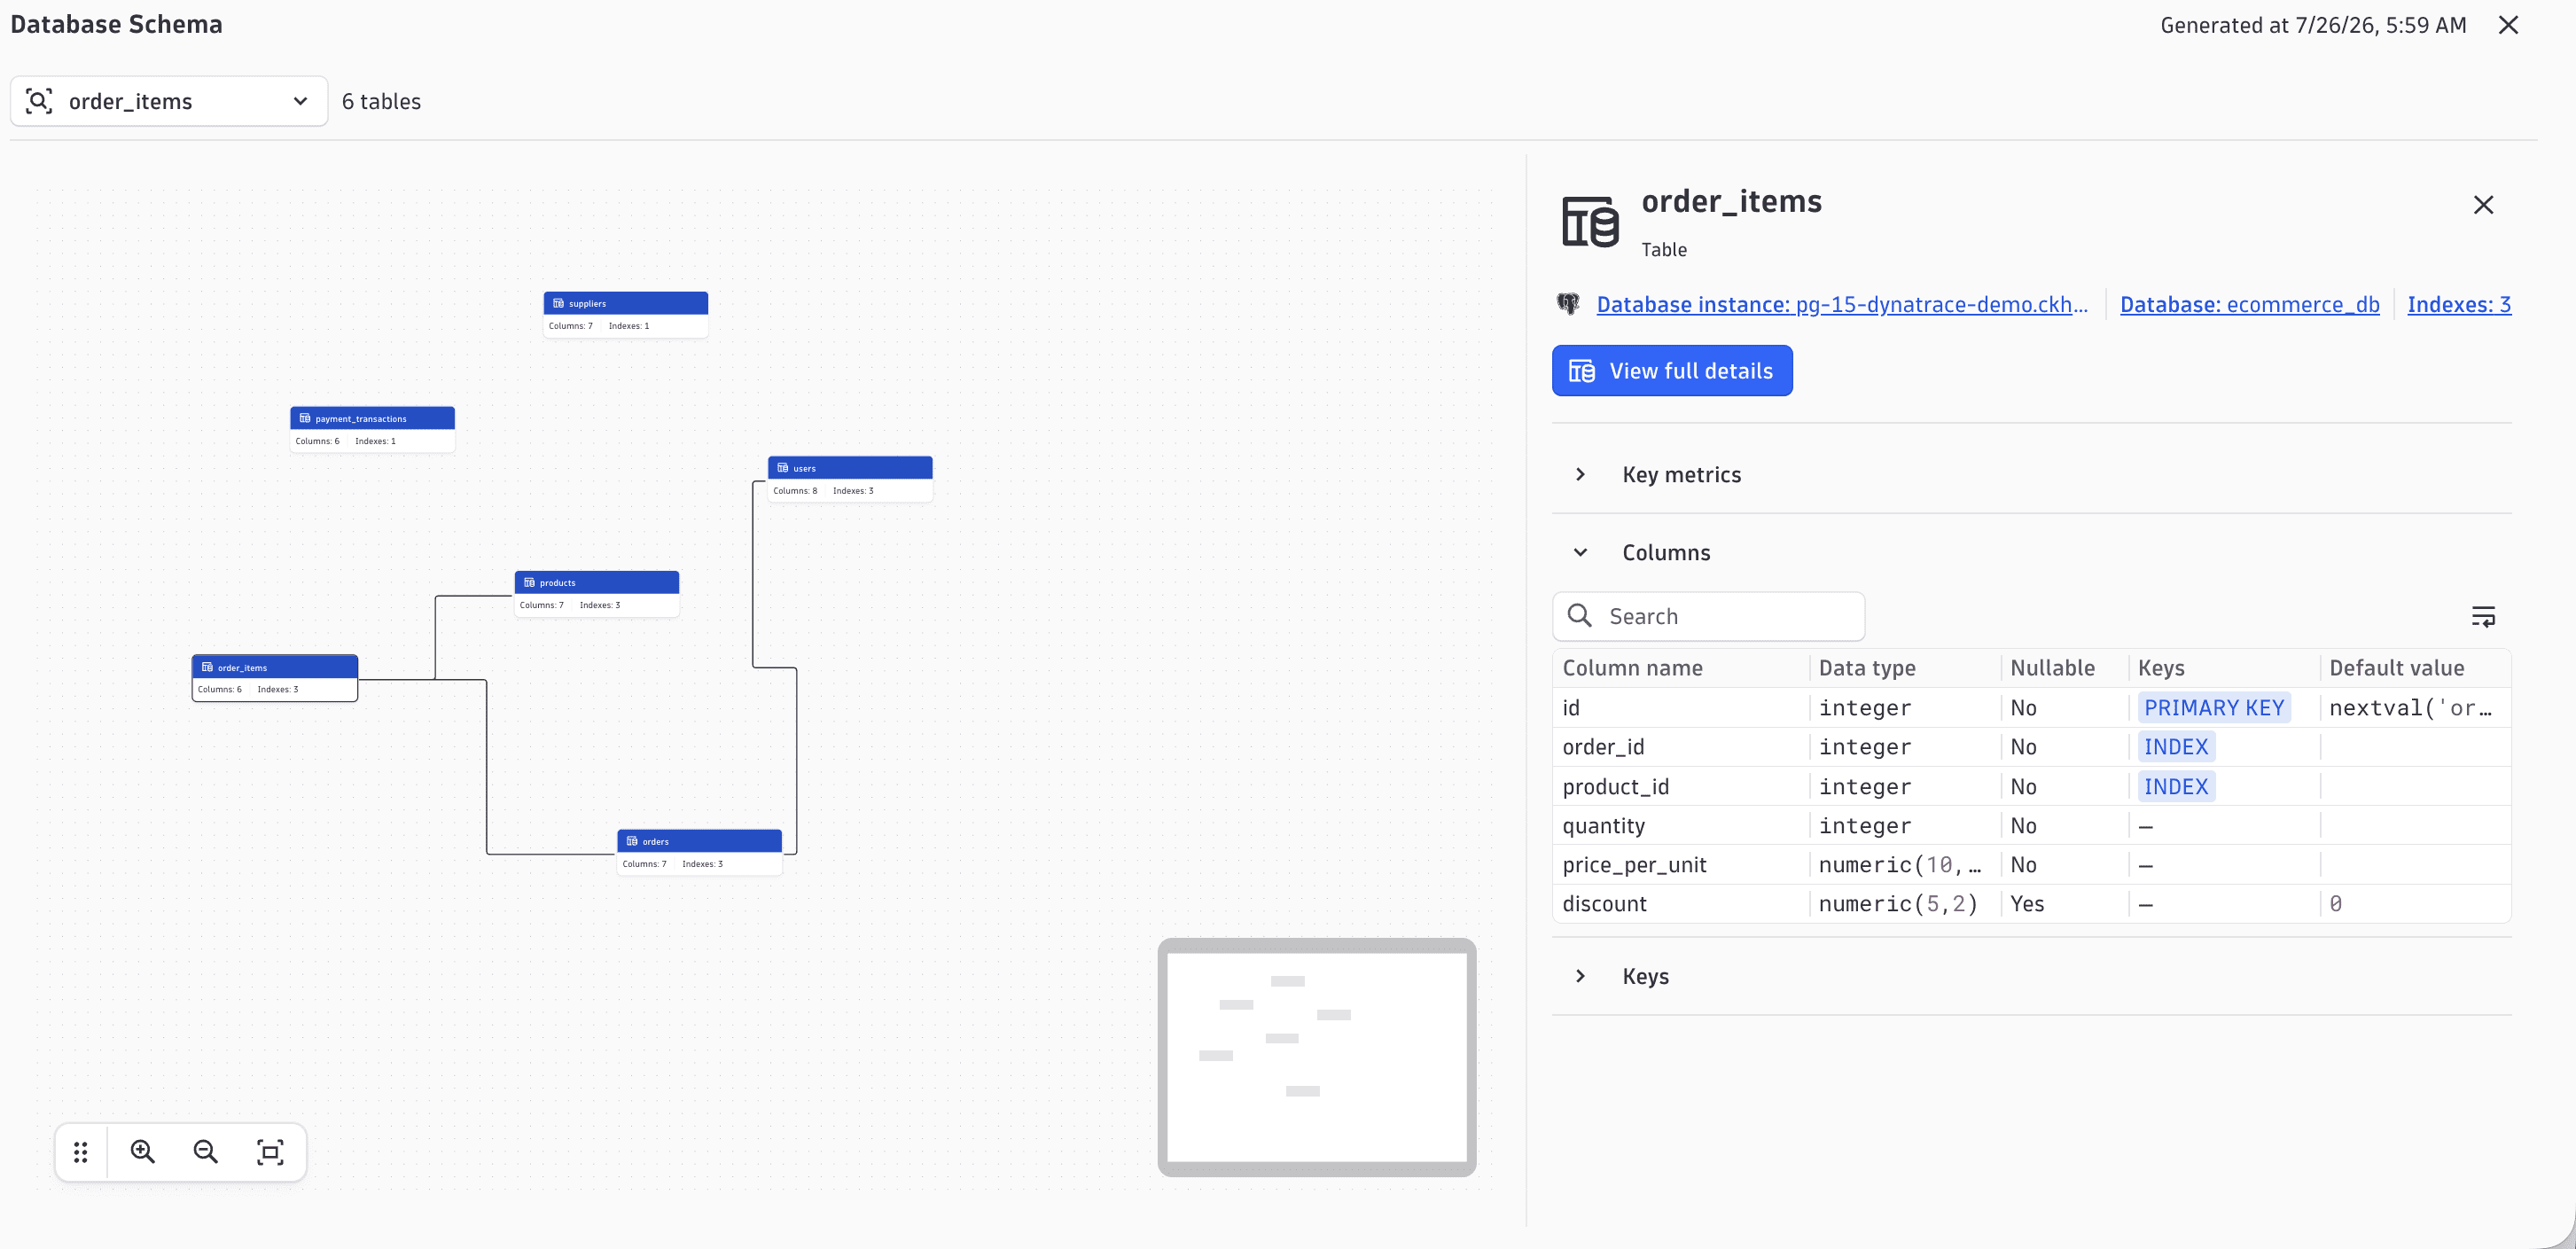
- Database schema visualization: Explore your database schema visually to understand the structure and relationships of your databases at a glance.
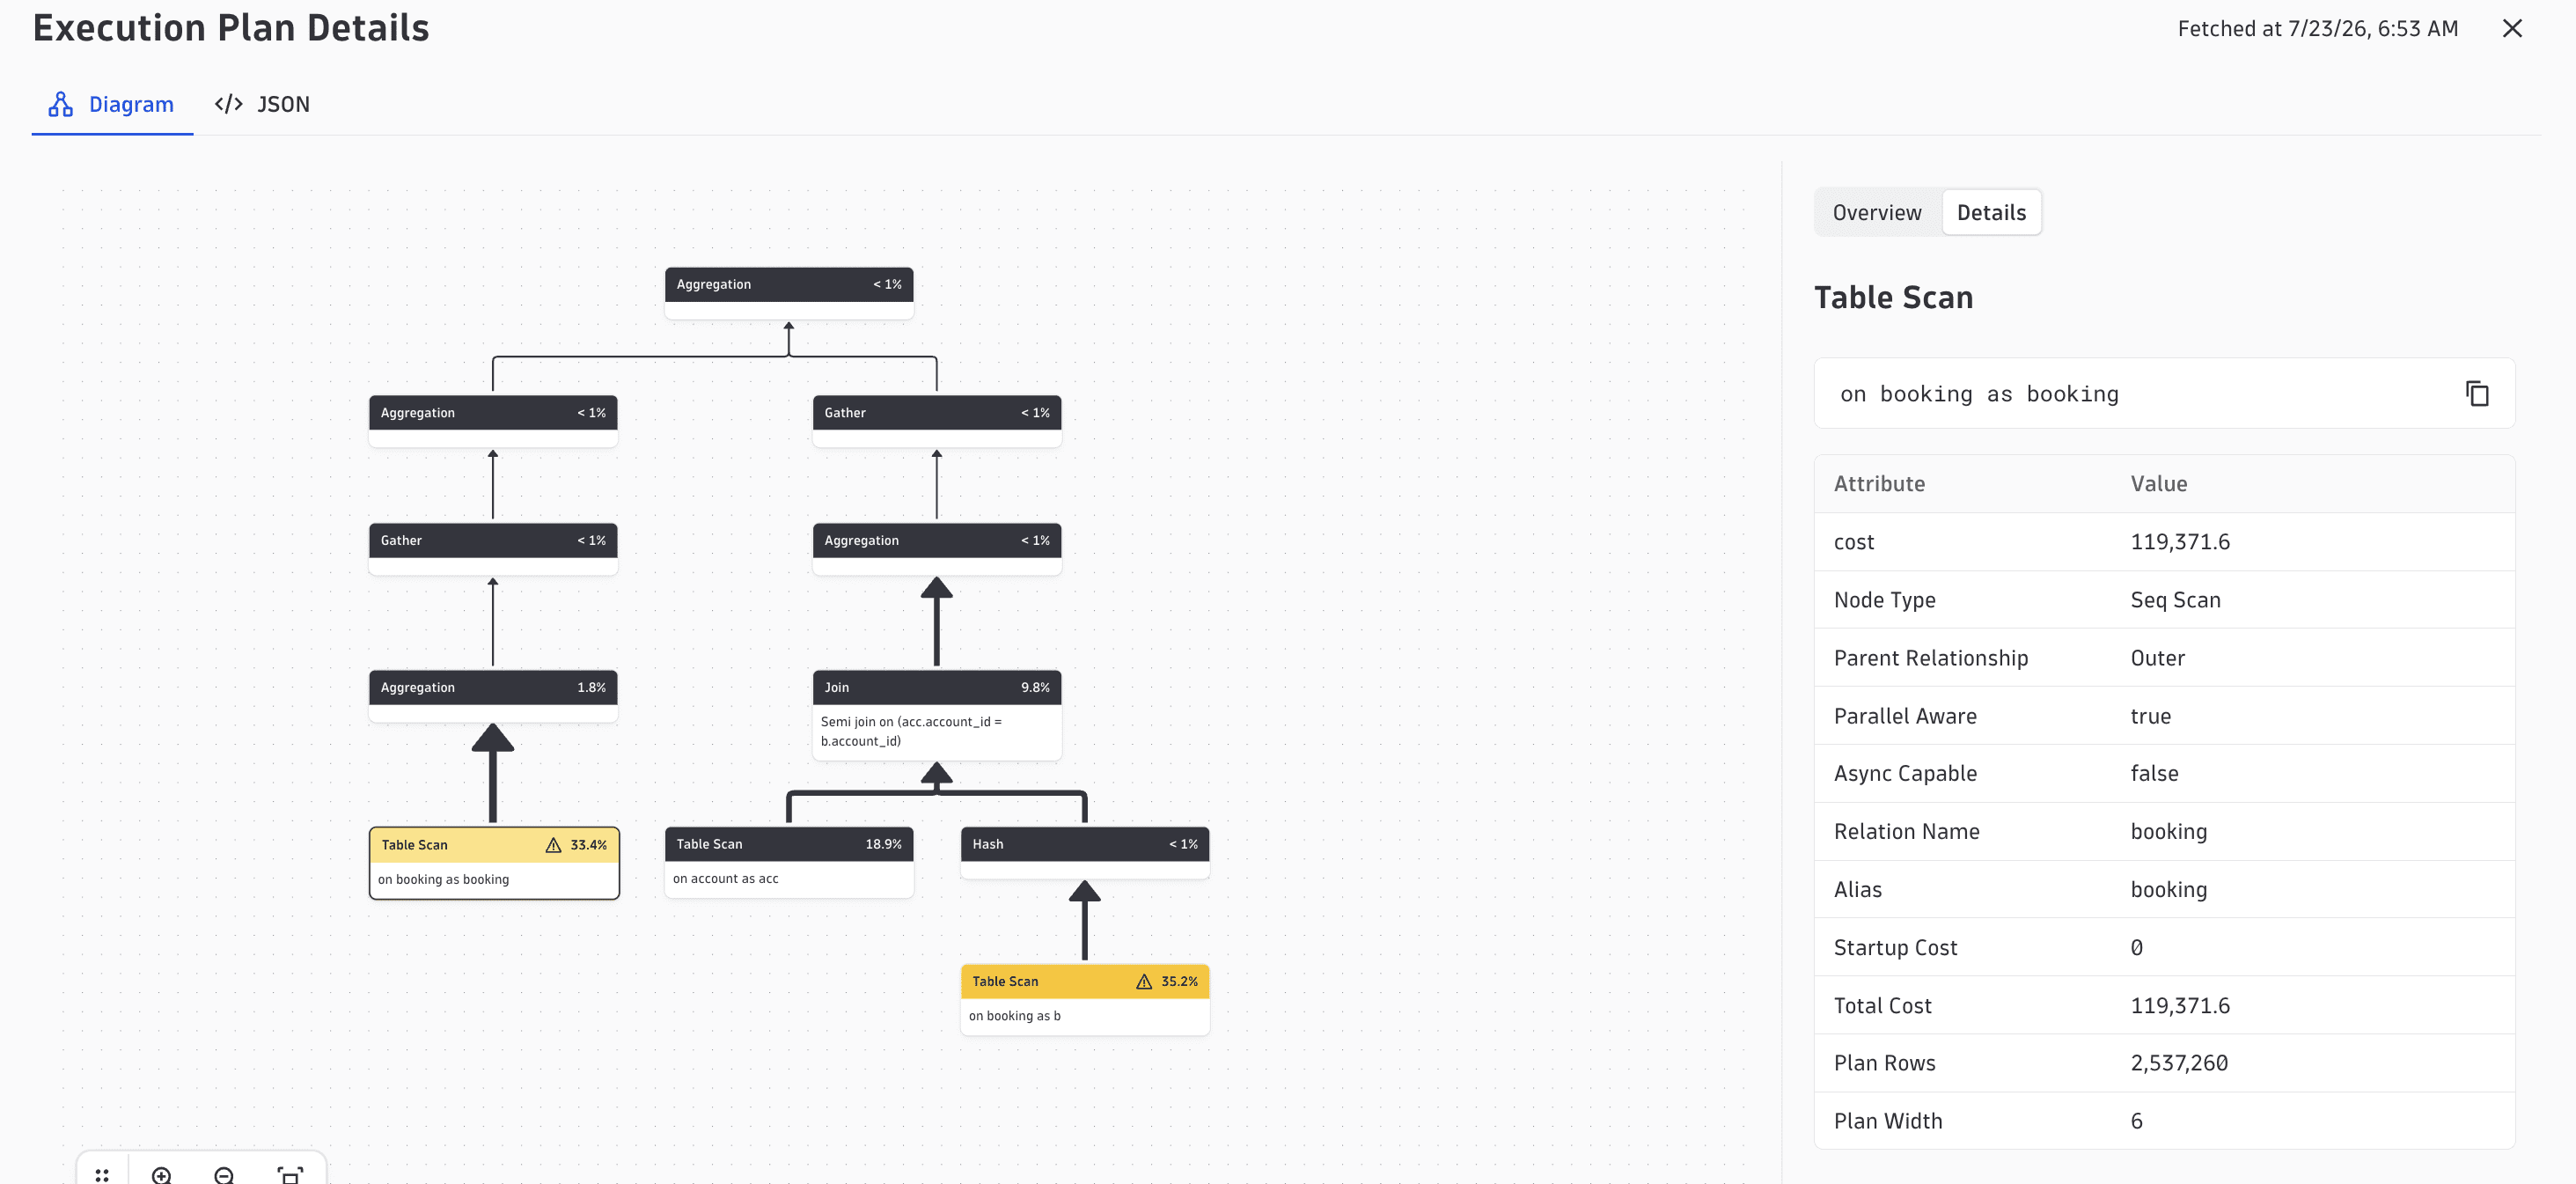
- Statement performance and execution plan visualization: Analyze resource-intensive queries and auto-fetch execution plans, then visualize each plan to see how the database runs the query and where to optimize.
- Connection metrics and blocking activity: See connection usage and blocking sessions to diagnose contention faster.
- Improved topology discovery with Smartscape: Your database instances are mapped to their hosts and calling services, so you can troubleshoot across the full stack.
- Health score and proactive alerting: A predefined health score evaluates availability, performance, configuration, and resource usage, and ready-made health alerts and warning signals with alert templates help you act before issues affect operations.
- Deeper query insights: Insights surface anomalies, bottlenecks, and best-practice violations.
For example, you can visualize execution plans and explore your database schema directly in Databases:
What will you do?
To upgrade, you need to:
- Activate New Database Monitoring.
- Upgrade your monitoring configurations to the latest extension versions and re-run onboarding for each instance.
Before you begin
-
You need the permission (
settings:objects:write WHERE settings:schemaId = 'builtin:licensing.new-database-monitoring-experience').You can request your environment administrator to create a custom policy that grants this permission, or use one of the default built-in policies that include the broader
settings:objects:writepermission: Admin user or Settings Writer. -
Make sure at least one Environment ActiveGate version 1.341.0+, with the Extension Execution Controller enabled, can reach your database hosts.
-
To use New Database Monitoring across all your environments, repeat the upgrade in each environment.
How to upgrade
1. Activate New Database Monitoring
Make sure New Database Monitoring is included in your Dynatrace Platform Subscription (DPS). If it isn't, contact your account team to add it. When you activate it, Dynatrace updates your settings and billing automatically, and your existing data stays unaffected.
You can activate it from Databases or from  Settings.
Activate from Databases
To activate New Database Monitoring from within Databases:
-
Open
Databases. -
In the Overview or Explorer tab, find the New Database Monitoring is now available banner and select How to activate?.
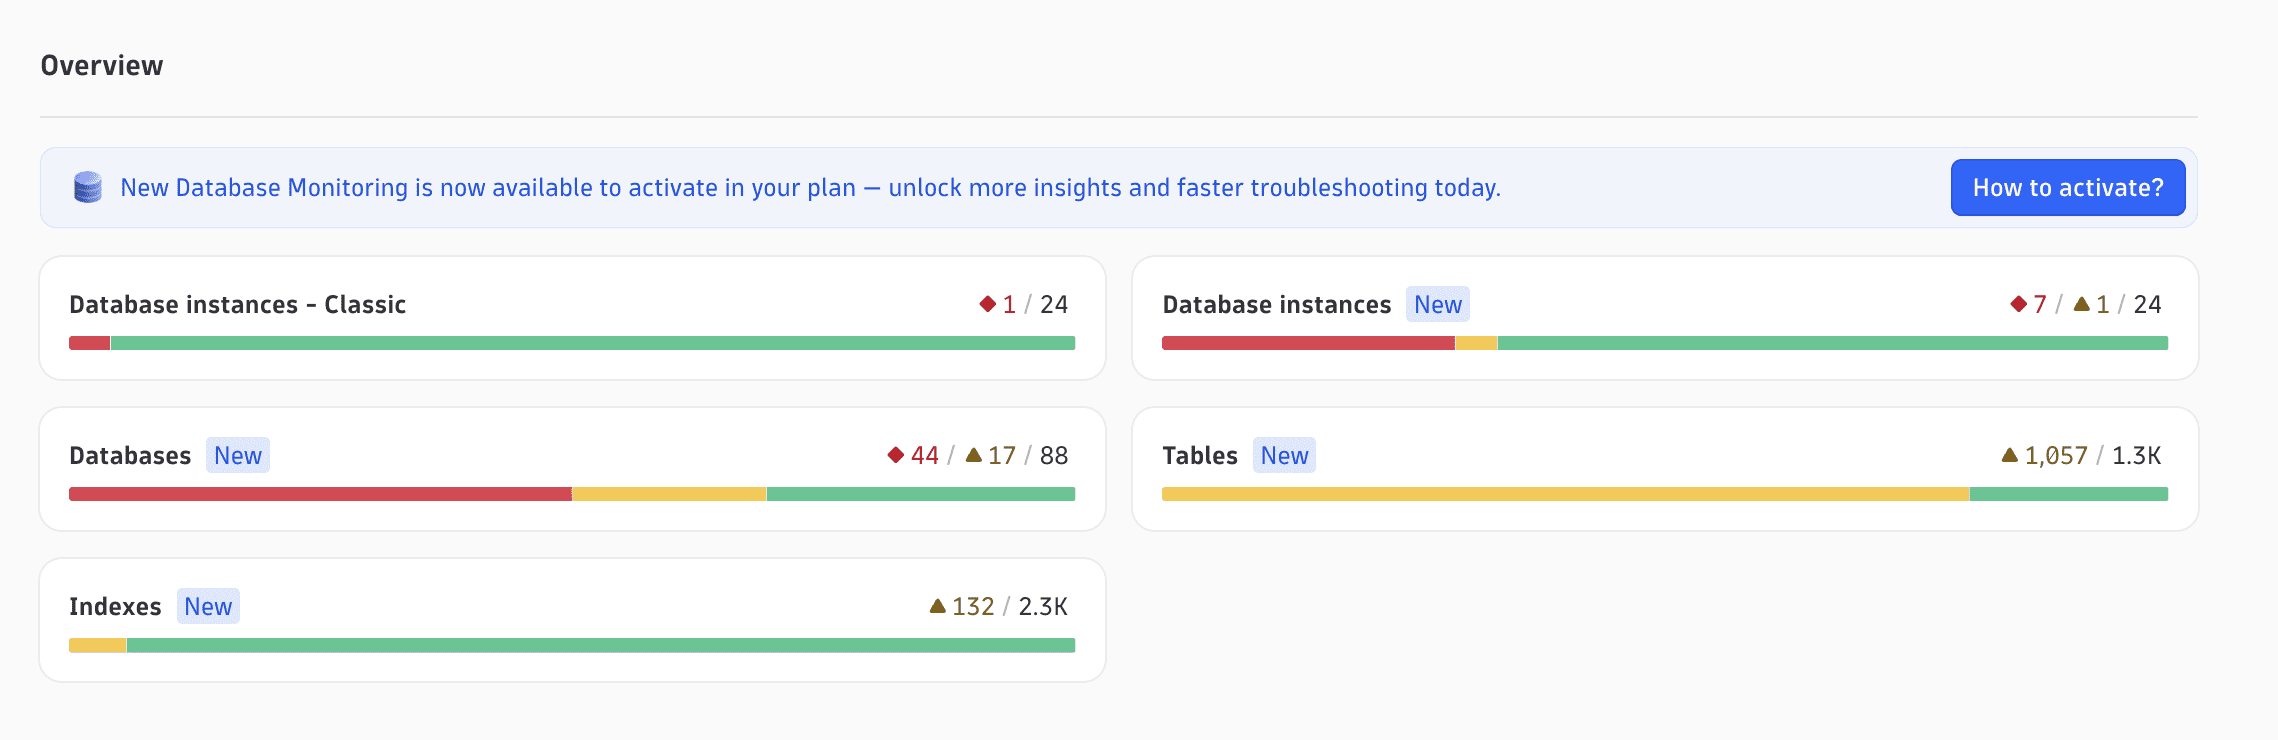 The New Database Monitoring availability banner with the How to activate? button
 -
In the New Database Monitoring dialog, under How to get it, select Activate now.
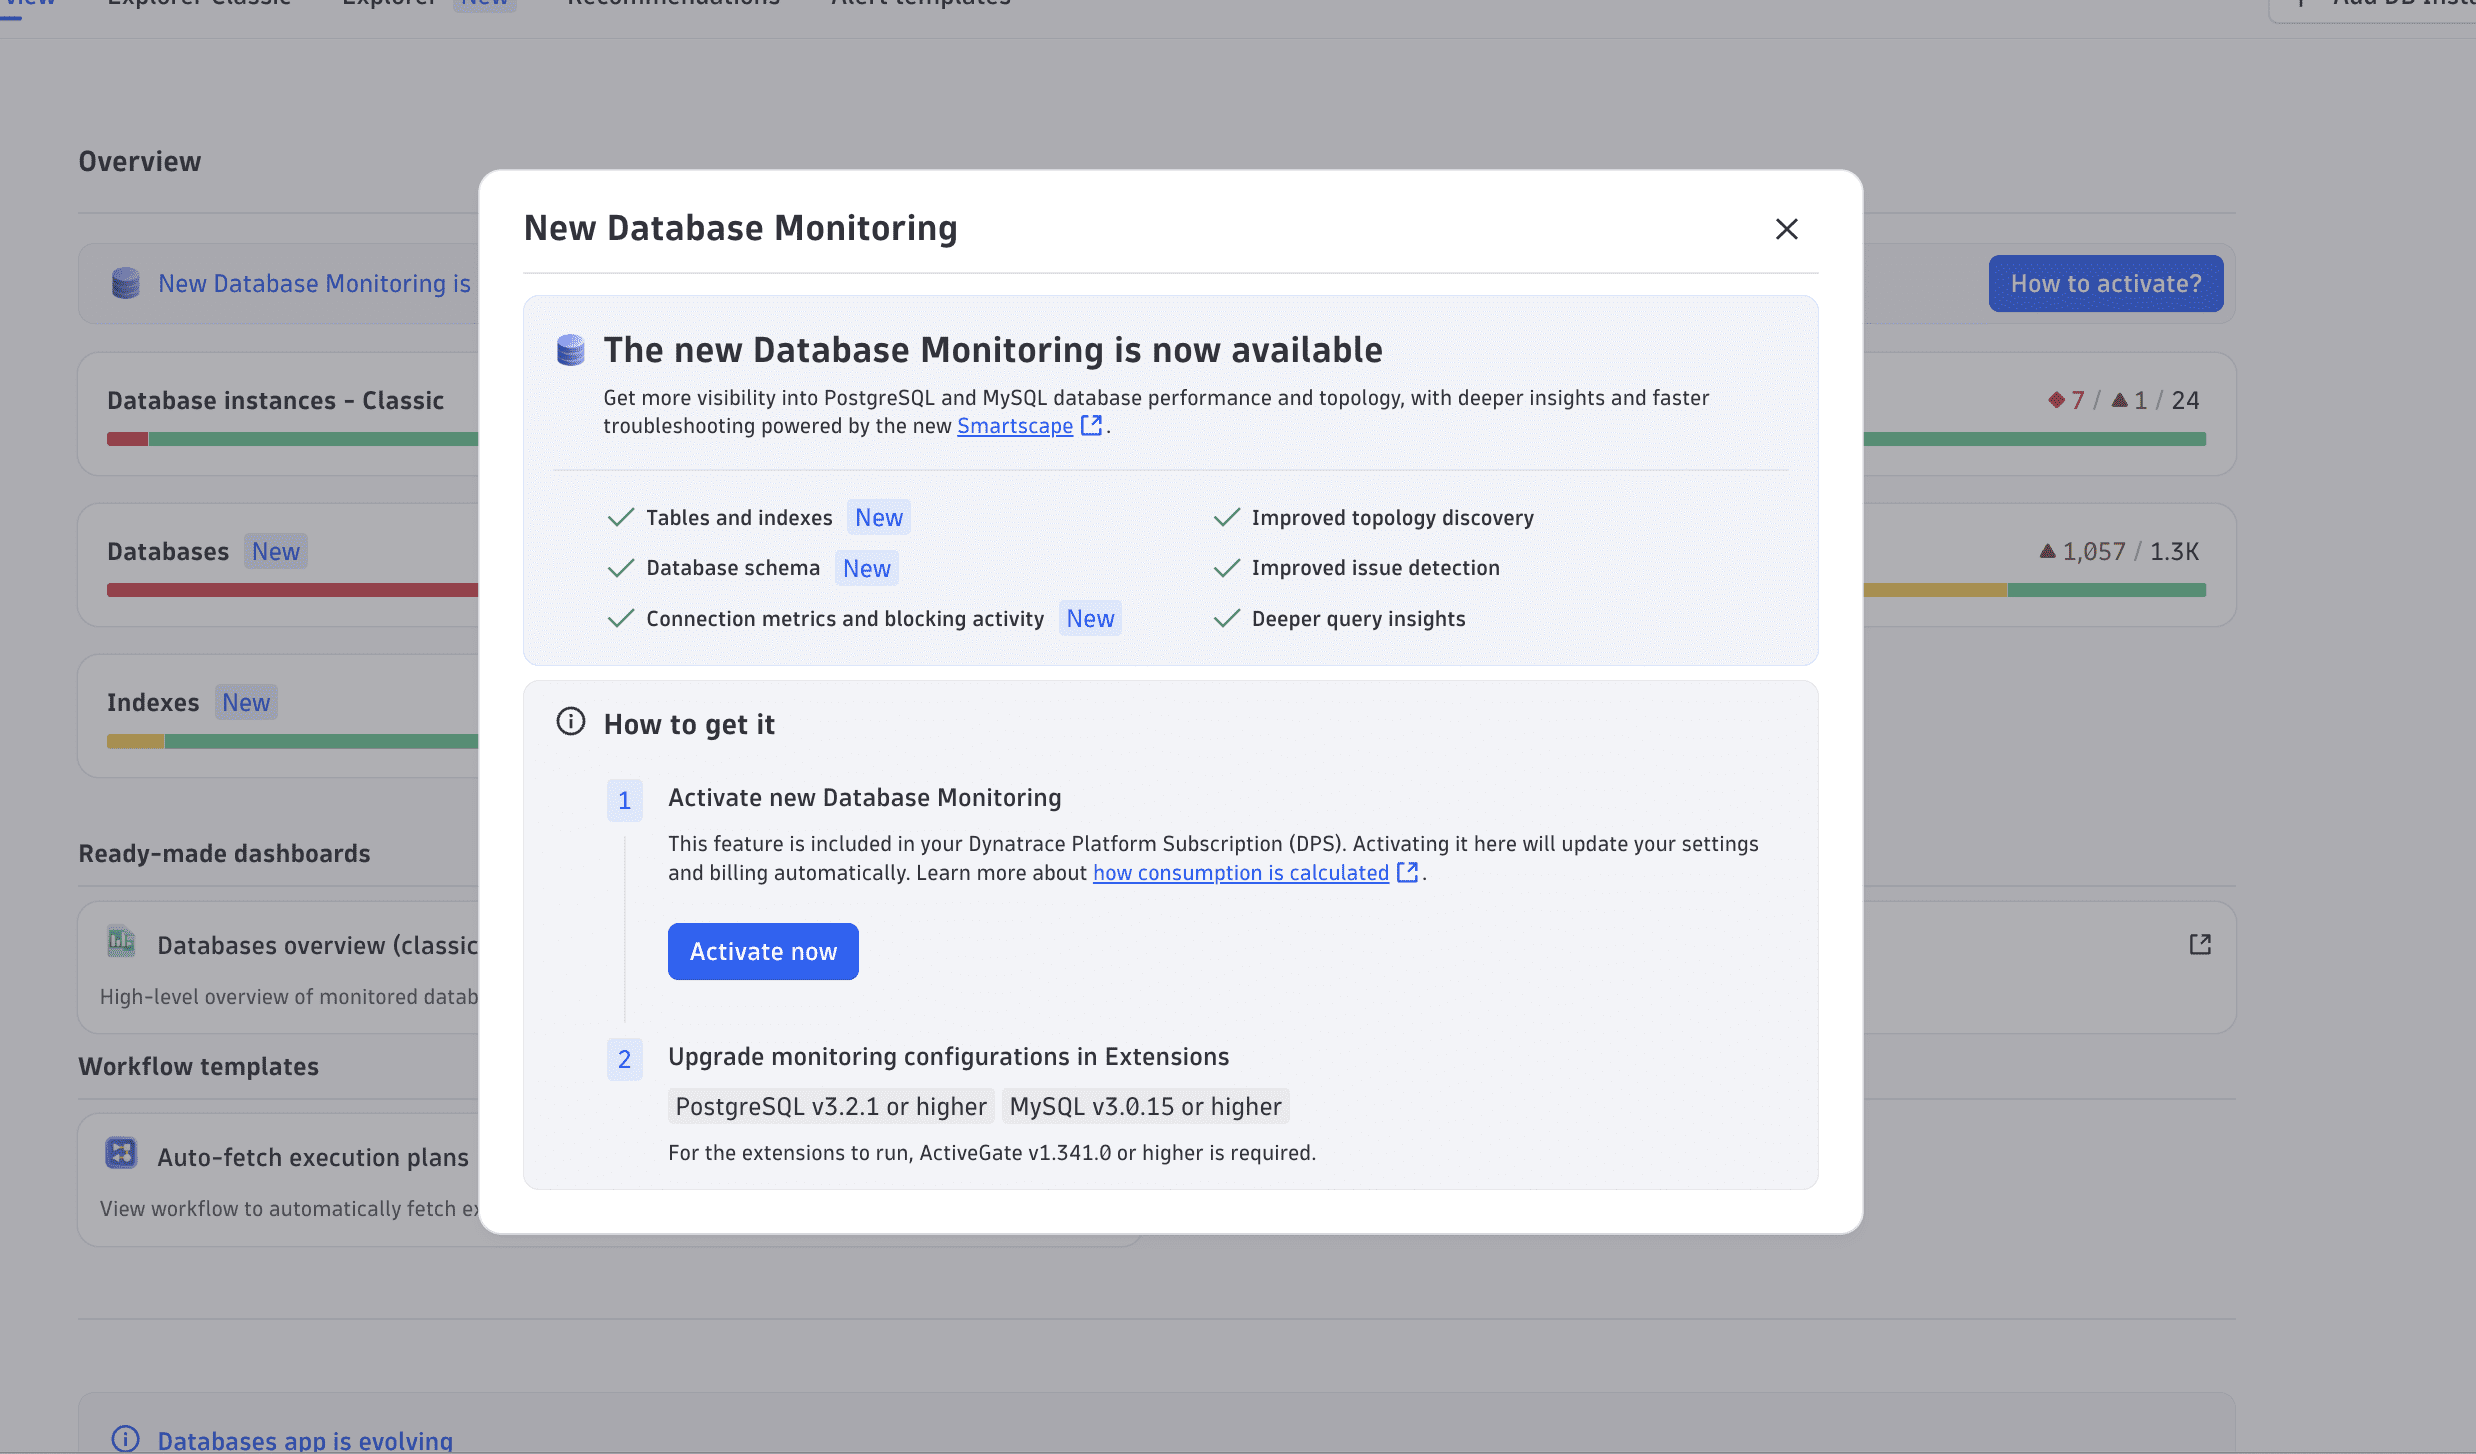 The New Database Monitoring dialog with the capability list and How to get it steps
 -
In the Activate new Database Monitoring? dialog, select Activate. New Database Monitoring is enabled immediately, new billing applies moving forward, and your existing data stays unaffected.
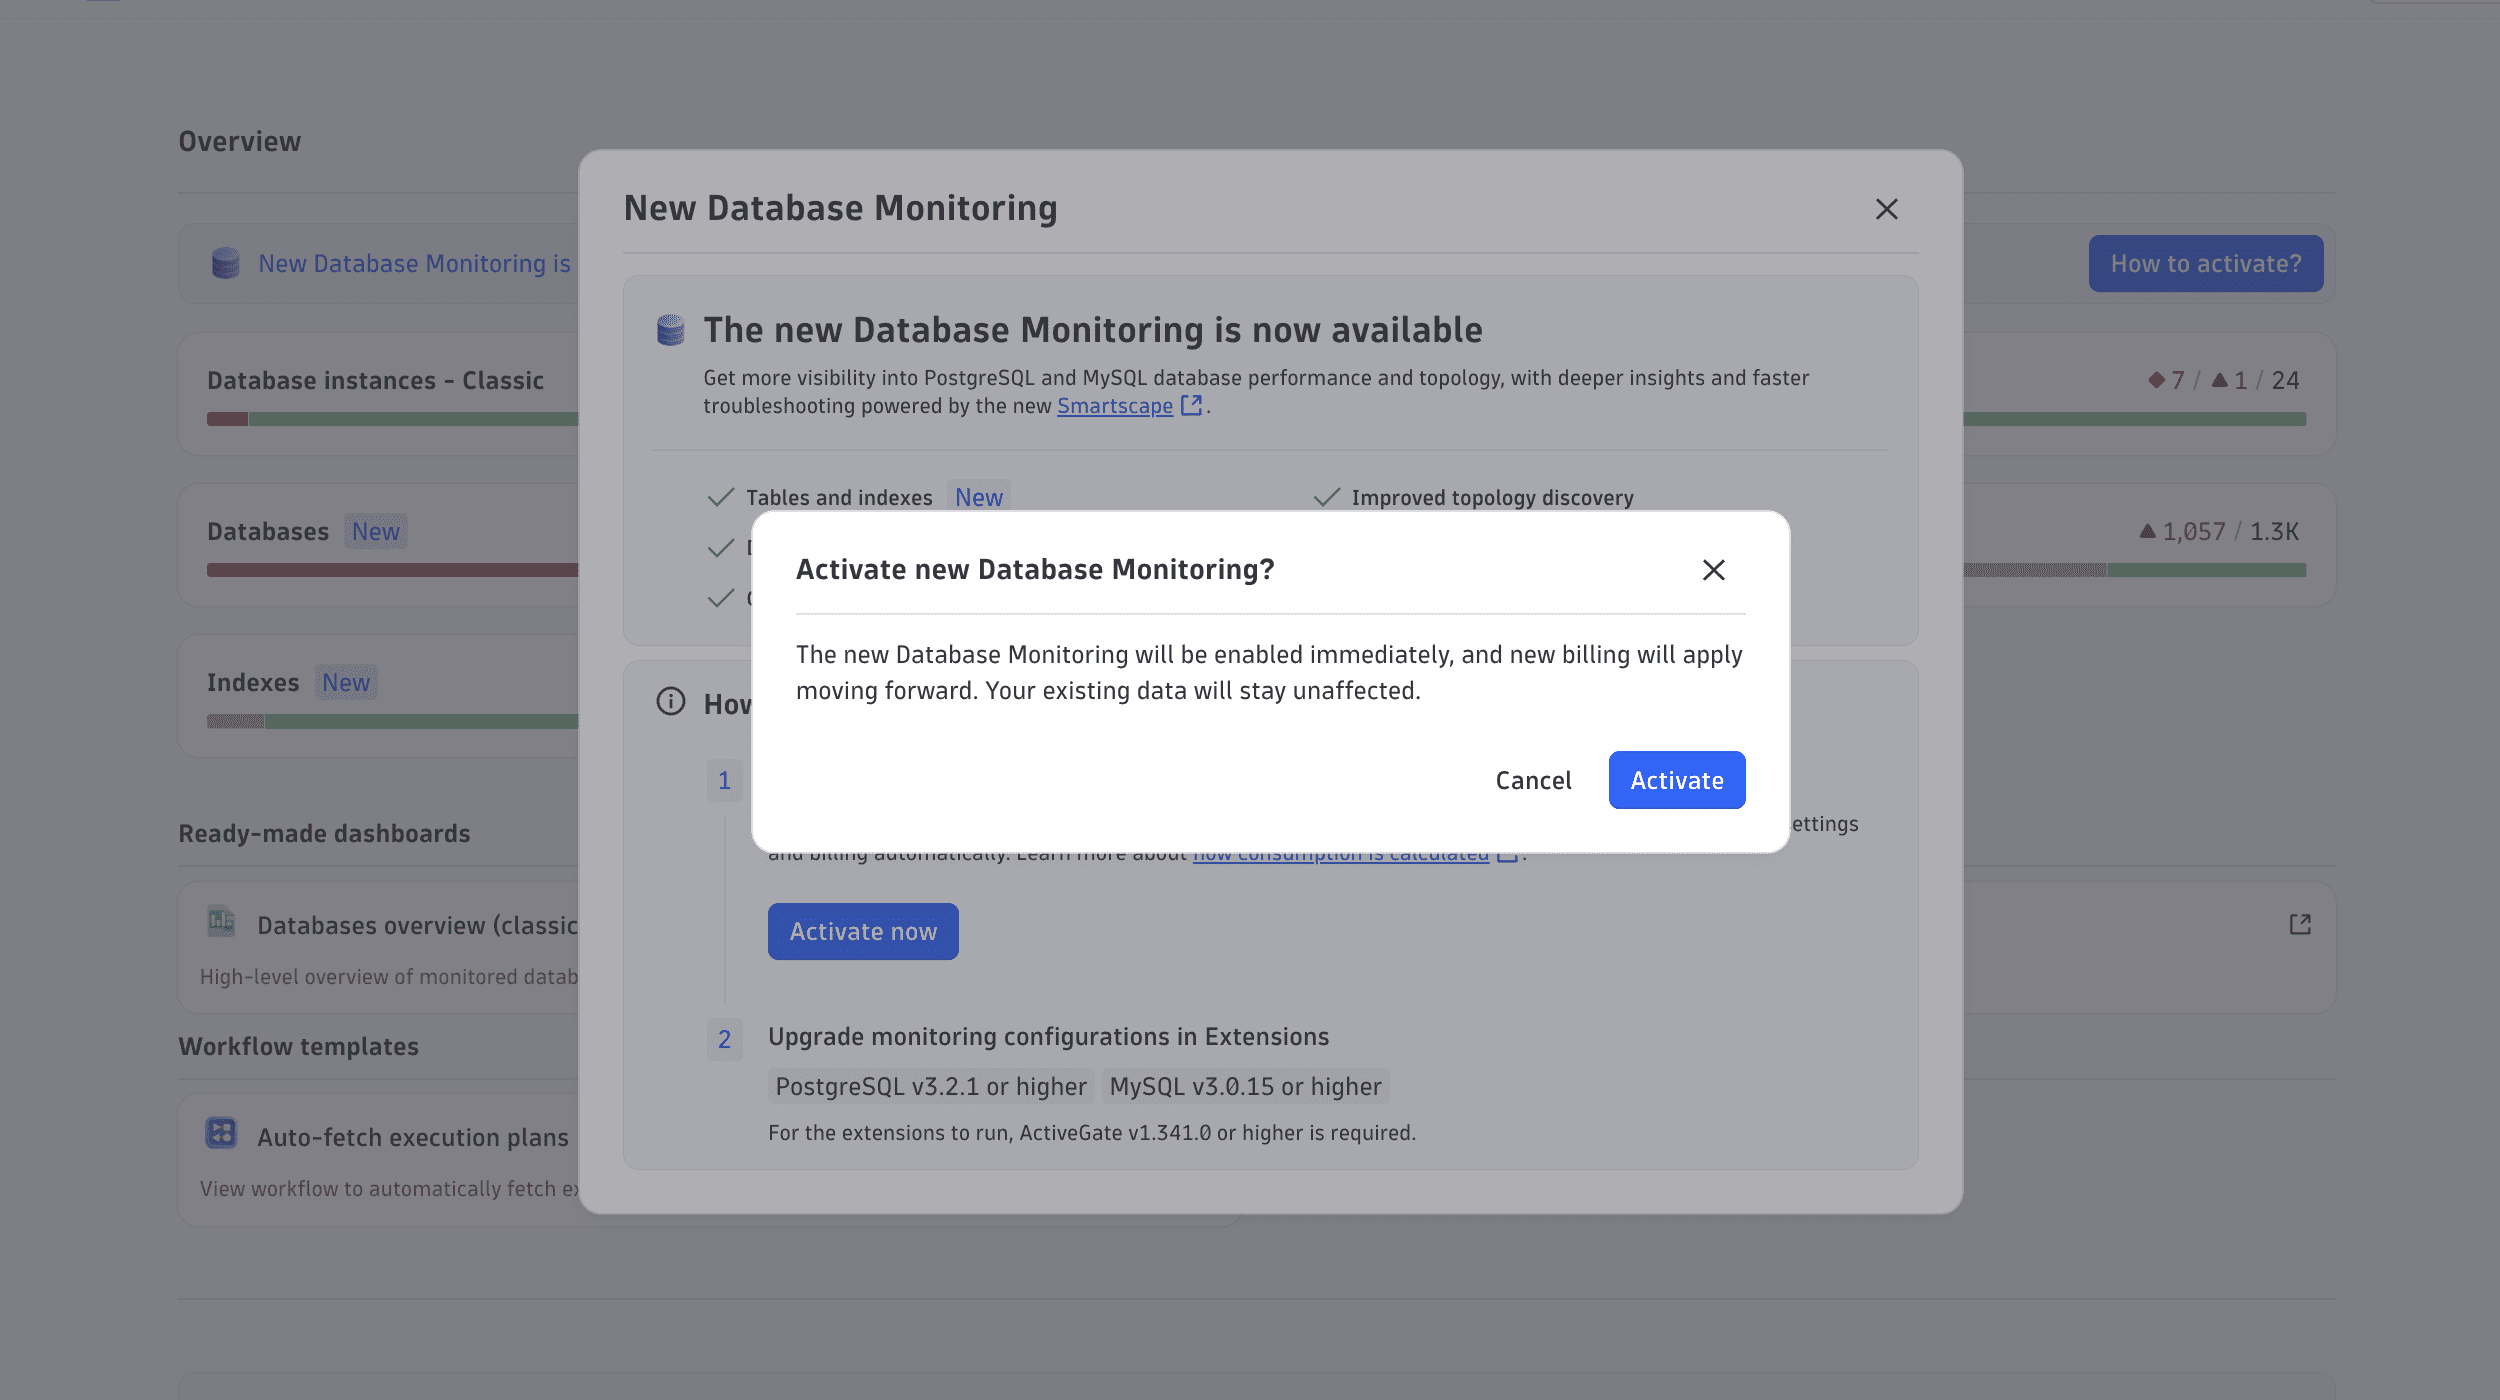 The Activate new Database Monitoring confirmation dialog
Activate from Settings
To activate New Database Monitoring from within Settings:
- Go to Settings > Apps > Database Monitoring.
- Turn on Enable Database Monitoring.
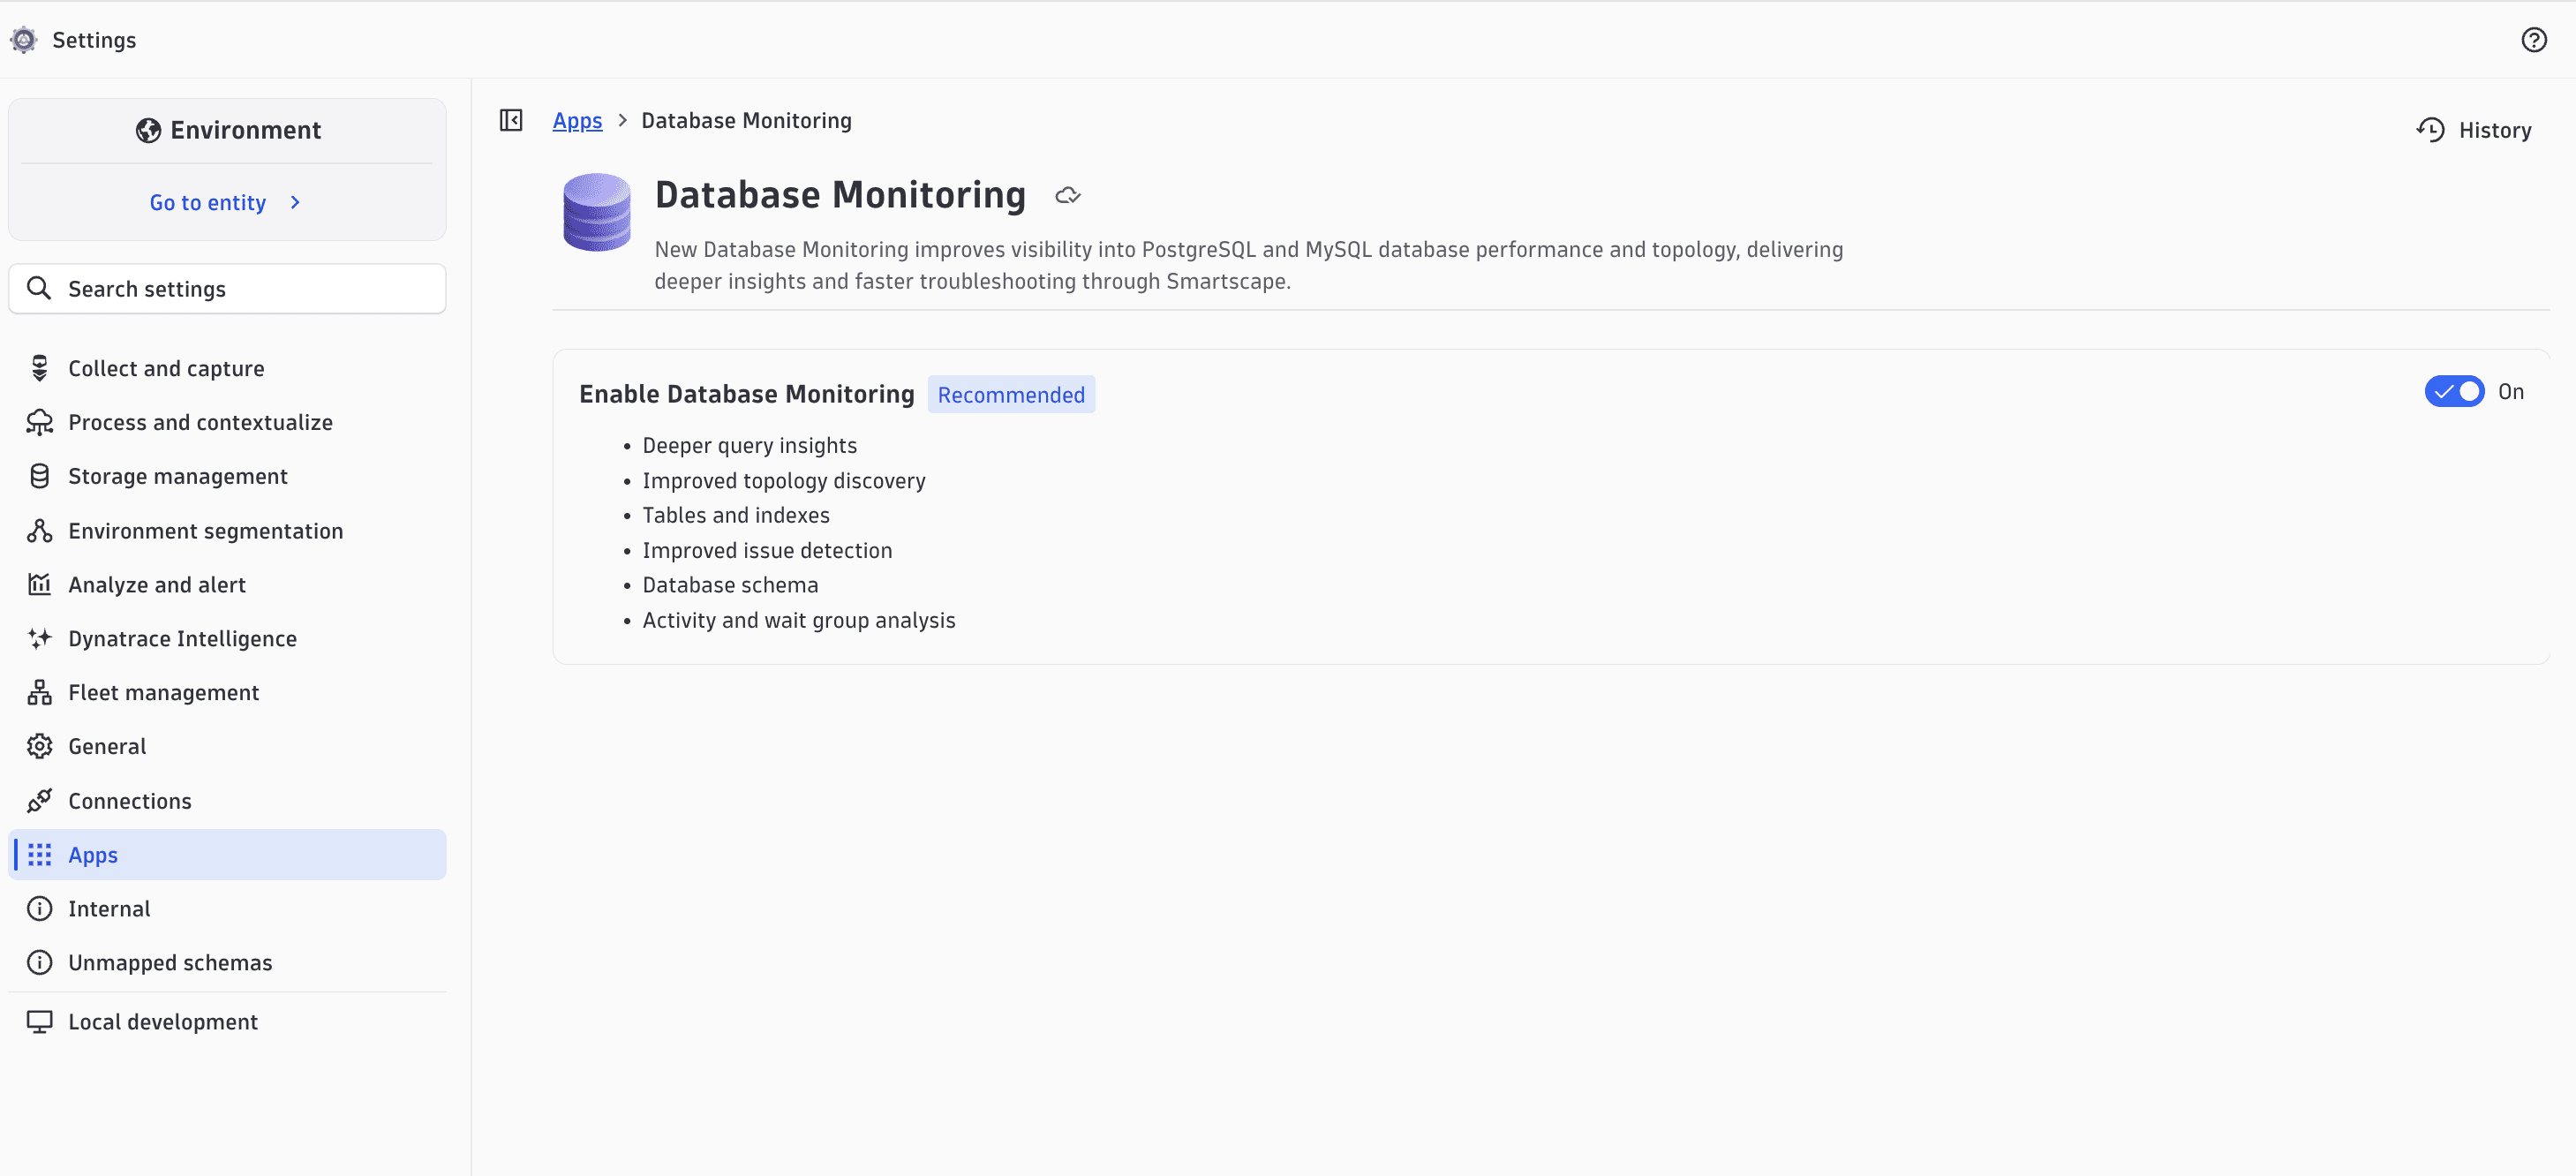
After activating, the New Database Monitoring is now available banner no longer appears and Enable Database Monitoring shows On in Settings.
2. Upgrade your monitoring configurations
You need to update your PostgreSQL and MySQL extensions, and re-run the setup and validation script for each monitored instance. The latest extension requires a different set of database permissions than the previous version.
If you skip this step, some metrics, top queries, or execution plans can stop working.
For each monitored instance:
-
Update the PostgreSQL and MySQL extensions to at least the following versions:
- PostgreSQL: version 3.2.4 or higher
- MySQL: version 3.1.2 or higher
For detailed steps, see Update an extension from Dynatrace Hub.
Running the onboarding flow again triggers the current installation and validation scripts, which create the
dynatracemonitoring user with the required grants, the execution-plan helper function, and theperformance_schema(MySQL) orpg_stat_statements(PostgreSQL) settings that the new extension expects. -
Re-run the setup and run the validation script to confirm the required permissions and objects are in place.
- For MySQL, see Monitor MySQL database.
- For PostgreSQL, see Monitor PostgreSQL database.
After re-running onboarding, the Monitor extension status view shows Up to date under Version check for the updated extension.
3. Verify the upgrade
To confirm that the upgrade is complete, you can repeat these verification steps:
- In Databases, verify that the New Database Monitoring is now available banner no longer appears.
- In Settings > Apps > Database Monitoring, verify that Enable Database Monitoring is On.
- In Databases > Recommendations > Monitor extension status, confirm that each extension shows Up to date under Version check and No errors under Extension logs. The table also lists the installed, required, and minimum configuration versions for each extension.
- In the Databases > Explorer tab, confirm that the Databases, Tables, and Indexes views report current data.
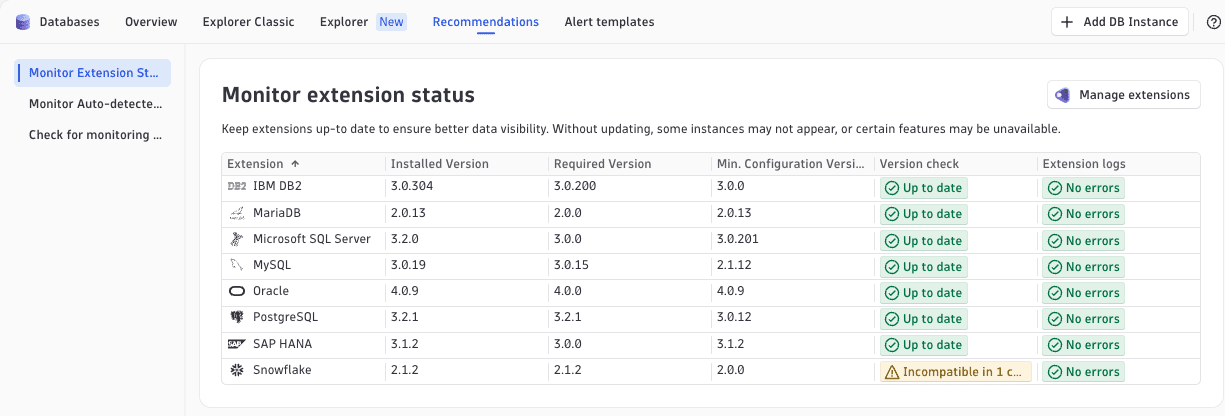
Troubleshoot the upgrade
The Databases > Recommendations tab helps you find and fix common issues after the upgrade—extensions that still need updating, monitoring gaps caused by incomplete onboarding, and databases that aren't monitored yet.
Fix monitoring gaps
Use Recommendations > Check for monitoring gaps to find instances where monitoring is only partially working. Gaps such as Execution plan not available or Queries not available usually mean onboarding didn't finish, or the dynatrace monitoring user lacks the permissions or helper functions that the latest extension requires.
To resolve a gap:
- Select the gap, then select View details.
- In the side panel, follow the How to fix this steps, which re-run the installation script to create the missing user, grants, and functions.
For the full re-onboarding procedure, see Monitor MySQL database or Monitor PostgreSQL database.
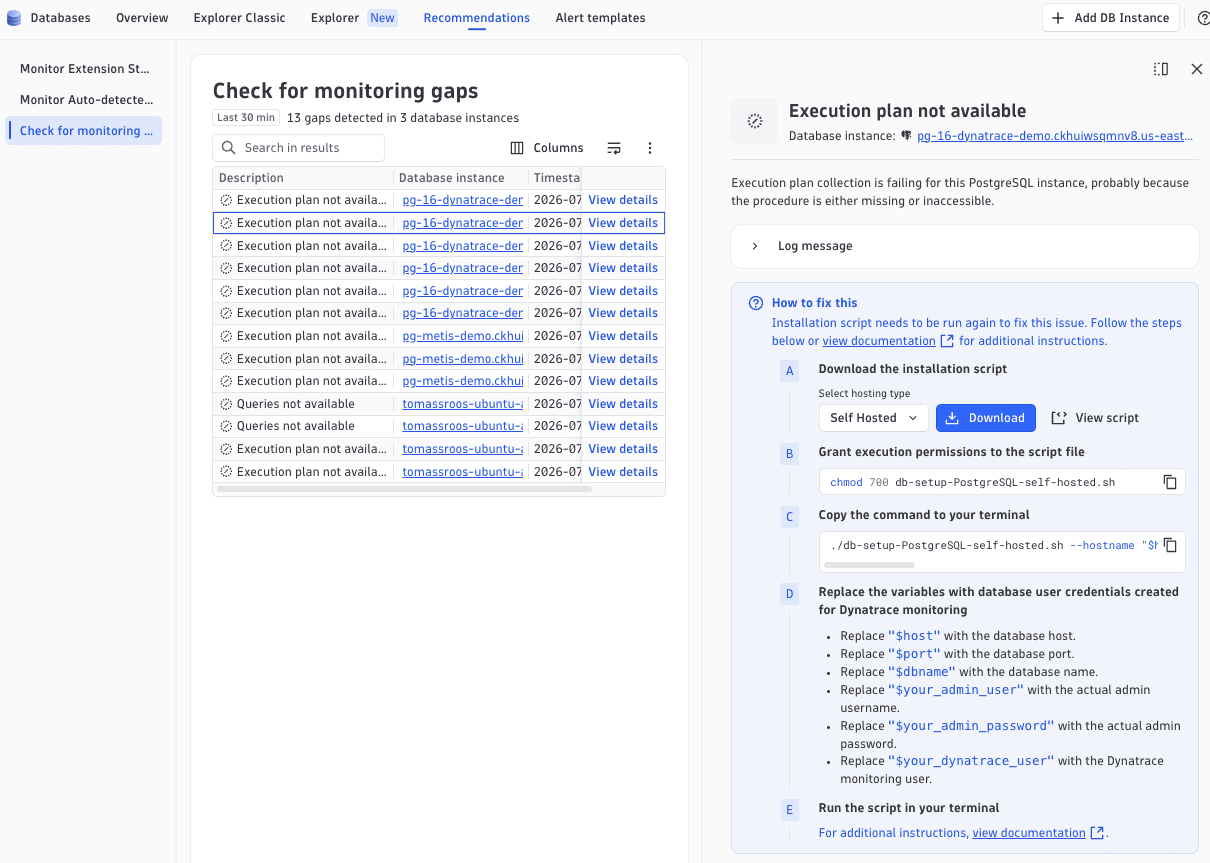
Find unmonitored databases
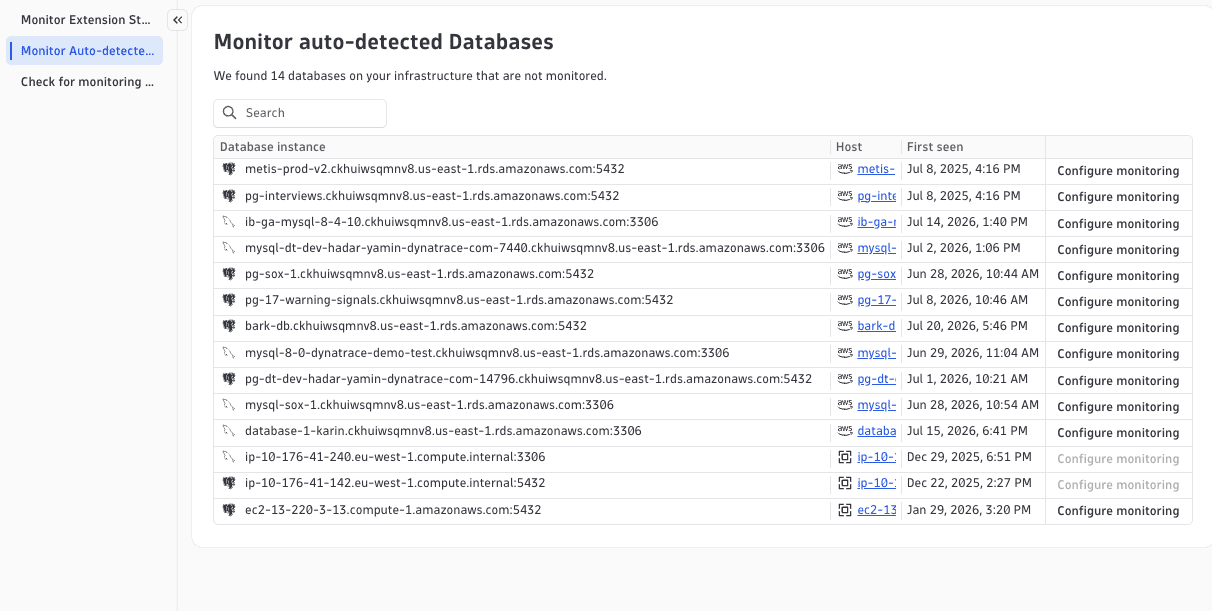
Use Recommendations > Monitor auto-detected Databases to review database instances that Dynatrace discovered in your infrastructure but that aren't monitored yet. For each instance, select Configure monitoring to onboard it.
Update outdated or incompatible extensions
If Monitor extension status shows Incompatible under Version check, or reports errors under Extension logs, update the affected extension and re-run onboarding. See Upgrade your monitoring configurations.
How to get help
If you have questions or encounter issues during the upgrade, contact Dynatrace Support.
Databases