Oracle GoldenGate Extension
- Latest Dynatrace
- Extension
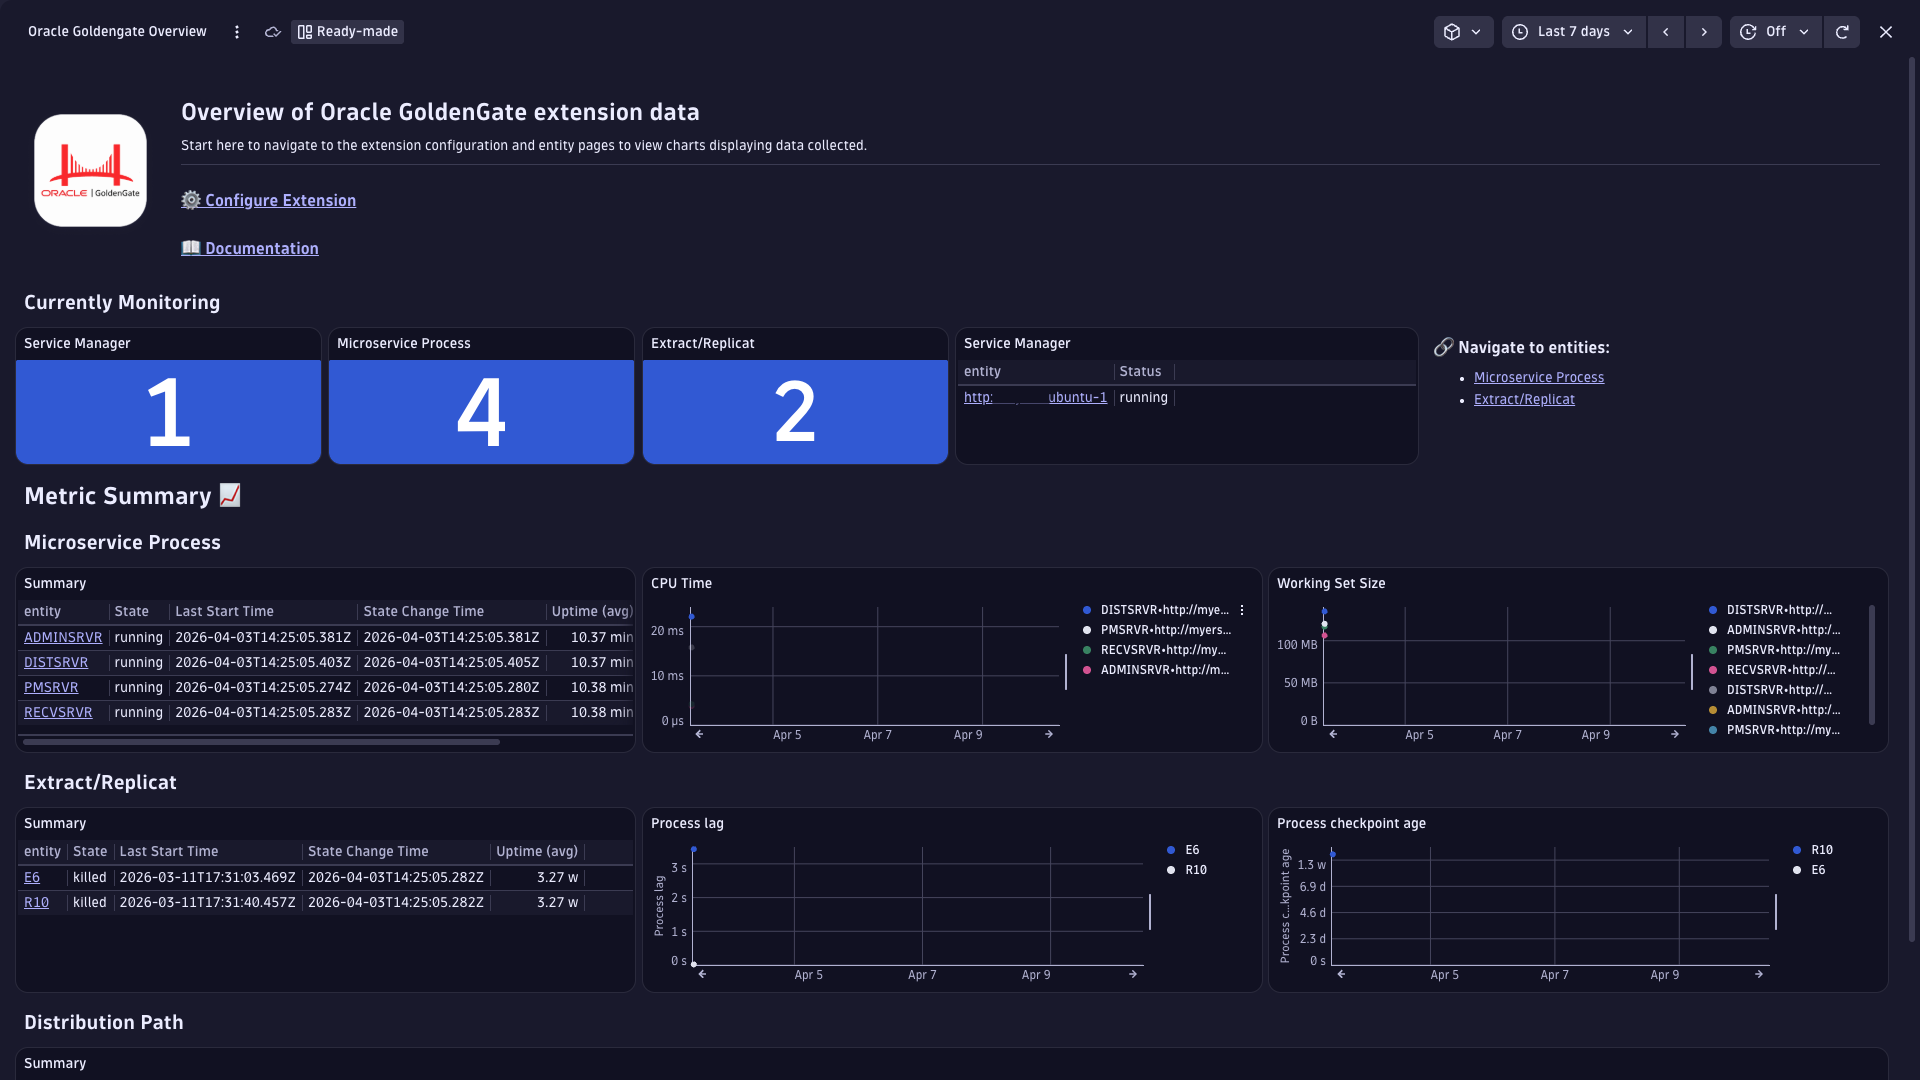
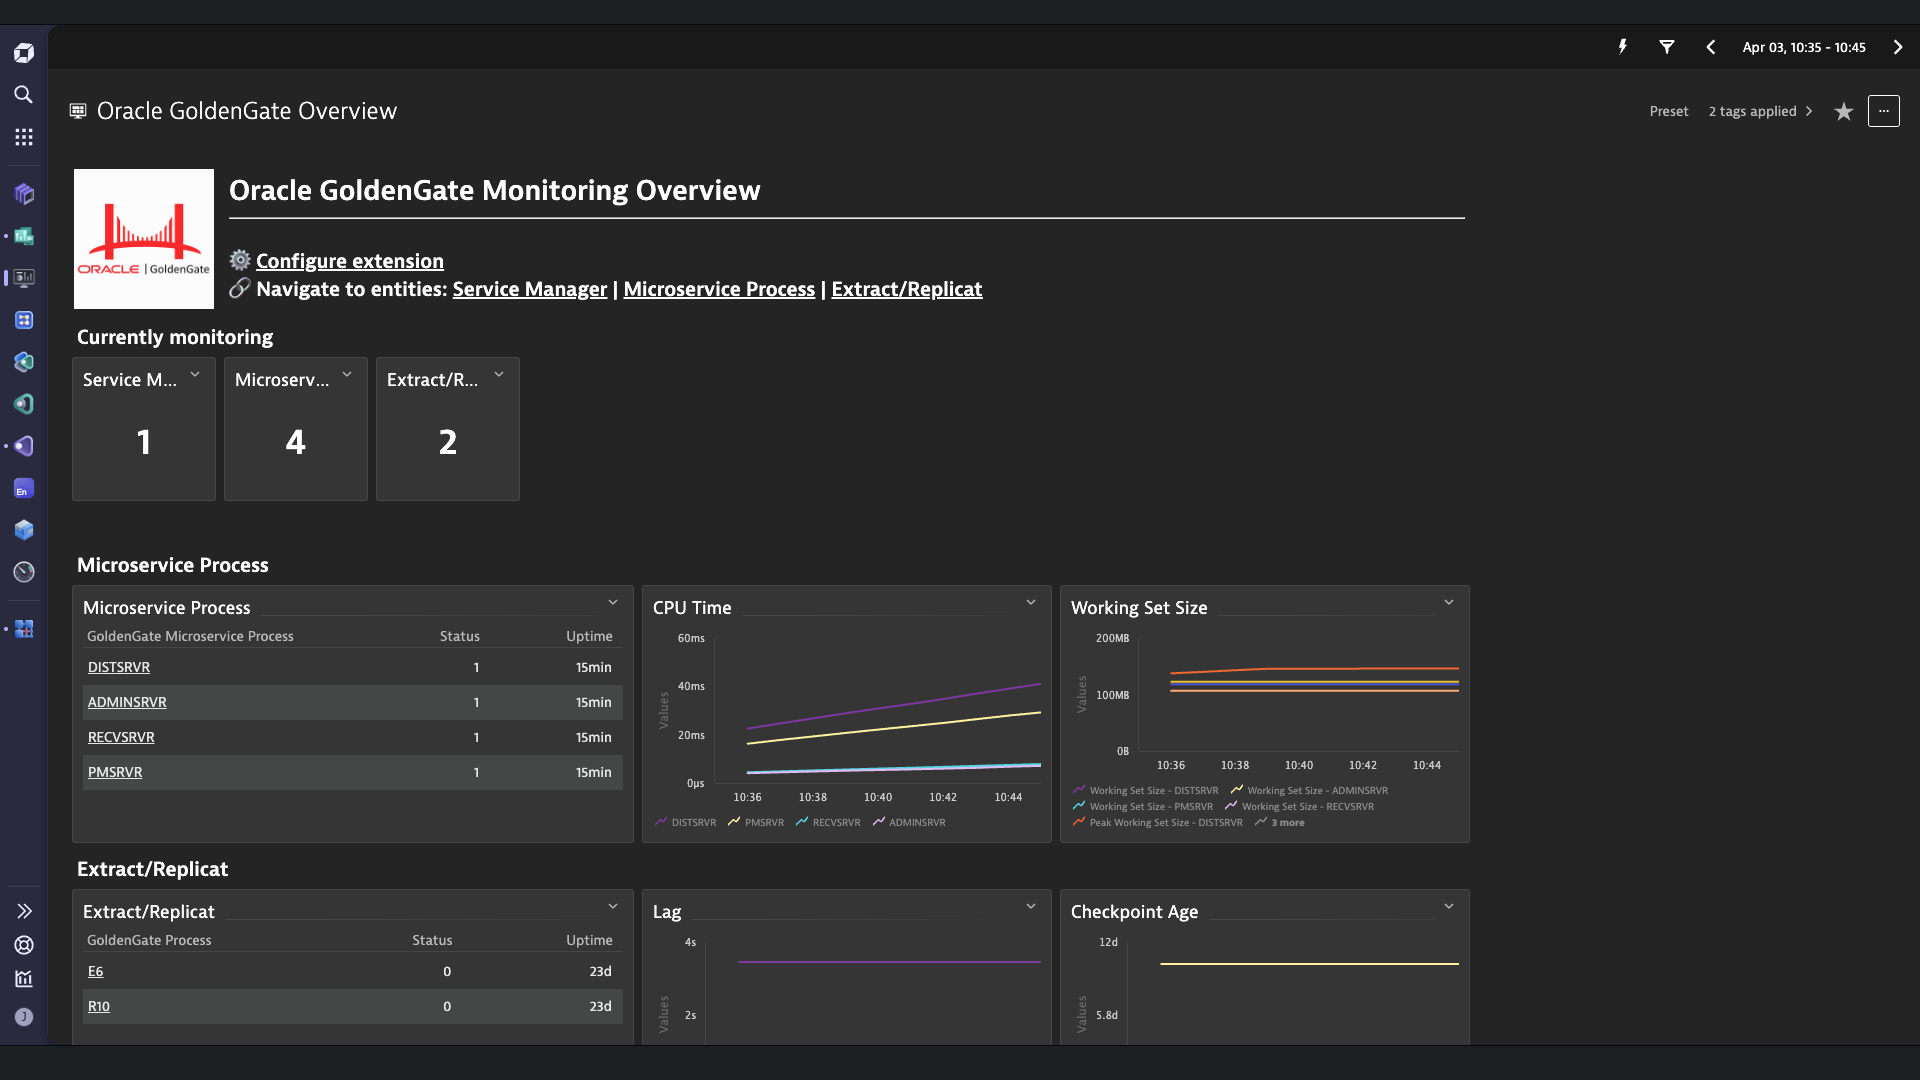
Get full observability into Oracle GoldenGate replication pipelines, including Service Manager status, microservice metrics, and extract trail statistics.
Get started
Overview
This remote extension runs on an ActiveGate in your environment. It executes various API calls on the GoldenGate hosts you want to monitor and sends the collected information to Dynatrace.
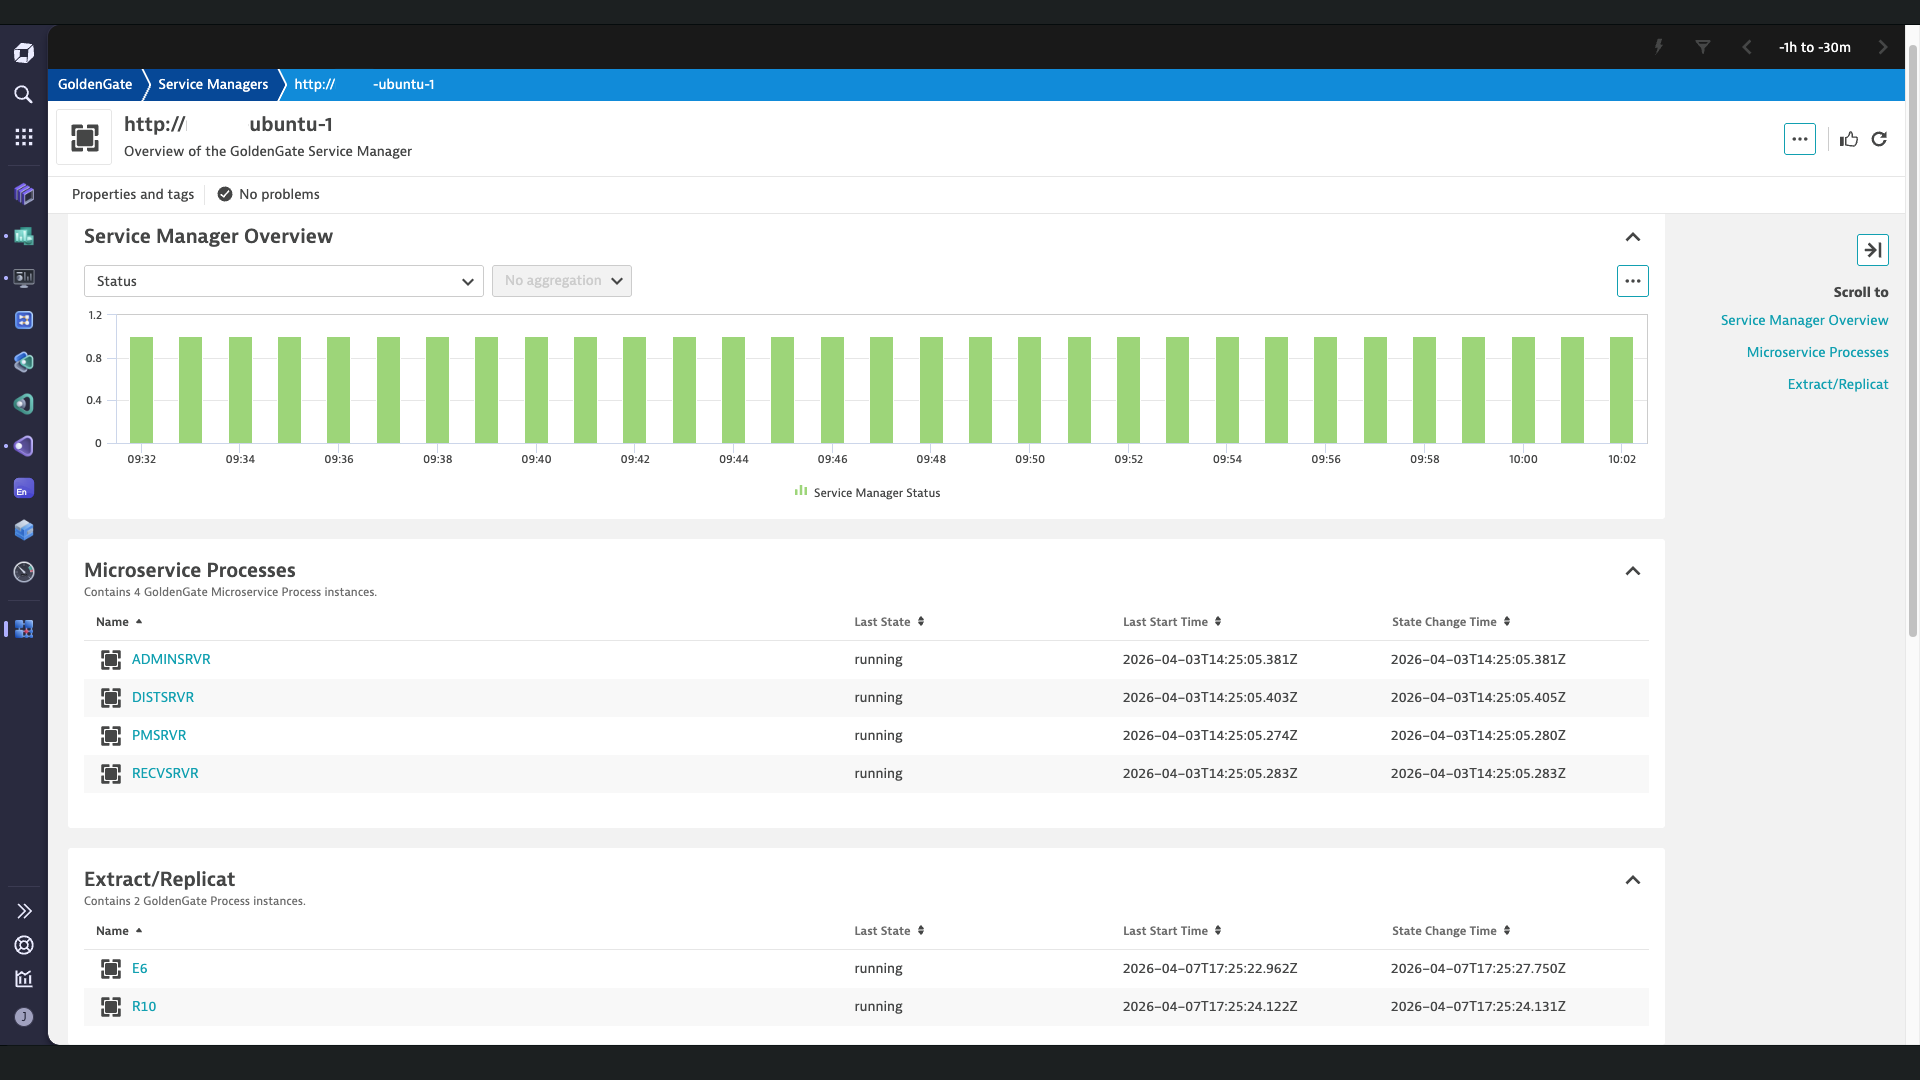
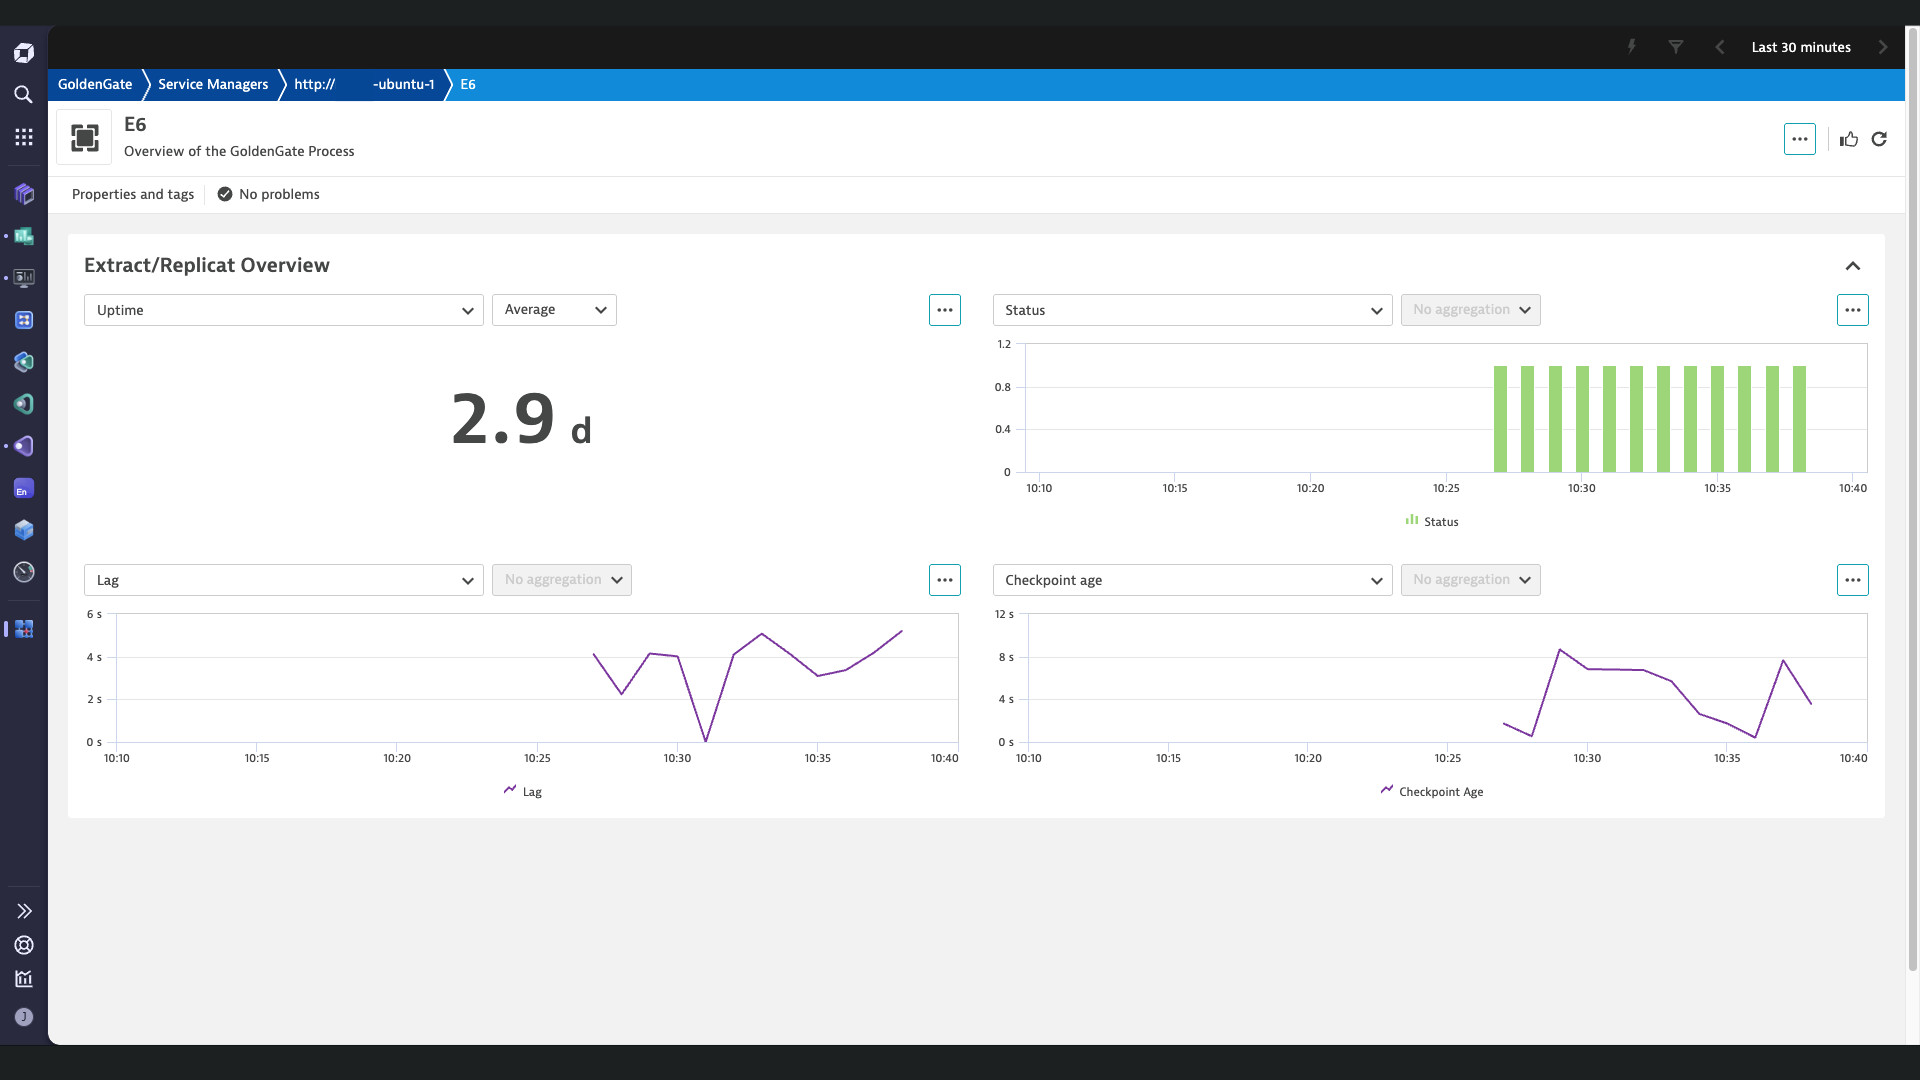
The Oracle GoldenGate extension monitors the overall health and state of GoldenGate servers and their underlying microservices, performance of extract and replicat processes, and the trails between these processes.
Use cases
- Monitor status of Service Manager, microservices, and distribution paths
- Collect performance statistics of microservices
- Monitor statistics of replication between databases via trails
- Detect and alert on anomalous behavior
Requirements
- Administrative Server port number
- Distribution Server port number
- Performance Metrics Server port number
- Service Manager port number
- GoldenGate credentials with read permissions to the following REST API endpoints:
/services/v2/extracts/{extract}/info/status/services/v2/replicats/{replicat}/info/status/services/v2/sources/services/v2/sources/{distpath}/services/v2/sources/{distpath}/info/services/v2/exttrails/services/v2/mpoints/{item}/trailOutput/services/v2/mpoints/processes/services/v2/mpoints/{item}/processPerformance
Activation and setup
- Go to Dynatrace Hub
 .
. - Select and install the Oracle GoldenGate extension.
- Go to
 Extensions.
 - Create a monitoring configuration using the required information.
Details
This extension uses the Oracle GoldenGate REST API to fetch important metrics and metadata for your service manager, microservices, extract and replicat processes, and extract trails.
Licensing and costs
There is no charge to use the extension. You are only charged for the data that the extension ingests.
The Oracle GoldenGate extension ingests custom metrics, which consume Davis Data Units (DDUs) (Dynatrace classic license) or Metrics powered by Grail (DPS), according to your license model.
The following formula provides the number of metric data points per minute, assuming all feature sets are enabled. Actual ingested metric data point volumes will depend heavily on your specific Oracle GoldenGate environment.
(1 * number of service managers)+ (6 * number of microservice processes)+ (2 * number of distribution paths)+ (4 * number of extract trails)+ (4 * number of extract processes)+ (4 * number of replicat processes)
Dynatrace Platform Subscription
In the Dynatrace Platform Subscription, metric ingestion consumes Metrics powered by Grail according to the number of ingested metric data points.
To calculate the approximate yearly consumption, apply the following calculation: <metric data points per minute> * 60 minutes * 24 hours * 365 days.
Dynatrace classic license
In the classic licensing model, metric ingestion consumes Davis Data Units (DDUs) at the rate of .001 DDUs per metric data point. Multiply the above formula for annual data points by .001 to estimate annual DDU usage.
The DDU cost above does not include any possible log events or custom events that are triggered by the extension. For more information, see DDU events.
Feature sets
Microservice
| Metric name | Metric key | Description |
|---|---|---|
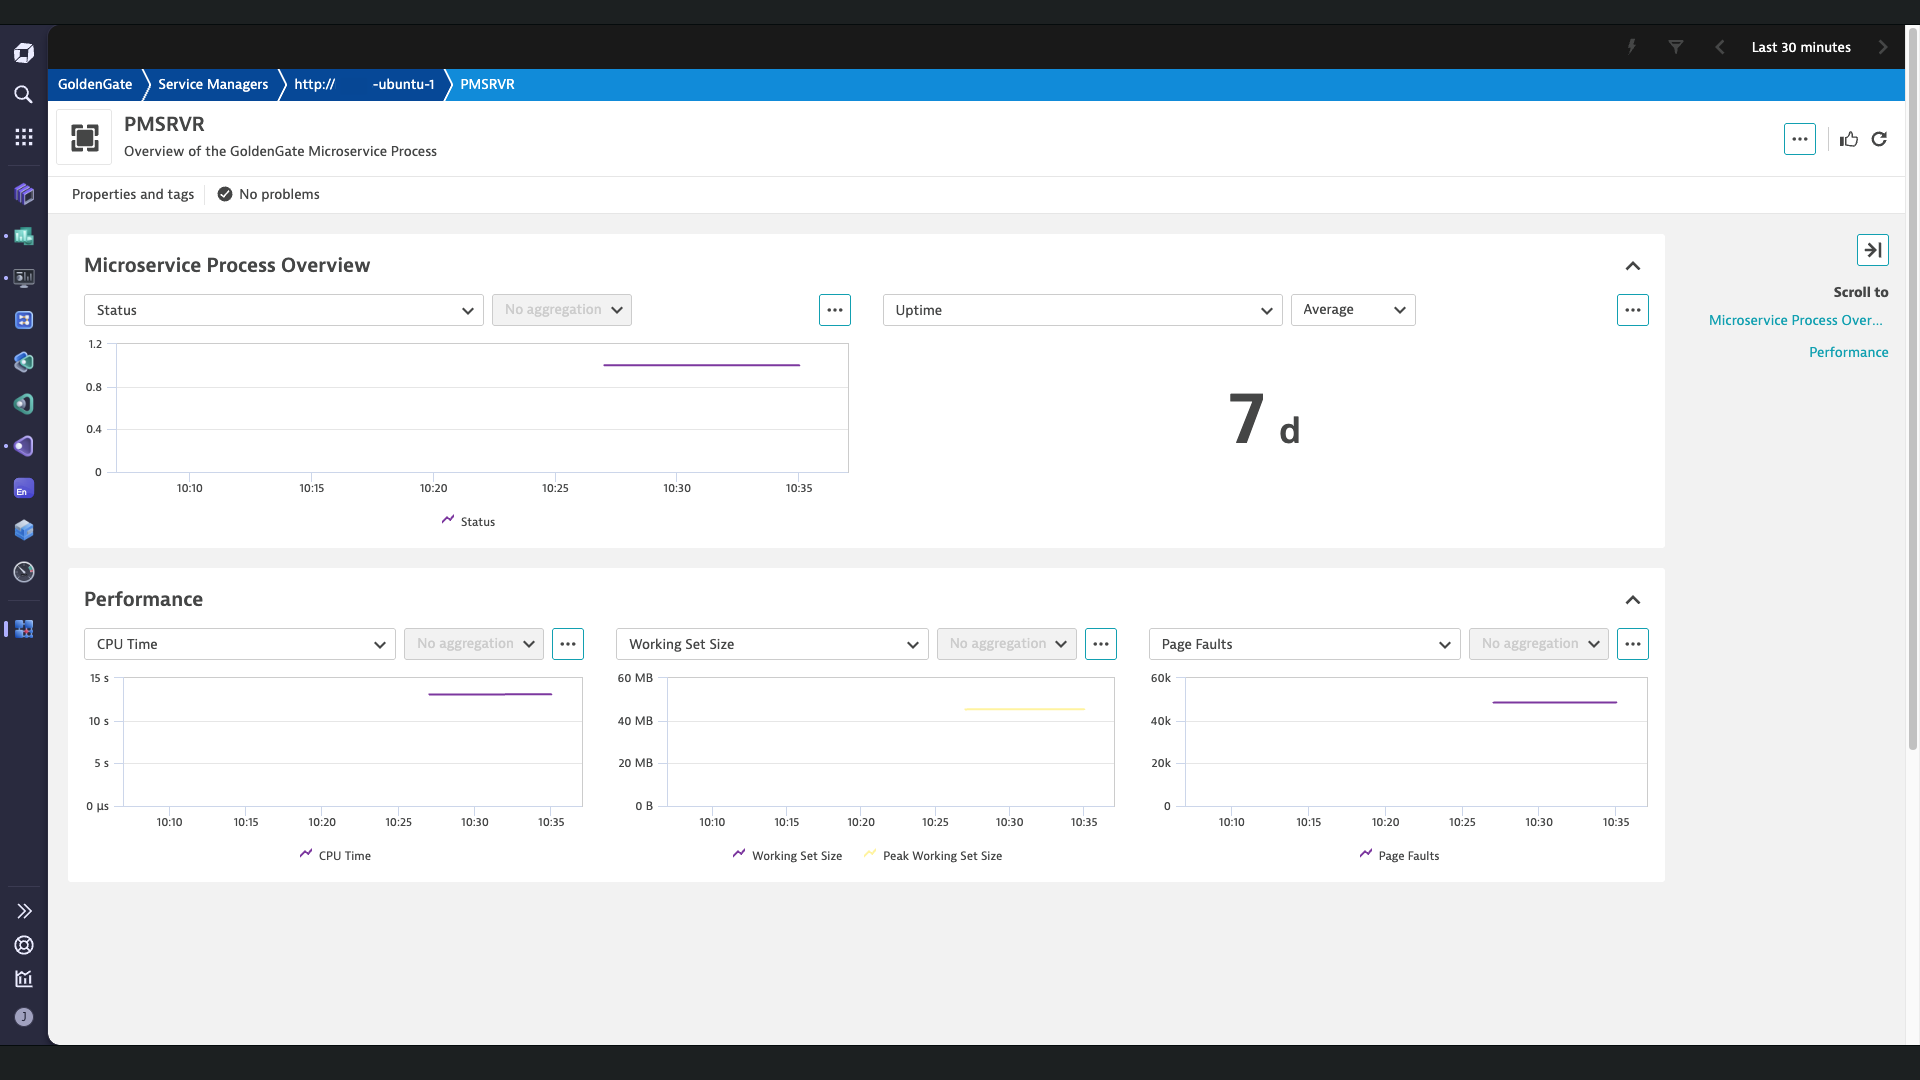
| Status | goldengate.microservice.status | The current status of the microservice process |
| Uptime | goldengate.microservice.uptime | The total uptime of the microservice process in seconds |
Distribution Path
| Metric name | Metric key | Description |
|---|---|---|
| Distribution Path Status | goldengate.distribution_path.status | The current status of the distribution path |
| Distribution Path Lag | goldengate.distribution_path.lag | Distribution path lag as reported by GoldenGate's lag report |
Microservice Performance
| Metric name | Metric key | Description |
|---|---|---|
| CPU Time | goldengate.microservice.cpu_time | The CPU time used by the microservice process in microseconds |
| Working Set Size | goldengate.microservice.working_set_size | The working set size of the microservice process in bytes |
| Peak Working Set Size | goldengate.microservice.peak_working_set_size | The peak working set size of the microservice process in bytes |
| Page Faults | goldengate.microservice.page_faults | The number of page faults incurred by the microservice process |
Extract Replicat
| Metric name | Metric key | Description |
|---|---|---|
| Lag | goldengate.process.lag | Process lag as reported by GoldenGate's lag report |
| Checkpoint Age | goldengate.process.checkpoint_age | The time in seconds since the process last wrote a checkpoint to disk or database |
| Status | goldengate.process.status | The current status of the process |
| Uptime | goldengate.process.uptime | The total uptime of the process in seconds |
default
| Metric name | Metric key | Description |
|---|---|---|
| Service Manager Status | goldengate.service_manager.status | The current status of the service manager |
Trail
| Metric name | Metric key | Description |
|---|---|---|
| Trail Max Size | goldengate.trail.size | The maximum size of the trail in Byte |
| I/O Write Count | goldengate.trail.io_write_counts | Number of I/O write operations to the trail |
| I/O Write Bytes | goldengate.trail.io_write_bytes | Number of I/O write bytes transfered to the trail |
| Sequence | goldengate.trail.trail_sequence | Current Sequence number of the trail |