Oracle Database extension
- Latest Dynatrace
- Extension
Collect Oracle Database metrics and audit logs to monitor performance and security.
Get started
Overview
This remote extension runs on an ActiveGate within your environment. It connects to each Oracle Database you want to monitor, executes a series of queries on various views, and sends the collected data to Dynatrace.
Dynatrace automatically detects all applications and microservices in your system and their Oracle Database usage.
Dynatrace uses AI to diagnose anomalies in real time and identify root causes in slow-performing or erroneous SQL statements. Code-level insights combined with database server monitoring provide full-stack observability.
The Oracle Database extension provides server-side monitoring with availability and performance statistics, SQL statements, and log insights.
Use cases
- Understand all database dependencies of your applications, which statements they execute, and their performance.
- Improve the performance of your application by reducing or optimizing typical database patterns like the 1+N query problem.
- Understand the resource impact that your applications have on your database.
- Understand the impact that resource shortages or other database issues have on your application by observing the database server itself.
- Manage and analyze Oracle Database audit logs to spot invalid login attempts.
- Track the health and performance of Oracle Database servers (either standalone or multi-tenant).
- Track the performance of the most time-consuming queries.
- Speed up application-problem diagnosis when it's caused by the database.
Requirements
- Decide which Oracle Database server to monitor. The extension supports Oracle Database 12.2+ with the following setups:
- Oracle standalone servers
- Oracle Multitenant (CDB/PDB)
- Oracle RAC
- Oracle AWS RDS
- Designate an ActiveGate group or groups that connect to your Oracle Database server to collect data. All ActiveGates in each group must connect to your Oracle Database server.
-
Create a dedicated database user in your database instance with the necessary permissions as described below. Dynatrace uses this user to run monitoring queries against your Oracle database.
-
Authenticate user accounts
Use a dedicated user account for monitoring. You can find user creation scripts on GitHub. These scripts create a user with the
CREATE_SESSIONrole andSELECTpermissions on the following performance views:Performance views
CDB_DATA_FILESCDB_TABLESPACE_USAGE_METRICSCDB_TABLESPACESCDB_TEMP_FILESGV_$ARCHIVE_DESTGV_$ARCHIVE_DEST_STATUSV_$ASM_DISK_STATV_$ASM_DISKGROUP_STATV_$BACKUP_SET_DETAILSGV_$CLUSTER_INTERCONNECTSGV_$CONTAINERSV_$CONTAINERSGV_$CON_SYS_TIME_MODELGV_$CON_SYSSTATGV_$DATABASEV_$DATABASEV_$DATABASE_BLOCK_CORRUPTIONGV_$DATAFILEV_$DATAFILEGV_$DATAGUARD_STATUSGV_$INSTANCEV_$INSTANCEGV_$INSTANCE_PINGGV_$LIBRARYCACHEV_$LOGGV_$METRICGV_$METRICGROUPGV_$PARAMETERGV_$PDBSGV_$PGASTATV_$RECOVER_FILEV_$RECOVERY_FILE_DESTGV_$RESOURCE_LIMITV_$RMAN_BACKUP_JOB_DETAILSGV_$SESSIONV_$SESSIONGV_$SGASTATGV_$SQLV_$SQLGV_$SQLAREAV_$SQL_PLANGV_$SQL_PLANV_$SQL_PLAN_STATISTICS_ALLGV_$SYSSTATGV_$SYSTEM_EVENTGV_$SYSTEM_WAIT_CLASSV_$TABLESPACEV_$TEMPFILE
Alternatively, you can assign the
SELECT_CATALOG_ROLEto the monitoring user.From version
3.9.2+, the extension queries the local IP of each node on RAC setups using theUTL_INADDR.get_host_addressfunction. As such, the following Access Control List permission is required:BEGINDBMS_NETWORK_ACL_ADMIN.create_acl (acl => 'dynatrace.xml',description => 'Allow DNS resolution checks to get RAC node IP addresses',principal => '<DYNATRACE_USER>',is_grant => TRUE,privilege => 'resolve',start_date => SYSTIMESTAMP,end_date => NULL);FOR instance_host IN (SELECT DISTINCT host_nameFROM gv$instance -- Retrieves all RAC node hostnames) LOOPDBMS_NETWORK_ACL_ADMIN.assign_acl (acl => 'dynatrace.xml',host => instance_host.host_name, -- Assign ACL to each instance hostlower_port => NULL,upper_port => NULL);END LOOP;COMMIT;END;/This applies only to RAC databases or other multi-instance setups. The
UTL_INADDR.get_host_addressquery runs only if theracfeature set is enabled. These permissions are already included in the user creation scripts.For multitenant Oracle DB setups, ensure the extension is configured to point to the CDB. PDB discovery and monitoring occur automatically. In this case, explicit permissions to access data across all containers are required:
alter user <your_username> set container_data=all container = current;These privileges are already included in the user creation scripts.
Users of Databases who want to use Query Execution Plans must also provide permission for the
V$SQL_PLAN,V$SESSION,V$SQL_PLAN_STATISTICS_ALL, andV$SQLviews. These permissions are included in the user creation scripts. For more details, see the execution plan monitoring section.
-
Compatibility information
The following Oracle versions are supported:
- Oracle DB 12.2+
The following architectures are supported:
- Oracle standalone servers
- Oracle Multitenant (CDB/PDB)
- Configure monitoring for CDB to detect all PDBs.
- Oracle AWS RDS
- Oracle RAC
- Configure monitoring for the SCAN listener to detect all instances and databases.
Activation and setup
Follow these steps to set up server-side monitoring for Oracle databases.
If your Oracle Database server runs on a virtual machine or bare metal, install OneAgent on it to start collecting system performance metrics.
To monitor Oracle Database server health and performance, activate the Oracle Database extension. The extension queries database performance views to collect metrics and events.
Add DB instance
-
Go to Dynatrace Hub
 .
. -
Select and install Oracle Database extension. This enables the extension in your monitoring environment.
- Required permission: Change monitoring settings
-
Select Add DB Instance in
 Databases. This opens the Add DB Instance wizard.
 -
Select Oracle section in the wizard.
Select hosting type
Select a hosting type from the options. This choice determines which script generates the necessary database objects later in the process.
- From the Add DB Instance wizard, select the host type that matches your requirement.
- Select Next.
Select ActiveGate group
- Select the ActiveGate group to determine which ActiveGates will run the extension.
- Select Next step.
Accept license agreement
The Oracle Database extension requires that you accept the Dynatrace redistribution license agreement for Oracle JDBC Driver.
Create a connection
Set up the connection to your database instance. Provide the required credentials directly in the wizard or use secure alternatives:
- Name the connection, so you can identify it later.
- Add the details in the Configure connection section.
- Select connection. Use Select from existing hosts or Enter manually to add connection details.
- Add Database identifier, either Service Name or SID.
- Add Service name.
- Provide the Authenticate credentials for the
dynatracemonitoring user you have created directly or use secure alternatives.- Basic credentials: Dynatrace masks the authentication details you provide to prevent them from being retrieved.
- Credential vault: Use vault credentials to securely store and retrieve database credentials.
- Optionally, enable SSL to establish a secure connection for your configuration, including truststore setup.
- Select Next.
Install instance
- Add manual configurations based on the monitoring requirements.
- Select Create DB instance monitoring.
Get started for Oracle Database clients
Follow these steps to set up client-side monitoring for Oracle databases.
-
If the application connecting to the Oracle Database server runs on a virtual machine or bare metal, install OneAgent on that machine to get started.
-
If the application that connects to the Oracle Database server runs as a workload in Kubernetes or OpenShift, set up Dynatrace on Kubernetes or OpenShift.
-
If the application runs as a workload in Kubernetes, set up Dynatrace on Kubernetes.
Activate the following OneAgent features to gain full tracing insights:
- Node.js Oracle DB
- PHP Oracle
Activate log monitoring
Activate log monitoring to get full log insight.
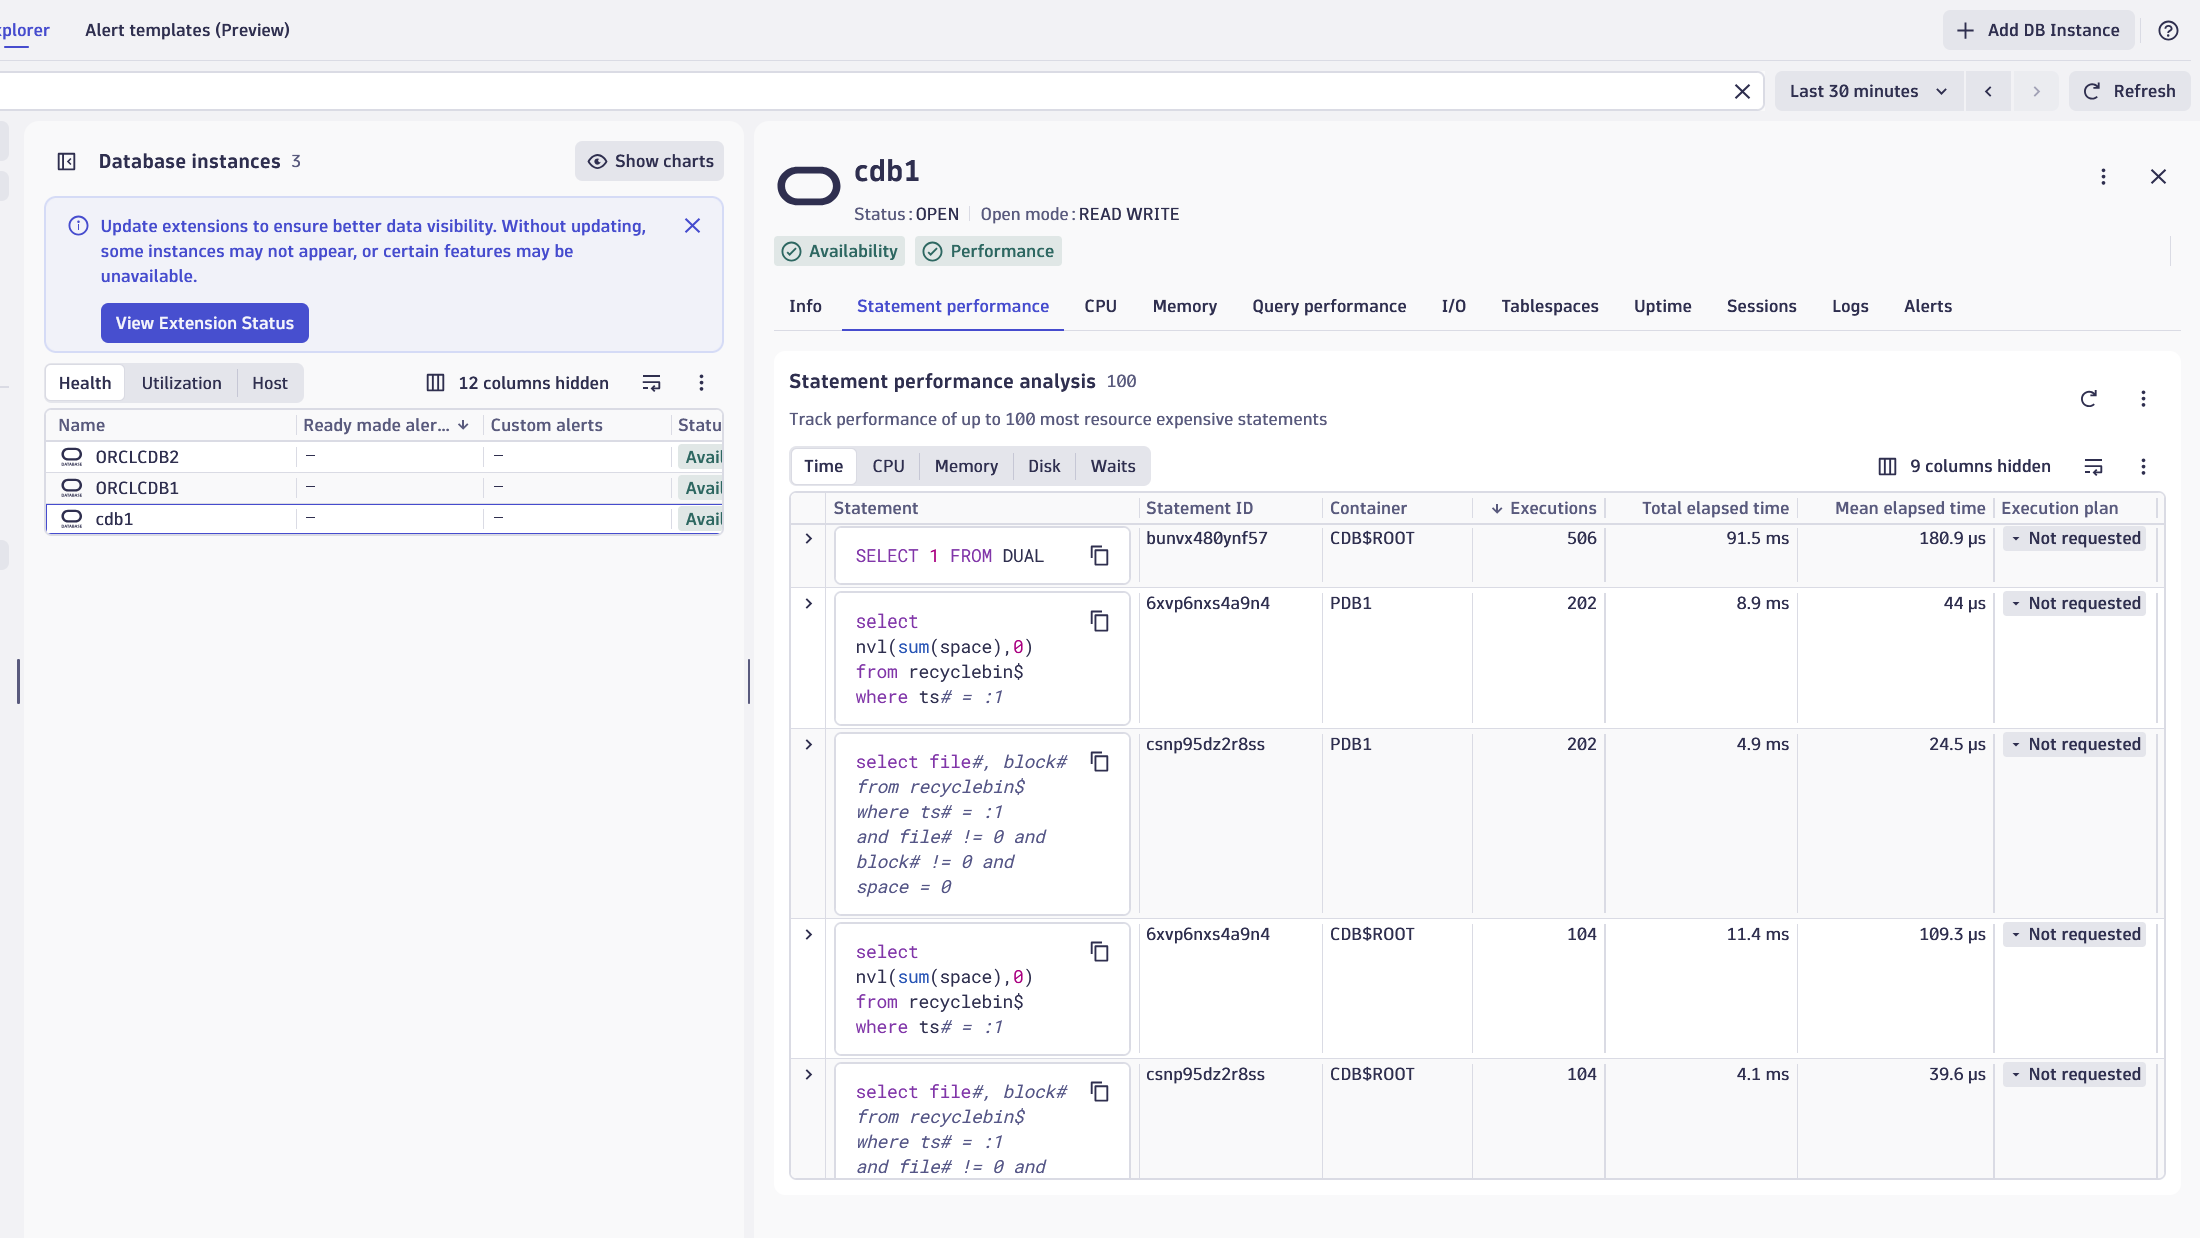
With the TopN feature set, the extension reports the most time-consuming queries on the Oracle Instance entity page, in a Logs card. Enabling this feature may expose sensitive data in the reported queries.
Details
Extension package
This extension package contains:
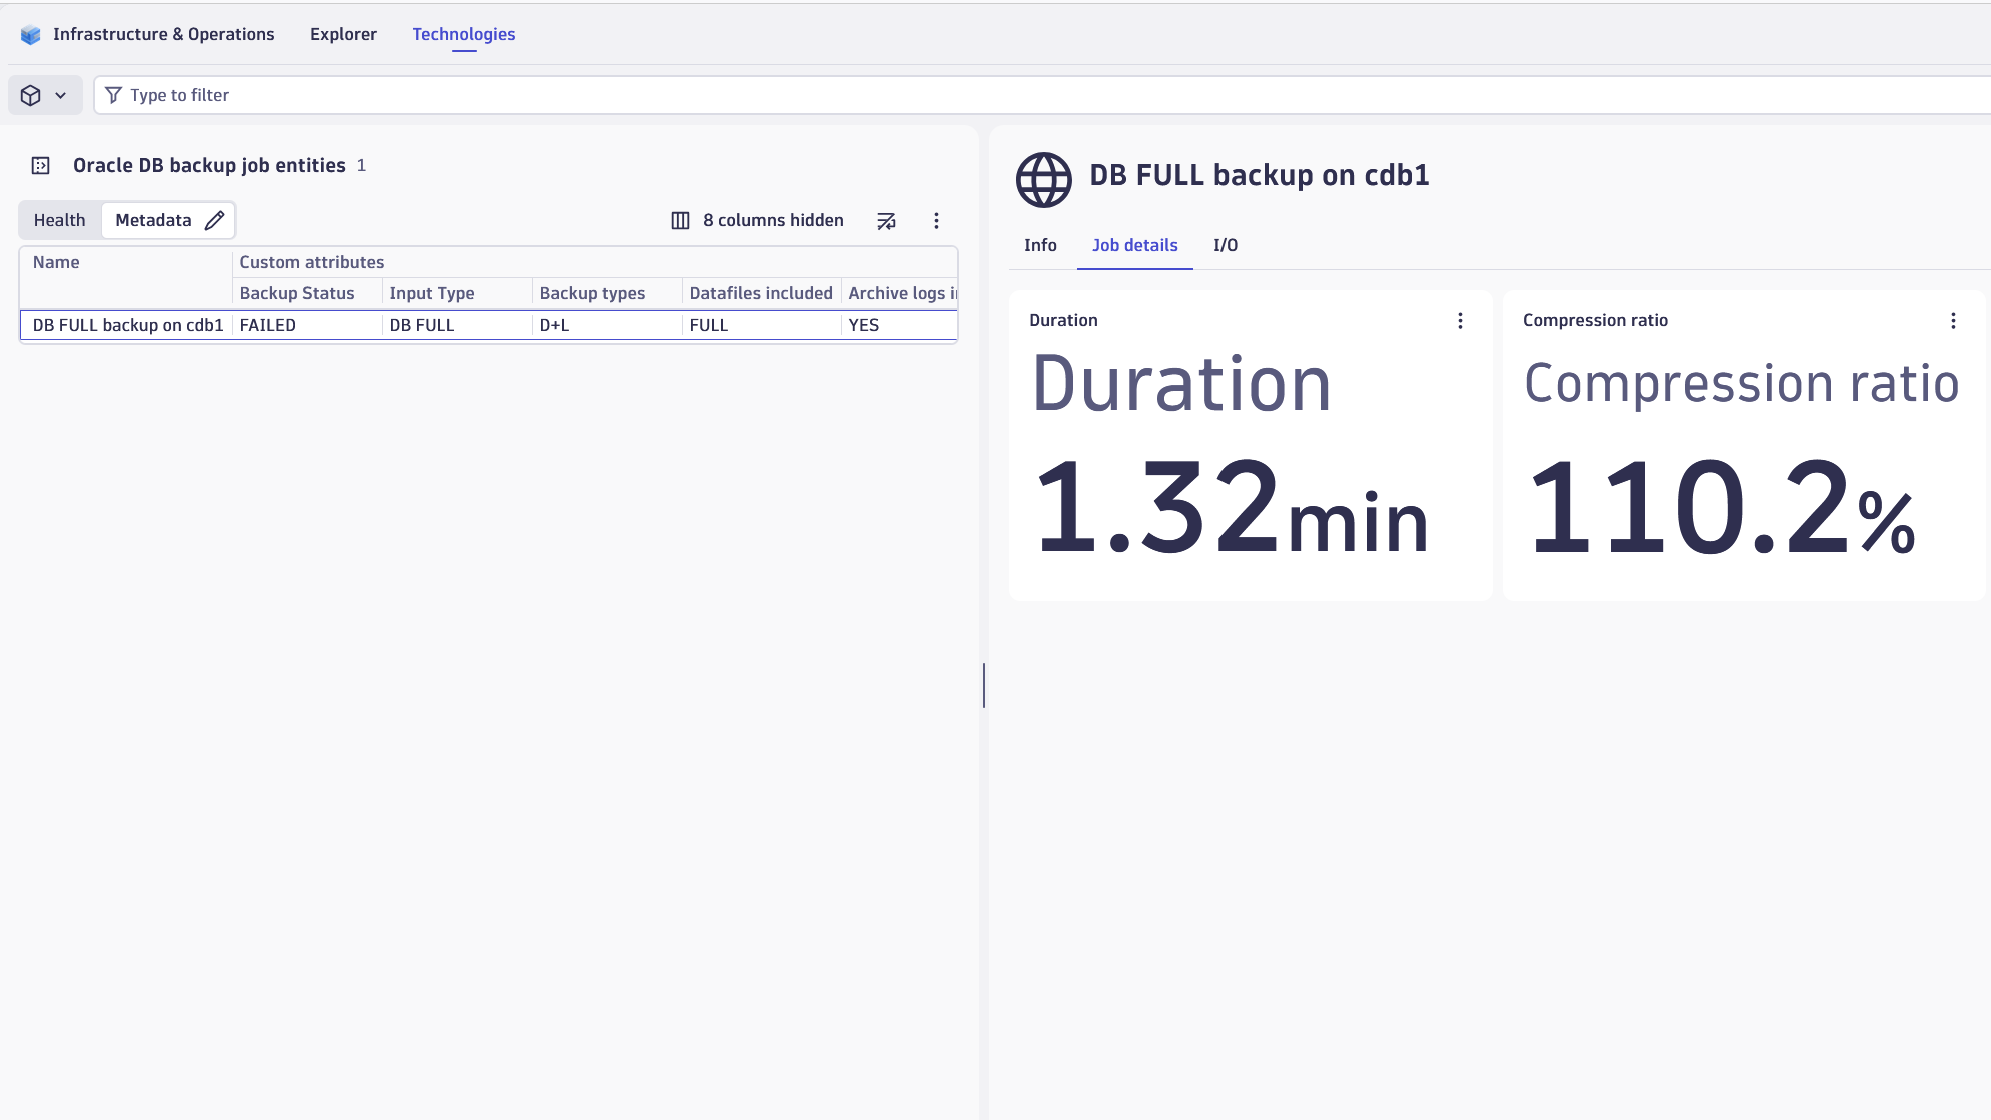
- Topology and relationship definitions for RAC Clusters, Backup Jobs, Databases, Instances, ASM Disks, and ASM Disk Groups.
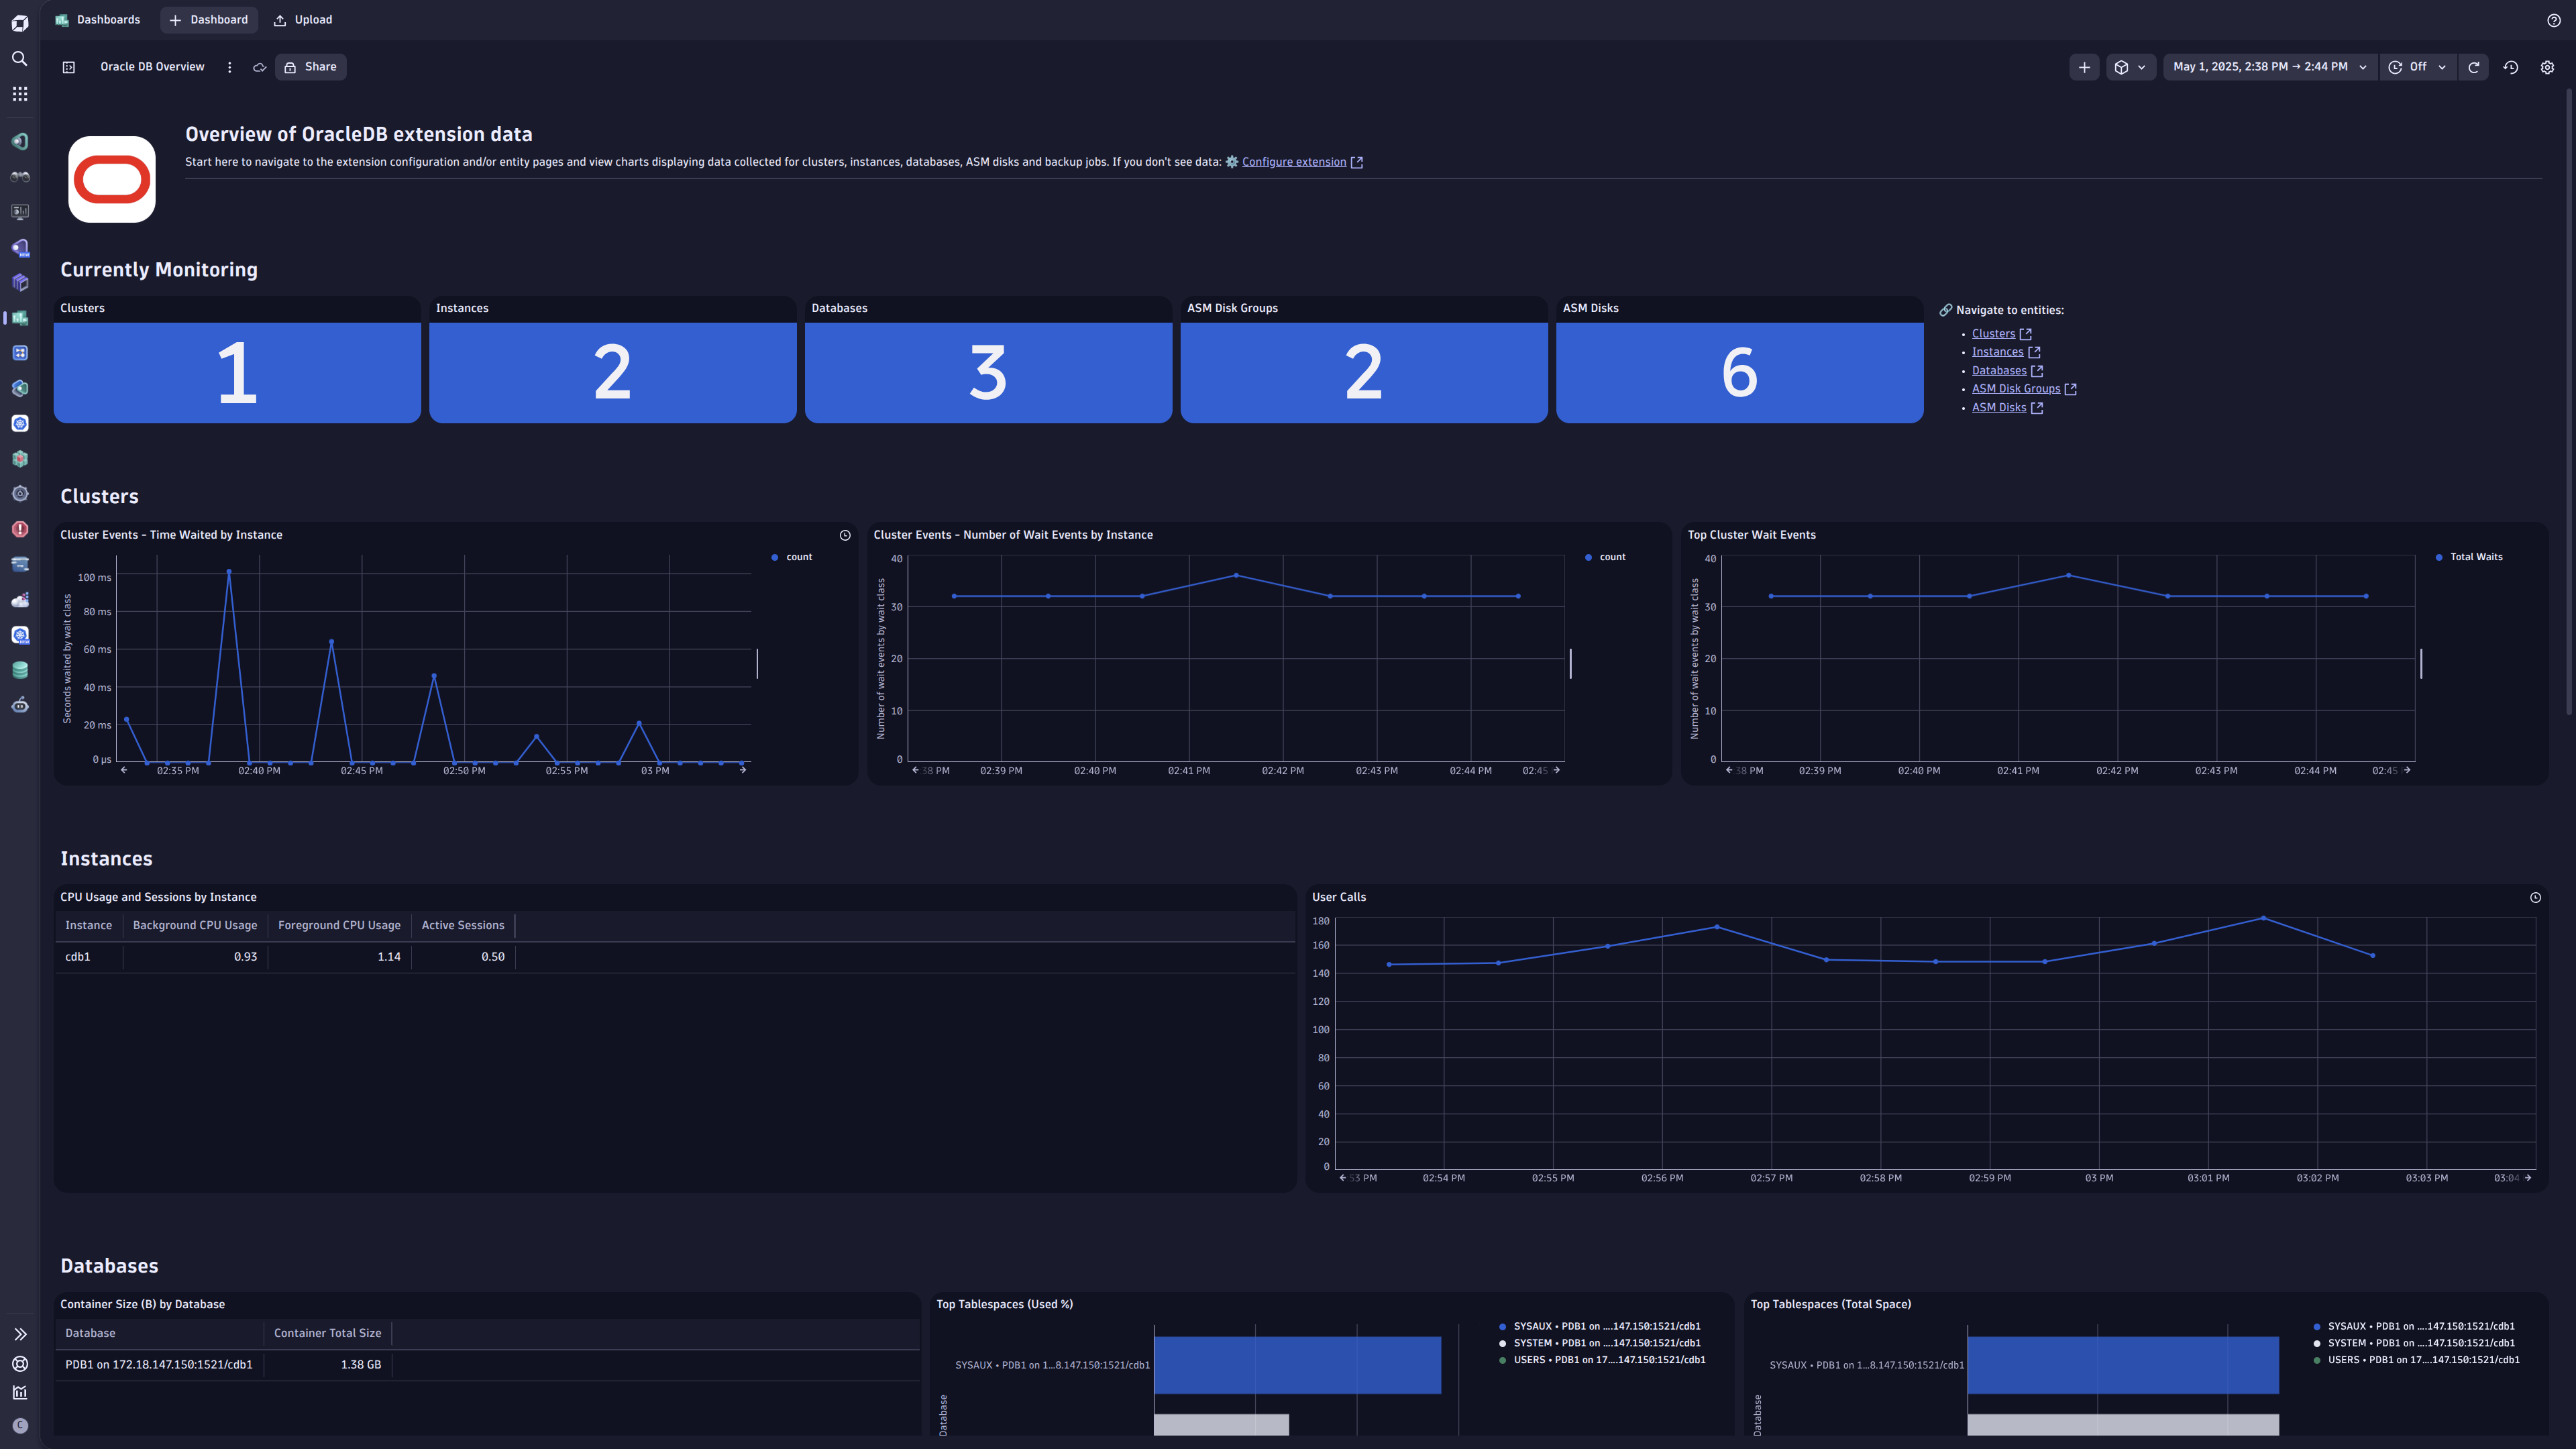
- Classic and New Dashboard offering a monitoring overview for the Oracle Database environment.
- Alerts for failed backups, unavailable PDBs, unavailable instances, high tablespace usage, and more.
- Unified Analysis page for the above-mentioned topology.
Licensing and costs
There is no charge for obtaining the extension, only for the data (metrics and logs) that the extension ingests. The details of license consumption depend on which licensing model you are using: either Dynatrace classic licensing or the Dynatrace Platform Subscription (DPS) model.
Dynatrace Platform Subscription
With a Dynatrace Platform Subscription (DPS) license:
-
For metrics, license consumption is based on the number of metric data points ingested. This is billed as Metrics powered by Grail.
The following formula provides the approximate annual data points ingested assuming all feature sets are enabled. Actual ingested metric data point volumes depend heavily on your specific Oracle Database environment.
((55 * number of instances)+ (7 * number of databases)+ (5 * number of ASM disks)+ (3 * number of ASM disk groups))* 60 minutes * 24 hours * 365 days data points per year+ (8 * 5 * number of backup jobs per year) -
For logs, regular consumption for Log Analytics applies, see Log Analytics overview (DPS).
Classic licensing
With a Dynatrace classic license:
-
For metrics, metric ingestion consumes Davis Data Units (DDUs) at the rate of .001 DDUs per metric data point. Multiply the above formula for annual data points by .001 to estimate annual DDU usage.
-
For logs, regular DDU consumption for log monitoring applies. Depending on your licensing model, refer either to DDU consumption for Log Management and Analytics or DDUs for Log Monitoring Classic.
Execution plan monitoring
For SaaS customers with access to  Database Services Classic, the execution plan monitoring functionality is also available when analyzing statement performance.
For this feature to work, the DBMS_XPLAN package must be available, and the monitoring user must have permission to call the DISPLAY_CURSOR function. Per the official documentation, SELECT or READ permissions are required on the following views:
V$SQL_PLANV$SESSIONV$SQL_PLAN_STATISTICS_ALLV$SQL
Sensitive data masking
Query performance tracking may expose sensitive data in reported statements. Dynatrace provides an optional mechanism to mask selected attributes. For details, see Log processing examples.
The following configurations show how to mask sensitive data in tracked statements:
-
Create a new processing rule under Settings > Log Monitoring > Processing.
-
Processor definition:
USING(INOUT content) | FIELDS_ADD(content: REPLACE_PATTERN(content, "(\"'\"):p1 (LD):p2 (\"'\"):p3", "${p1}${p2|sha1}${p3}")) -
Alternatively, create/modify your custom extension to distribute such rules across your environment.
logProcessingRules:- ruleName: TopN statements maskingquery: event.group="query_performance"enabled: trueProcessorDefinition:rule: |USING(INOUT content) | FIELDS_ADD(content: REPLACE_PATTERN(content, "(\"'\"):p1 (LD):p2 (\"'\"):p3", "${p1}${p2|sha1}${p3}"))RuleTesting:sampleLog: |{"event.group": "query_performance","content": "/*dt:ownQuery*/SELECT DECODE(name, 'sessions', value) AS sessions_limit, DECODE(name, 'processes', value) AS processes_limit FROM v$parameter WHERE name IN('sessions', 'processes')"}
Licensing and costs
There is no charge to use the extension. You are only charged for the data that the extension ingests.
The Oracle Database extension ingests custom metrics, which consume Davis Data Units (DDUs) (Dynatrace classic license) or Metrics powered by Grail (DPS), according to your license model.
The following formula approximates the number of metric data points produced per minute, assuming all feature sets are enabled. Actual ingested metric data point volumes depend heavily on your specific Oracle Database environment.
(55 * number of instances)+ (7 * number of databases)+ (5 * number of ASM disks)+ (3 * number of ASM disk groups)+ (8 * data points per backup jobs run, calculated on a per-minute basis)
Because backup jobs run daily or weekly, you'll need to adapt this to a per-minute basis.
Dynatrace Platform Subscription
In the Dynatrace Platform Subscription, metric ingestion consumes Metrics powered by Grail according to the number of ingested metric data points.
To calculate the approximate yearly consumption, apply the following calculation: <metric data points per minute> * 60 minutes * 24 hours * 365 days.
For logs, regular consumption applies. See Log Analytics.
Dynatrace classic license
In the classic licensing model, metric ingestion consumes Davis Data Units (DDUs) at the rate of .001 DDUs per metric data point. Multiply the above formula for annual data points by .001 to estimate annual DDU usage.
For logs, regular DDU consumption applies. See DDU consumption for Log Management and Analytics or DDUs for Log Monitoring Classic.
The DDU cost above does not include any possible log events or custom events that are triggered by the extension. For more information, see DDU events.
DQL and logs
Audit log files tracking
Check log file's location
SELECT name, value FROM v$parameter WHERE name = 'audit_trail';OSmeans that the audit logs are stored locally on the file system.SELECT value FROM v$parameter WHERE name = 'audit_file_dest';Specifies the log file's location.
Add OneAgent Log module security rules
Configure OneAgent Log module security rules to allow access to local files by adding the oracle.json file:
- on Linux/UNIX:
/var/lib/dynatrace/oneagent/agent/config/logmodule - on Windows:
%PROGRAMDATA%\dynatrace\oneagent\agent\config\logmodule
{"@version": "1.0.0","allowed-log-paths-configuration": [{"directory-pattern": "/u01/app/oracle/admin/oracle_standalone/adump/","file-pattern": "*.aud","action": "INCLUDE"}]}
No OneAgent restart is required. The configuration takes effect within 1 minute.
Configure custom log source and log ingest rules
Custom log source
Use the log file location from the first query, for example, /u01/app/oracle/admin/oracle_standalone/adump/*.
Log ingest rules
To capture only ORA-01017 (invalid username or password login attempts), configure the log ingest rule as follows:
Log content is any of: (.*)RETURNCODE:\[(\d+)\] "1017 AND Log source is any of:/u01/app/oracle/admin/oracle_standalone/adump/*
Accessing logs
Access the collected logs using the following DQL query:
fetch logs| filter matchesValue(log.source, "/u01/app/oracle/admin/oracle_standalone/adump/*")
Metrics extraction
Log processing rule
Configure the log processing rule to extract log attributes from the log content:
- Rule name: preferred name
- Matcher:
matchesValue(log.source, "/u01/app/oracle/admin/oracle_standalone/adump/*") - Processor definition:
PARSE(content, "DATA ' RETURNCODE:['INT']' SPACE '\"' INT:ora.returncode LD") |PARSE(content, "DATA ' USERID:['INT']'SPACE CSVDQS:ora.userid LD") |PARSE(content, "DATA ' USERHOST:['INT']'SPACE CSVDQS:ora.userhost LD")
Metric extraction
Extract metrics from log entries to enable alerting:
- Metric key: for example,
log.oracle.invalid_credentials - Matcher:
matchesValue(log.source, "/u01/app/oracle/admin/oracle_standalone/adump/*") - Metric measurement:
Occurrence of logs records - Dimensions: specify the log attributes to be used as metric dimensions
Feature sets
When activating your extension using a monitoring configuration, you can limit monitoring to one of the feature sets. To work properly, the extension has to collect at least one metric after the activation.
In highly segmented networks, feature sets can reflect the segments of your environment. Then, when you create a monitoring configuration, you can select a feature set and a corresponding ActiveGate group that can connect to this particular segment.
All metrics that aren't categorized into any feature set are considered to be the default and are always reported.
A metric inherits the feature set of a subgroup, which in turn inherits the feature set of a group. Also, the feature set defined on the metric level overrides the feature set defined on the subgroup level, which in turn overrides the feature set defined on the group level.
Blocked sessions
| Metric name | Metric key | Description |
|---|
tablespaces (detailed)
| Metric name | Metric key | Description |
|---|---|---|
| Total size | com.dynatrace.extension.sql-oracle.tablespaces.totalSpace | Total size of tablespace, including extensibility. This covers both allocated an unallocated space as large as the tablespace can expand. |
| Free space | com.dynatrace.extension.sql-oracle.tablespaces.freeSpace | Total free space available in the tablespace, in bytes. This includes space that is currently allocated and available for reuse and space that is currently unallocated. |
| Used space | com.dynatrace.extension.sql-oracle.tablespaces.usedSpace | Total space in use within the tablespace, in bytes. |
| Allocated space | com.dynatrace.extension.sql-oracle.tablespaces.allocatedSpace | Total space in use within the tablespace, in bytes. |
| Tablespace usage | com.dynatrace.extension.sql-oracle.tablespaces.usage | The percentage of tablespace in use, relative to the total size (including extensibility). |
Data guard
| Metric name | Metric key | Description |
|---|---|---|
| Dataguard severe events | com.dynatrace.extension.sql-oracle.dataguard.severeEvents | Counts the number of fatal and severe Data guard events occurred in the last day. If this count is greater than 0, check its dimensions to take action for the specific events. |
| NOLOGGING activity | com.dynatrace.extension.sql-oracle.dataguard.nologgingActivity | Counts the number of files which contain NOLOGGING activity in the last day. If the count is greater than 0 then the standby database is vulnerable; check the dimensions to find out which files must be refreshed on the standby. |
| Archive destination status | com.dynatrace.extension.sql-oracle.dataguard.archiveDestErrStatus | Counts the number of invalid or errored statuses of archive destinations. If the count is greater than 0, use the dimensions to understand the status and destination it refers to. |
| Seq. difference | com.dynatrace.extension.sql-oracle.dataguard.seqDifference | Tracks the difference in sequence number between the latest archived and applied redo log. Use this count along with the dimensions to identify gaps between the primary and archive destination. |
io
| Metric name | Metric key | Description |
|---|---|---|
| Physical bytes read | com.dynatrace.extension.sql-oracle.io.bytesRead.count | Total size in bytes of disk reads by all database instance activity including application reads, backup, recovery, and other utilities |
| Physical bytes written | com.dynatrace.extension.sql-oracle.io.bytesWritten.count | Total size in bytes of all disk writes for the database instance including application activity, backup, recovery, and other utilities |
| Total wait time | com.dynatrace.extension.sql-oracle.io.wait.count | Total time spent in all wait states except for Idle class |
waitEvents
| Metric name | Metric key | Description |
|---|---|---|
| Number of wait events by wait class | com.dynatrace.extension.sql-oracle.wait.count | Total number of waits by wait class, excluding 'Idle' events |
| Seconds waited by wait class | com.dynatrace.extension.sql-oracle.wait.time.count | Total amount of time waited by wait class, excluding 'Idle' events |
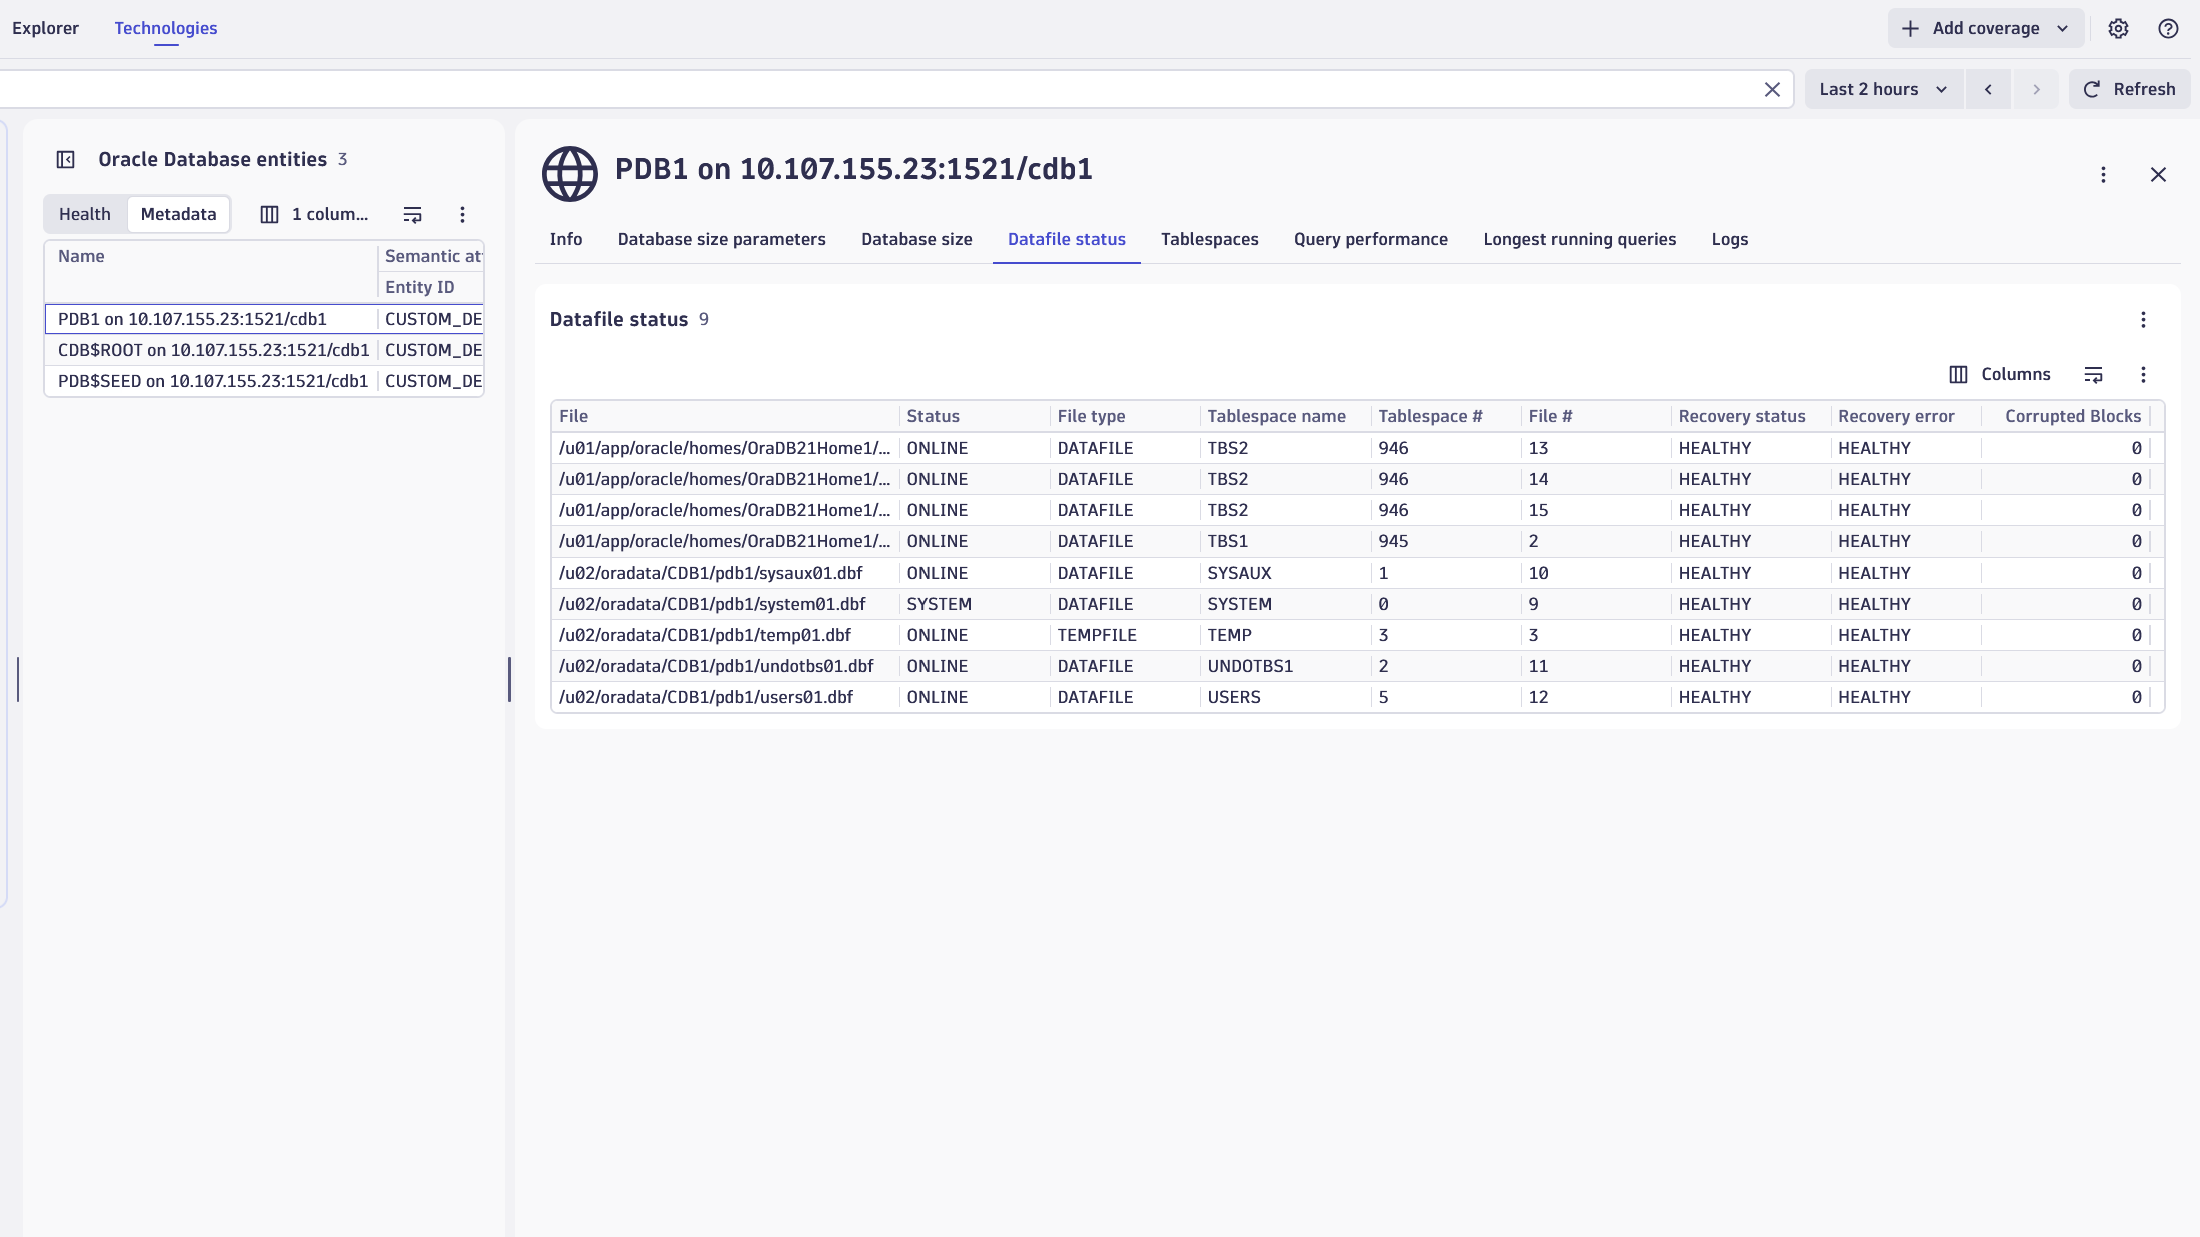
Datafiles
| Metric name | Metric key | Description |
|---|---|---|
| Datafile status | com.dynatrace.extension.sql-oracle.datafile.status | State metric representing the status of Datafiles and Tempfiles across containers (database and any PDBs). |
| Datafile number of corrupted blocks | com.dynatrace.extension.sql-oracle.datafile.corrupted_blocks | Metric representing the number of corrupted blocks reported by V$DATABASE_BLOCK_CORRUPTION for each Datafile |
TopN
| Metric name | Metric key | Description |
|---|
asm (detailed)
| Metric name | Metric key | Description |
|---|---|---|
| Free space | com.dynatrace.extension.sql-oracle.asm.disk.free_mb | Free disk space available on this Oracle ASM Disk |
| Total space | com.dynatrace.extension.sql-oracle.asm.disk.total_mb | Total disk space available on this Oracle ASM Disk |
| Used space | com.dynatrace.extension.sql-oracle.asm.disk.usage | Percentage of disk space used on this Oracle ASM Disk |
| Reads | com.dynatrace.extension.sql-oracle.asm.disk.reads.count | Number of reads from this Oracle ASM Disk |
| Writes | com.dynatrace.extension.sql-oracle.asm.disk.writes.count | Number of writes to this Oracle ASM Disk |
default
| Metric name | Metric key | Description |
|---|---|---|
| Cluster topology | com.dynatrace.extension.sql-oracle.cluster_topology | A state metric whose dimensions represent all Oracle clusters and their linked instances and hosts |
| Database topology | com.dynatrace.extension.sql-oracle.database_topology | A state metric whose dimensions represent all Oracle instances and their linked databases |
| Instance status | com.dynatrace.extension.sql-oracle.status | A state metric representing the details of the connected Oracle instance. |
| Instance Uptime | com.dynatrace.extension.sql-oracle.uptime | The uptime of the Oracle instance in seconds. |
| Database status | com.dynatrace.extension.sql-oracle.db_status | A state metric representing details of the connected Oracle database. |
rac
| Metric name | Metric key | Description |
|---|---|---|
| Instance ping | com.dynatrace.extension.sql-oracle.rac.instance_ping | Represents the current inter-instance ping of 8K messages as provided in GV$INSTANCE_PING. |
| — | com.dynatrace.extension.sql-oracle.rac.interconnects | — |
tablespaces
| Metric name | Metric key | Description |
|---|---|---|
| Total size | com.dynatrace.extension.sql-oracle.tablespaces.totalSpace | Total size of tablespace, including extensibility. This covers both allocated an unallocated space as large as the tablespace can expand. |
| Free space | com.dynatrace.extension.sql-oracle.tablespaces.freeSpace | Total free space available in the tablespace, in bytes. This includes space that is currently allocated and available for reuse and space that is currently unallocated. |
| Used space | com.dynatrace.extension.sql-oracle.tablespaces.usedSpace | Total space in use within the tablespace, in bytes. |
| Tablespace usage | com.dynatrace.extension.sql-oracle.tablespaces.usage | The percentage of tablespace in use, relative to the total size (including extensibility). |
waitEvents (detailed)
| Metric name | Metric key | Description |
|---|---|---|
| Number of wait events | com.dynatrace.extension.sql-oracle.wait.events.count | Total number of waits by wait event, excluding 'Idle' events. Only collects the top 20 most time consuming events. |
| Seconds waited | com.dynatrace.extension.sql-oracle.wait.events.time.count | Total amount of time waited by wait event, excluding 'Idle' events. Only collects the top 20 most time consuming events. |
queryPerformance
| Metric name | Metric key | Description |
|---|---|---|
| Connection management time | com.dynatrace.extension.sql-oracle.queries.connectionManagement.count | Time spent on performing session connect and disconnect calls |
| PL SQL exec time | com.dynatrace.extension.sql-oracle.queries.plSqlExec.count | Time spent on running the PL/SQL interpreter |
| SQL exec time | com.dynatrace.extension.sql-oracle.queries.sqlExec.count | Time spent on executing SQL |
| SQL parse time | com.dynatrace.extension.sql-oracle.queries.sqlParse.count | Time spent on parsing SQL |
| DB Time | com.dynatrace.extension.sql-oracle.queries.dbTime.count | Time spent on performing Database user-level calls |
| DB CPU | com.dynatrace.extension.sql-oracle.queries.cpuTime.count | CPU time spent on performing database user-level calls |
cpu
| Metric name | Metric key | Description |
|---|---|---|
| CPU cores | com.dynatrace.extension.sql-oracle.cpu.cores | Number of CPU cores |
| Background CPU usage (per second) | com.dynatrace.extension.sql-oracle.cpu.backgroundTotal | CPU usage of background processes in centi seconds per second |
| Foreground CPU usage (per second) | com.dynatrace.extension.sql-oracle.cpu.foregroundTotal | CPU usage of foreground processes in centi seconds per second |
FRA
| Metric name | Metric key | Description |
|---|---|---|
| FRA Usage | com.dynatrace.extension.sql-oracle.fra.usage | The percentage disk utilization in the fast recovery area. |
| FRA limit | com.dynatrace.extension.sql-oracle.fra.limit | Maximum amount of disk space (in bytes) that the database can use for the fast recovery area. This is the value specified in the DB_RECOVERY_FILE_DEST_SIZE initialization parameter. |
| FRA used | com.dynatrace.extension.sql-oracle.fra.used | Amount of disk space (in bytes) used by fast recovery area files created in current and all previous fast recovery areas. Changing fast recovery areas does not reset SPACE_USED to 0. |
| FRA reclaimable | com.dynatrace.extension.sql-oracle.fra.reclaimable | Total amount of disk space (in bytes) that can be created by deleting obsolete, redundant, and other low priority files from the fast recovery area |
sessions
| Metric name | Metric key | Description |
|---|---|---|
| Active Sessions | com.dynatrace.extension.sql-oracle.sessions.active | Active sessions count |
| Blocked Sessions | com.dynatrace.extension.sql-oracle.sessions.blocked | Blocked sessions count |
| Total sessions | com.dynatrace.extension.sql-oracle.sessions.all | Total sessions count |
| User calls | com.dynatrace.extension.sql-oracle.sessions.userCalls.count | Total number of logins, parses, or execute calls |
| Deadlocks | com.dynatrace.extension.sql-oracle.sessions.deadlocks.count | Total number deadlocks |
limits
| Metric name | Metric key | Description |
|---|---|---|
| Sessions utilization | com.dynatrace.extension.sql-oracle.limits.sessions_utilization | Utilization of sessions on the instance. This is a percentage of current utilization relative to the limit. |
| Processes utilization | com.dynatrace.extension.sql-oracle.limits.processes_utilization | Utilization of processes on the instance. This is a percentage of current utilization relative to the limit. |
memory
| Metric name | Metric key | Description |
|---|---|---|
| PGA aggregate limit | com.dynatrace.extension.sql-oracle.memory.pga.size.pgaAggregateLimit | Limit on the aggregate PGA memory consumed by the instance |
| PGA aggregate target | com.dynatrace.extension.sql-oracle.memory.pga.size.pgaAggregateTarget | Target aggregate PGA memory available to all server processes attached to the instance |
| PGA memory used | com.dynatrace.extension.sql-oracle.memory.pga.used | PGA memory consumed by work areas |
| Allocated PGA | com.dynatrace.extension.sql-oracle.memory.pga.allocated | Current amount of PGA memory allocated by the instance |
| Shared pool free | com.dynatrace.extension.sql-oracle.memory.sga.cacheBuffer.sharedPoolFree | Amount of free system global area (SGA) memory available in shared pool |
| Redo log space wait time | com.dynatrace.extension.sql-oracle.memory.sga.redoBuffer.redoLogSpaceWaitTime.count | Total elapsed time of waiting for redo log space request |
| Redo size increase | com.dynatrace.extension.sql-oracle.memory.sga.redoBuffer.redoSizeIncrease.count | Total amount of redo generated in bytes |
| Redo write time | com.dynatrace.extension.sql-oracle.memory.sga.redoBuffer.redoWriteTime.count | Total elapsed time of the write from the redo log buffer to the current redo log file |
| Logical reads | com.dynatrace.extension.sql-oracle.memory.sessionLogicalReads.count | The sum of "db block gets" plus "consistent gets" |
| Physical reads | com.dynatrace.extension.sql-oracle.memory.physicalReads.count | Total number of data blocks read from disk |
| Physical reads direct | com.dynatrace.extension.sql-oracle.memory.physicalReadsDirect.count | Number of reads directly from disk, bypassing the buffer cache |
| Sorts in memory | com.dynatrace.extension.sql-oracle.memory.memorySorts.count | Number of sort operations that were performed completely in memory and did not require any disk writes |
| Sorts on disk | com.dynatrace.extension.sql-oracle.memory.diskSorts.count | Number of sort operations that required at least one disk write |
| DB Block gets from cache | com.dynatrace.extension.sql-oracle.memory.dbBlockGetsFromCache.count | Number of times a consistent read was requested for a block from the buffer cache. |
| Consistent gets from cache | com.dynatrace.extension.sql-oracle.memory.consistentGetsFromCache.count | Number of times a CURRENT block was requested from the buffer cache. |
| Physical reads into cache | com.dynatrace.extension.sql-oracle.memory.physicalReadsCache.count | Total number of data blocks read from disk into buffer cache. |
| Library cache hit ratio | com.dynatrace.extension.sql-oracle.memory.libraryCacheHitRatio | Library cache hit ratio |
backupJob
| Metric name | Metric key | Description |
|---|---|---|
| Input bytes | com.dynatrace.extension.sql-oracle.backup-input_bytes | Sum of all input file sizes backed up. |
| Output bytes | com.dynatrace.extension.sql-oracle.backup-output_bytes | Output size of all pieces generated. |
| Elapsed seconds | com.dynatrace.extension.sql-oracle.backup-elapsed_seconds | Number of elapsed seconds. |
| Compression ratio | com.dynatrace.extension.sql-oracle.backup-compression_ratio | Compression ratio. |
| Input bytes per second | com.dynatrace.extension.sql-oracle.backup-input_bytes_per_second | Input read-rate-per-second. |
| Output bytes per second | com.dynatrace.extension.sql-oracle.backup-output_bytes_per_second | Output write-rate-per-second. |
| Auto - backup count | com.dynatrace.extension.sql-oracle.backup-autobackup_count_number | Number of autobackups performed by this job. |
| Backup state | com.dynatrace.extension.sql-oracle.backup.state | A state metric representing the details of a Backup Job. |
| Time since last backup | com.dynatrace.extension.sql-oracle.backup.time_since | The time elapsed since the last backup completed successfully. |
asm
| Metric name | Metric key | Description |
|---|---|---|
| Free space | com.dynatrace.extension.sql-oracle.asm.disk_group.free_mb | Free disk space available on this Oracle ASM Disk Group |
| Total space | com.dynatrace.extension.sql-oracle.asm.disk_group.total_mb | Total disk space available on this Oracle ASM Disk Group |
| Used space | com.dynatrace.extension.sql-oracle.asm.disk_group.usage | Percentage of disk space used on this Oracle ASM Disk Group |
multitenancy
| Metric name | Metric key | Description |
|---|---|---|
| Total size | com.dynatrace.extension.sql-oracle.pdb-total_size | Shows the disk space (in bytes) used by the PDB, including both data and temp files. |
| Block size | com.dynatrace.extension.sql-oracle.pdb-block_size | The current block size for the PDB |
| Diagnostic size | com.dynatrace.extension.sql-oracle.pdb-diagnostic_size | Shows the current disk space usage (in bytes) of the diagnostic traces generated in the PDB. |
| Audit files size | com.dynatrace.extension.sql-oracle.pdb-audit_files_size | Shows the current disk space usage (in bytes) by Unified Audit files (.bin format) in the current PDB. |
| Max size | com.dynatrace.extension.sql-oracle.pdb-max_size | Shows the maximum amount of disk space (in bytes) that can be used by data and temp files in the PDB. If the value is 0 then there is no limit. |
| Max diagnostic size | com.dynatrace.extension.sql-oracle.pdb-max_diagnostic_size | Shows the maximum amount of disk space (in bytes) that can be used by diagnostic traces generated in the PDB. If the value is 0 then there is no limit. |
| Max audit size | com.dynatrace.extension.sql-oracle.pdb-max_audit_size | Shows the maximum amount of disk space (in bytes) that can be used by Unified Audit files (.bin format) in the PDB. If the value is 0 then there is no limit. |
FAQ
How does this Dynatrace extension collect data from my databases?
This extension runs on your Dynatrace ActiveGates and connects to the configured databases. Once the connection is established, the extension regularly runs queries on the database to gather performance and health metrics, reporting the results back to Dynatrace.
The extension executes only SELECT queries to collect data, and most of these target GV$ or V$ views. To see exactly which queries are executed, download the extension yaml artifact by going to Release notes, opening a release and pressing the Download version button.
How often are these monitoring queries executed?
From version 3.2.0, the query-interval and heavy-query-interval configuration variables control query execution frequency. Most queries run every query-interval minutes (default: 1 minute), while the queries under
asm (detailed)tablespacestablespaces (detailed)Blocked sessionsTopN
run every heavy-query-interval minutes (default: 5 minutes).
For older versions, most queries run every minute, with exceptions for the heavy queries mentioned above, which run every 5 minutes.
How do I adjust query timeout?
By default, the extension's monitoring queries time out after 10 seconds. For queries in the following feature sets, the long-running-query-timeout variable lets you specify a custom timeout in seconds:
asm (detailed)tablespacestablespaces (detailed)TopN
What is the difference between Feature set and Feature set (detailed)
The following feature sets have both regular and detailed versions. These can be enabled or disabled in accordance to your specific use-case:
asmandasm (detailed)- Due to the high license consumption associated with monitoring thousands of ASM disks, the
asmfeature set captures only ASM disk group data, while theasm (detailed)feature set captures data for all disks. Both feature sets can be enabled at the same time.
- Due to the high license consumption associated with monitoring thousands of ASM disks, the
waitEventsandwaitEvents (detailed)- To control license consumption, the
waitEventsfeature set collects wait time metrics aggregated by wait class, while thewaitEvents (detailed)feature set collects metrics for the top 20 wait events.
- To control license consumption, the
tablespacesandtablespaces (detailed)- Due to the high CPU consumption caused by joining tablespace metrics with datafile data, the
tablespacesfeature set does not collect thecom.dynatrace.extension.sql-oracle.tablespaces.allocatedSpacemetric coming fromCDB_DATA_FILES(whichtablespaces (detailed)does). Furthermore, thetablespacesfeature set only collects data for tablespaces with more than 50% used space (as reported byCDB_TABLESPACE_USAGE_METRICS), while thetablespaces (detailed)feature set collects metrics for all tablespaces. Only one of these feature sets should be enabled at any given time.
- Due to the high CPU consumption caused by joining tablespace metrics with datafile data, the
Why am I missing Data Guard metrics?
For some of the Data Guard metrics, not seeing any data is the correct behavior and it means the Data Guard deployment is working as expected. The following metrics show data points only when there are issues that need further investigation:
- NOLOGGING activity records a metric data point when operations against the database generate no redo log records. This requires investigation because from a Data Guard perspective the mechanism is completely bypassed when such activity occurs, leaving the standby vulnerable until these files are manually refreshed.
- Data Guard severe events records a metric data point when Data Guard reports a fatal or severe event. The metric dimensions carry the event message or description for further investigation on the database instance.
- Archive destination status records a metric data point when the database's archive destinations report an Invalid or Error status. The metric dimensions show a description of the status and identify the archive destination that reported the error.
Why am I missing CPU usage metrics?
The extension collects the com.dynatrace.extension.sql-oracle.cpu.backgroundTotal and com.dynatrace.extension.sql-oracle.cpu.foregroundTotal metrics from the GV$METRIC view, filtered by metric group System Metrics Long Duration (Group ID 2). Since this group is only populated at the CDB level, these metrics are available only when the extension connects to the CDB, not the PDB.
If you are missing these two metrics, double-check your connection configuration and ensure that the extension configuration is pointing to the CDB.
Why are the tablespace usage metrics reported by Dynatrace different to what I am used to seeing?
While some administrators monitor tablespace usage by manually reviewing datafiles, Dynatrace derives all tablespace metrics (com.dynatrace.extension.sql-oracle.tablespaces.*) from the DBA_TABLESPACE_USAGE_METRICS view, which provides Oracle's own calculations on tablespaces' maximum and used space. The values for maximum space (and therefore used space %) can differ significantly from the datafile approach, as this view accounts for both underlying storage capacity and auto-extend settings. To learn how these metrics are calculated, see Oracle's table usage metrics.
Why do I see duplicate entities?
When monitoring RAC setups, the extension automatically discovers nodes from the GV$ views. Configure monitoring only for the cluster listener, not for each individual node. If you see duplicate clusters or nodes, verify that the extension connects to the cluster listener, not to each individual node.
Also, confirm that the extension is configured to connect to the CDB, and not the individual PDBs.
Why am I not seeing my databases?
If there is no data for a database at all, a connection problem between the ActiveGate and the database server is the most likely cause.
-
First, verify that the connection details (hostname/IP, port, service name/SID) are correct and that the monitoring user has permission to establish a session.
-
Next, confirm that a connection can be established from the ActiveGate to the database server, and that no firewalls are blocking it. Use the Dynatrace DB connection check tool to verify that the ActiveGate can establish a JDBC connection.
If data is missing for a specific metric or set of metrics, the monitoring user may be missing required permissions. Verify that the user has all permissions listed on the Hub tile. Check the ActiveGate logs for errors during query execution.
In some cases, a missing metric indicates a misconfiguration (CDB vs. PDB, for example). Some metrics are only available at the CDB level. Verify that the extension is configured to connect to the CDB.
Where do I look for diagnostic logs?
Detailed error messages are in the ActiveGate logs directory on the server.
- Alternatively, you can collect diagnostics remotely, which include relevant logs.
Troubleshooting
- To troubleshoot this extension, use the guides in the Dynatrace Community.