HAProxy (Prometheus) extension
- Latest Dynatrace
- Extension
- Published Oct 27, 2025
Monitor HAProxy Load balancer using Prometheus to feed Dynatrace with metrics.
Get started
Overview
Monitor the HAProxy load balancer using Prometheus to collect data remotely and analyze it in Dynatrace using a topology-first approach to monitoring with the ") HAProxy (Prometheus) extension.
HAProxy (Prometheus) extension.
Use cases
- Monitor the performance of an edge proxy or ingress proxy.
- Focus on Kubernetes calls for supporting the most popular services of this kind in Kubernetes.
- Monitor infrastructure with a comprehensive dashboard.
- Use Prometheus as the data source.
- Take pre-emptive measures to avoid service degradations.
Requirements
HAProxy devices using the Prometheus exporter.
Activation and setup
Find the extension in Dynatrace Hub to start the installation.
For more information on the related Prometheus extension, see Dynatrace Prometheus Extension Documentation.
Details
Metrics collected
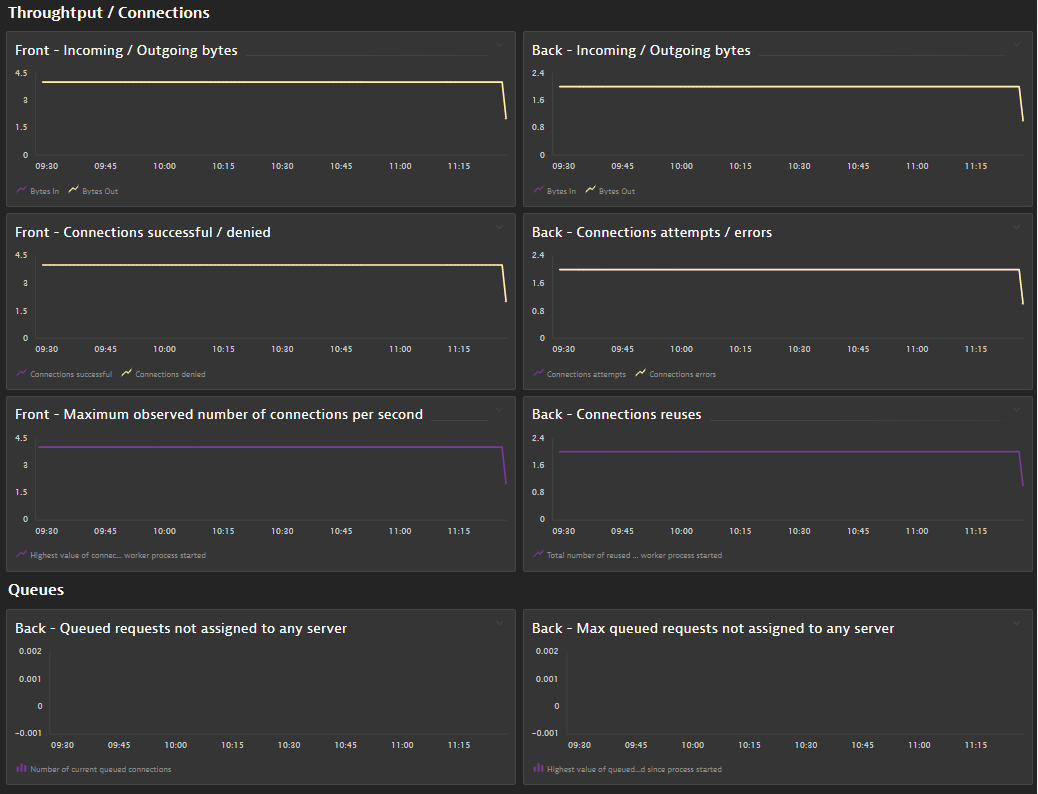
- Throughput / Connections
- Queues
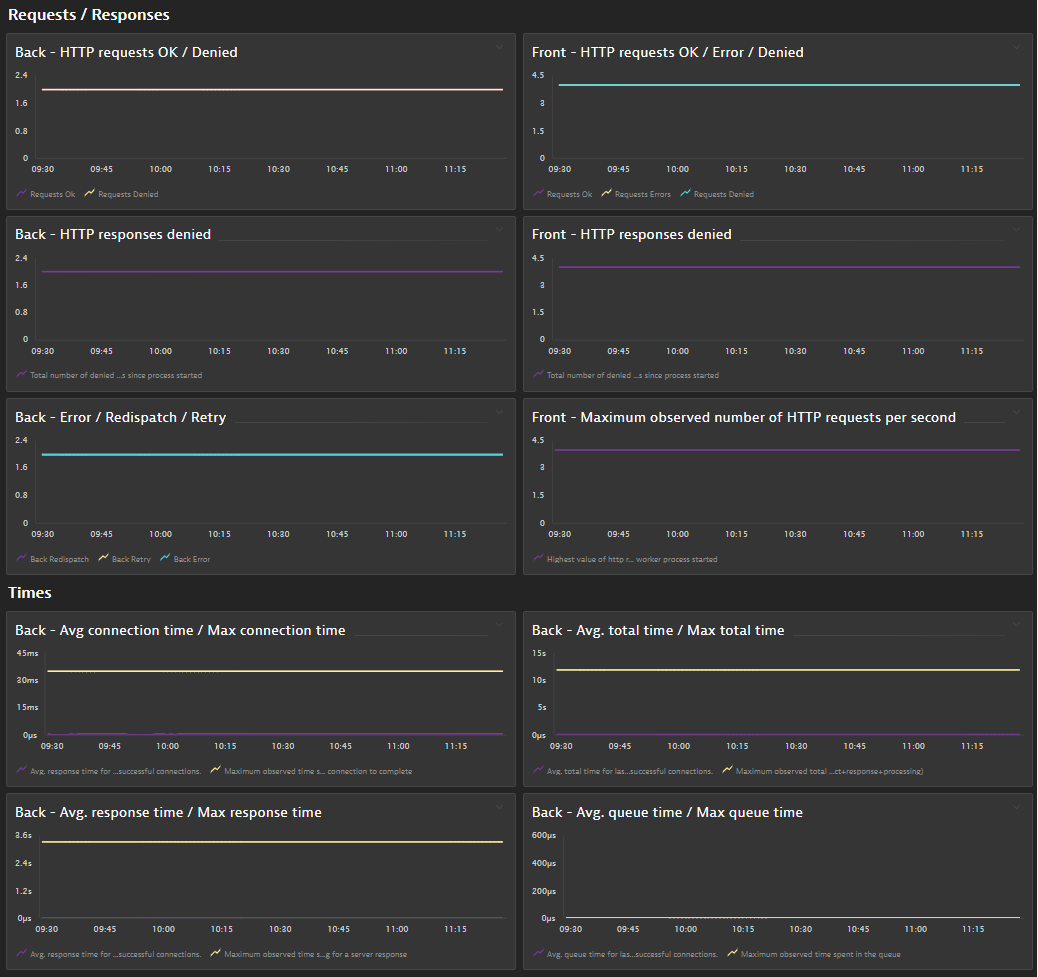
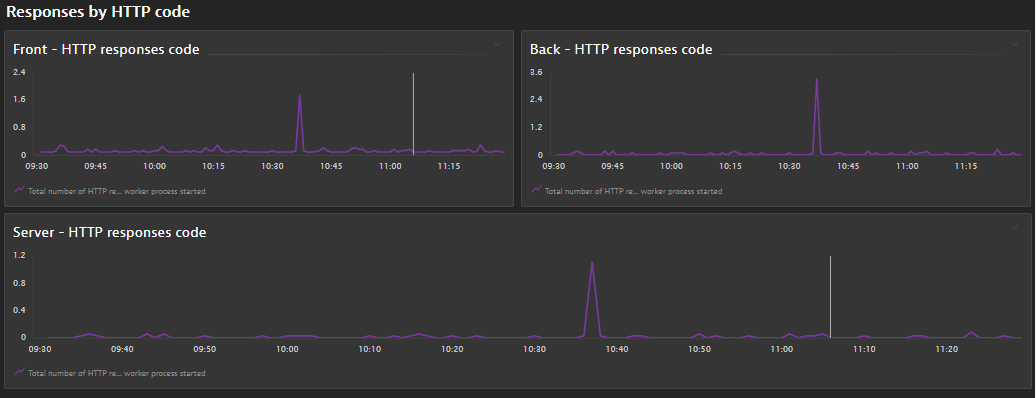
- Request / Responses
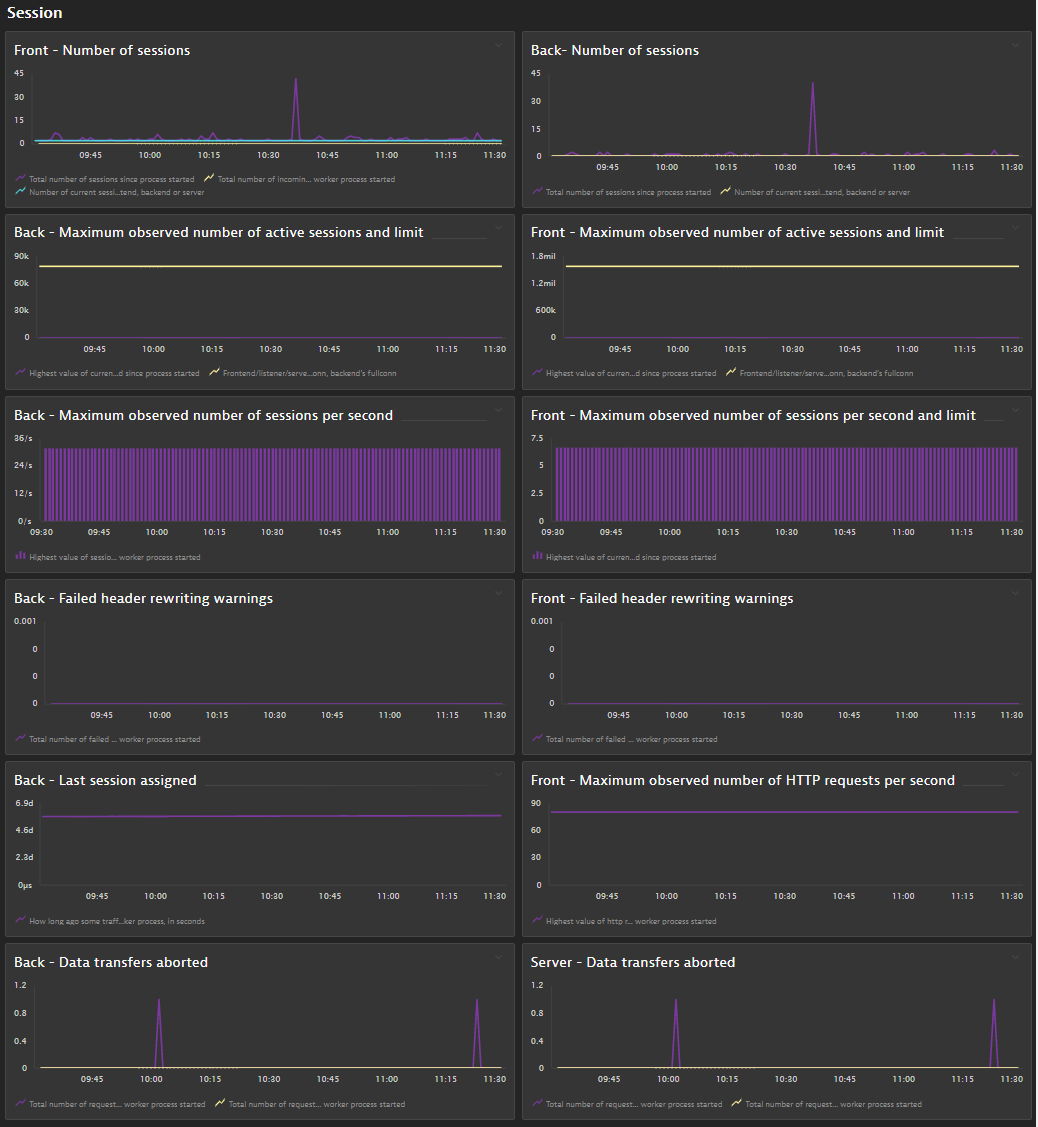
- Sessions
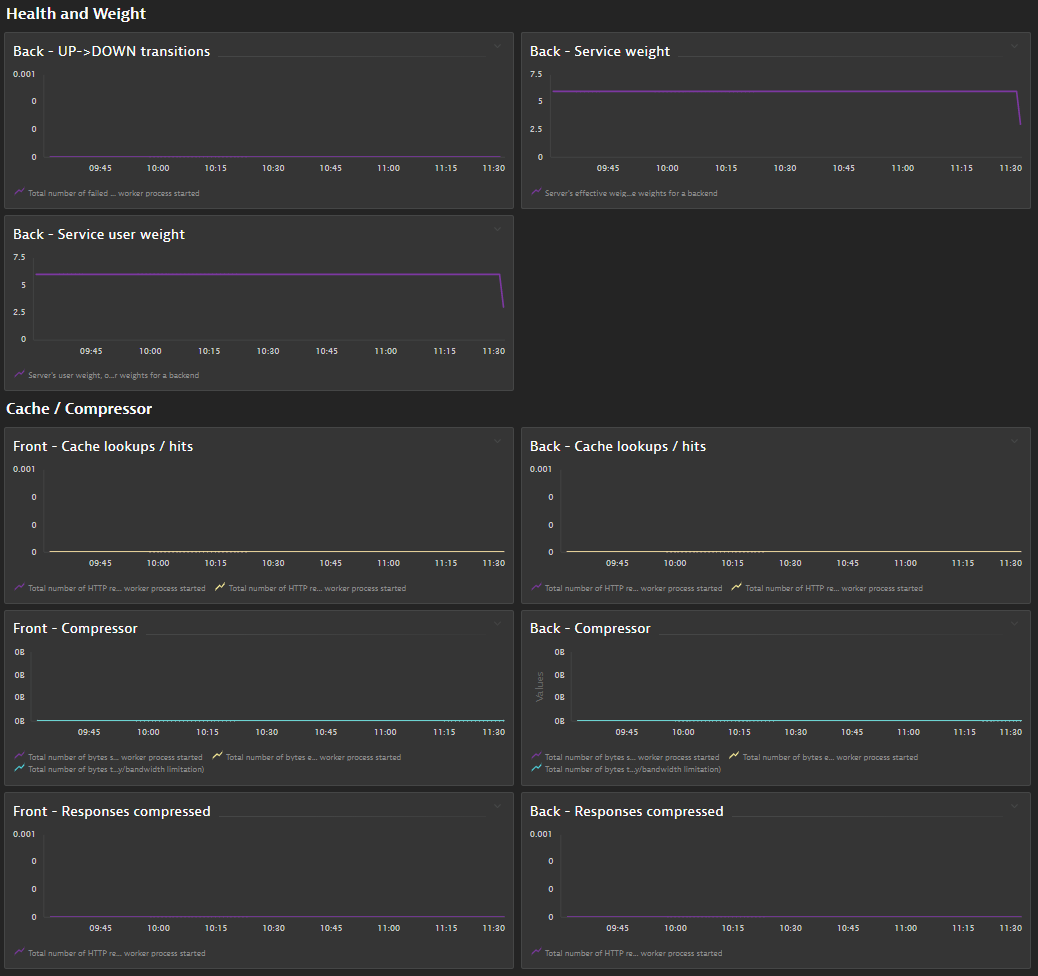
- Cache / Compressor
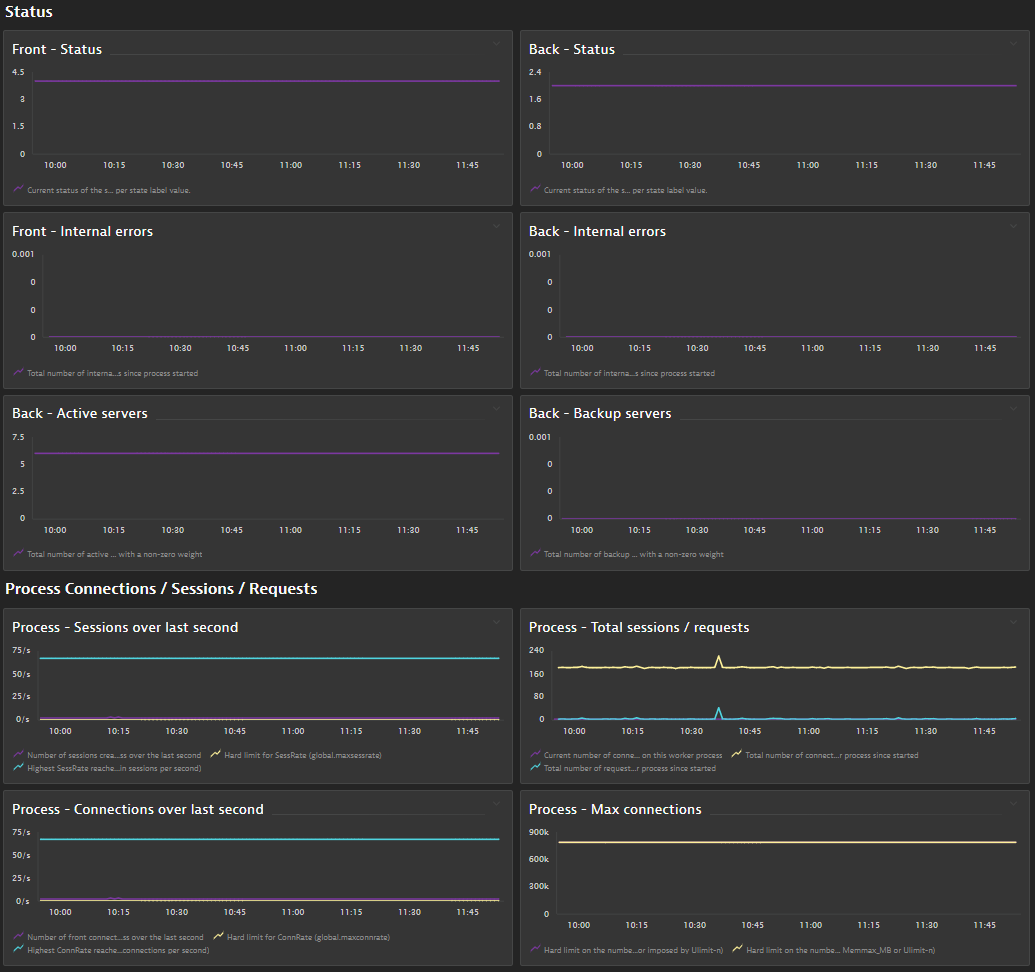
- Status
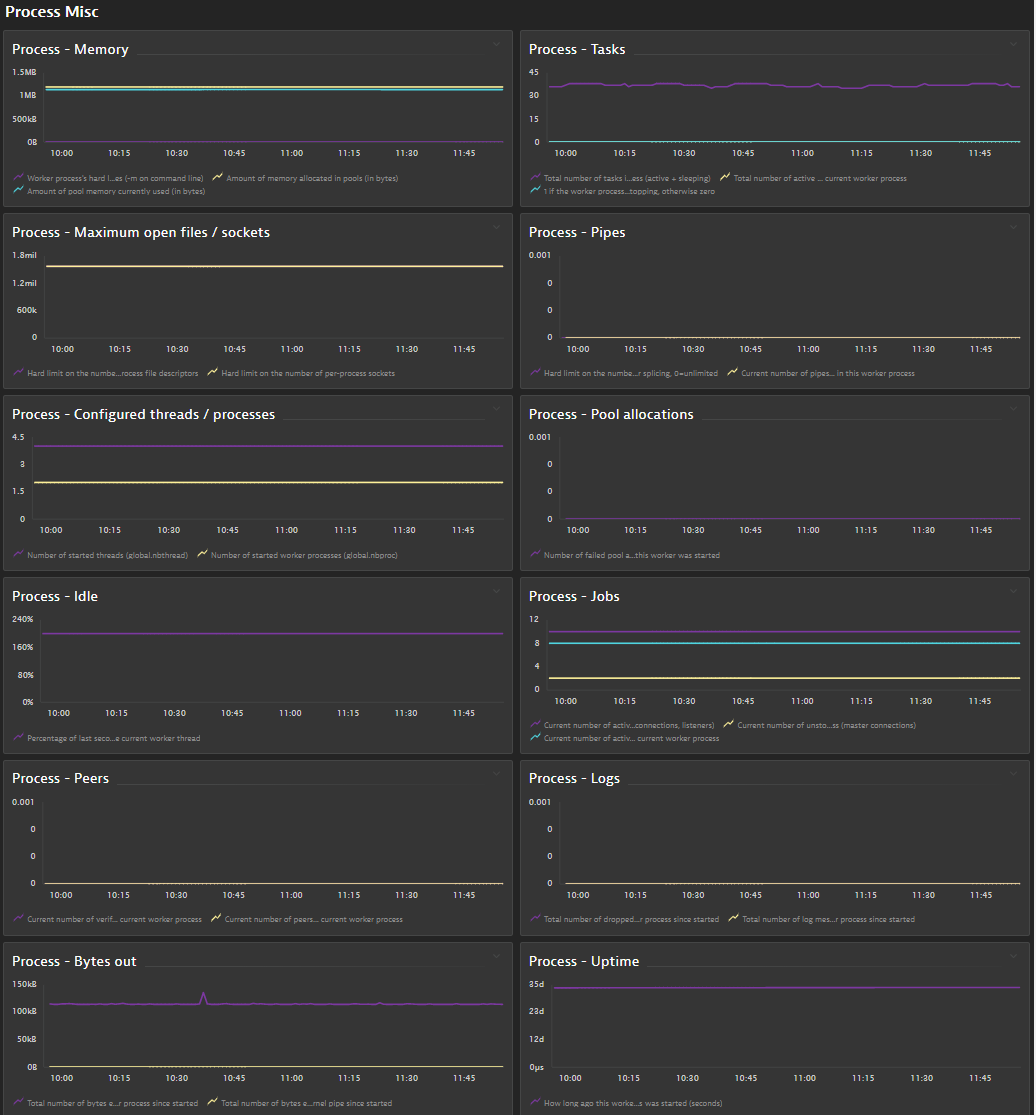
- Process
The extension package contains
- Prometheus data source configuration for metric ingestion
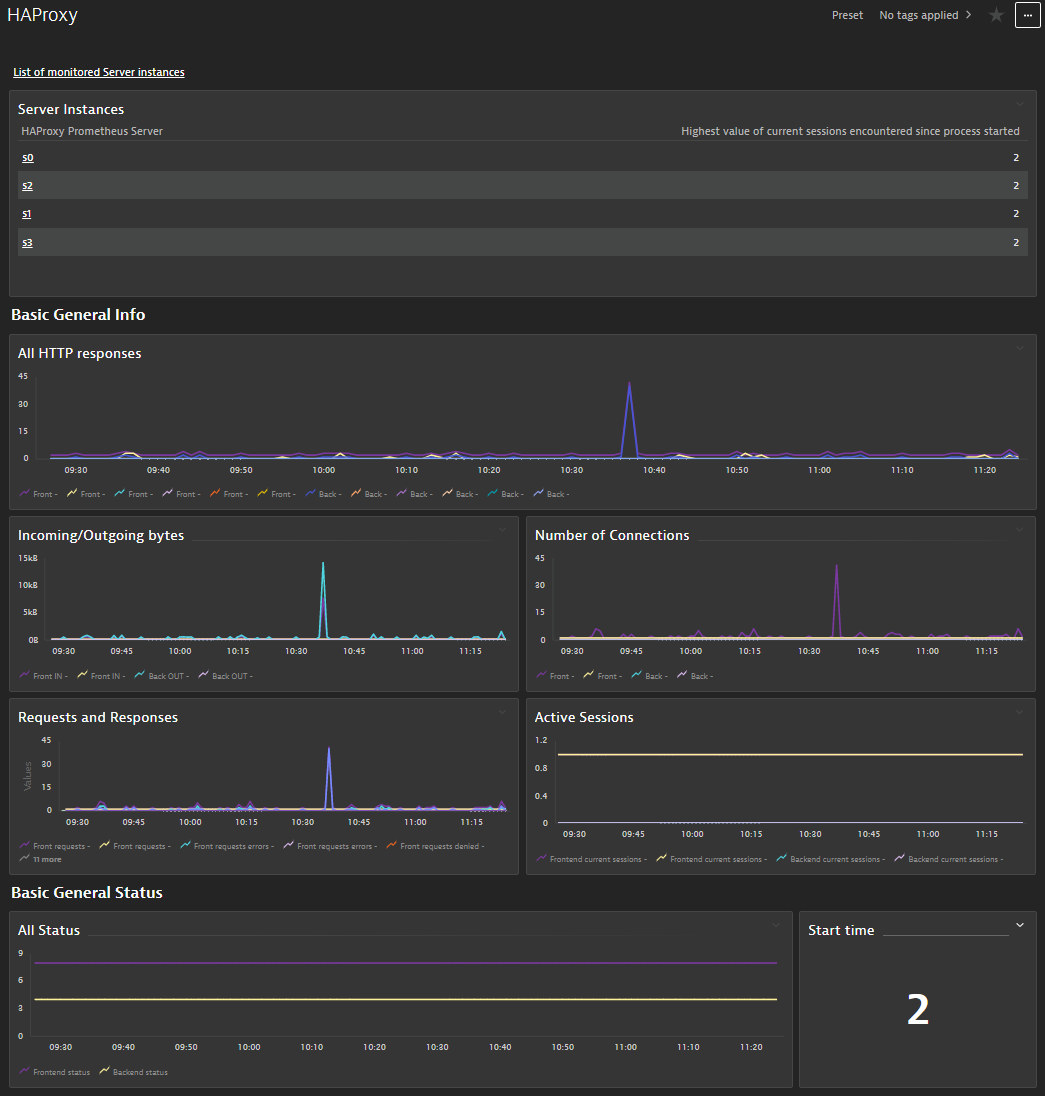
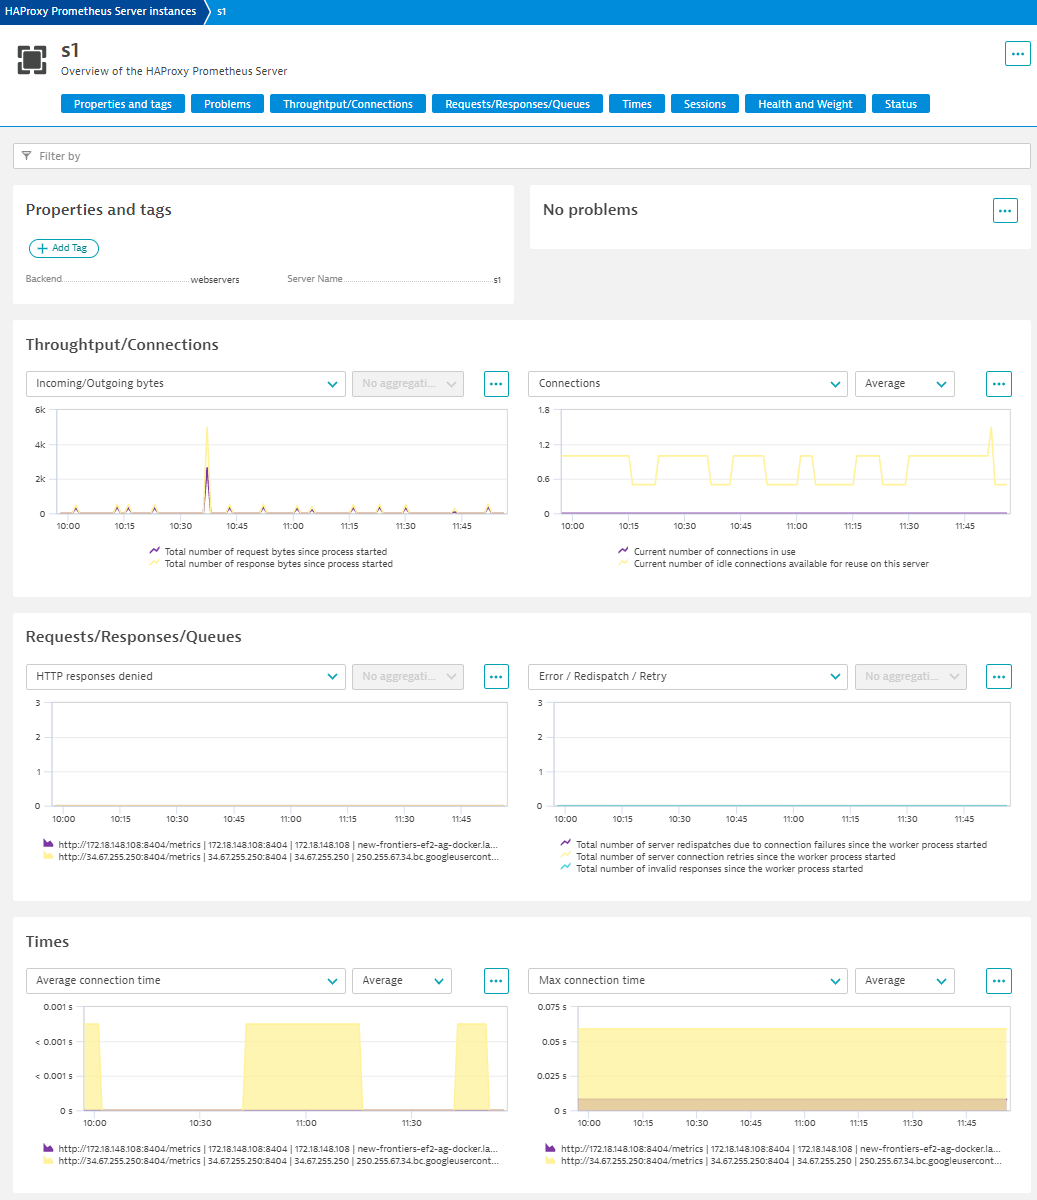
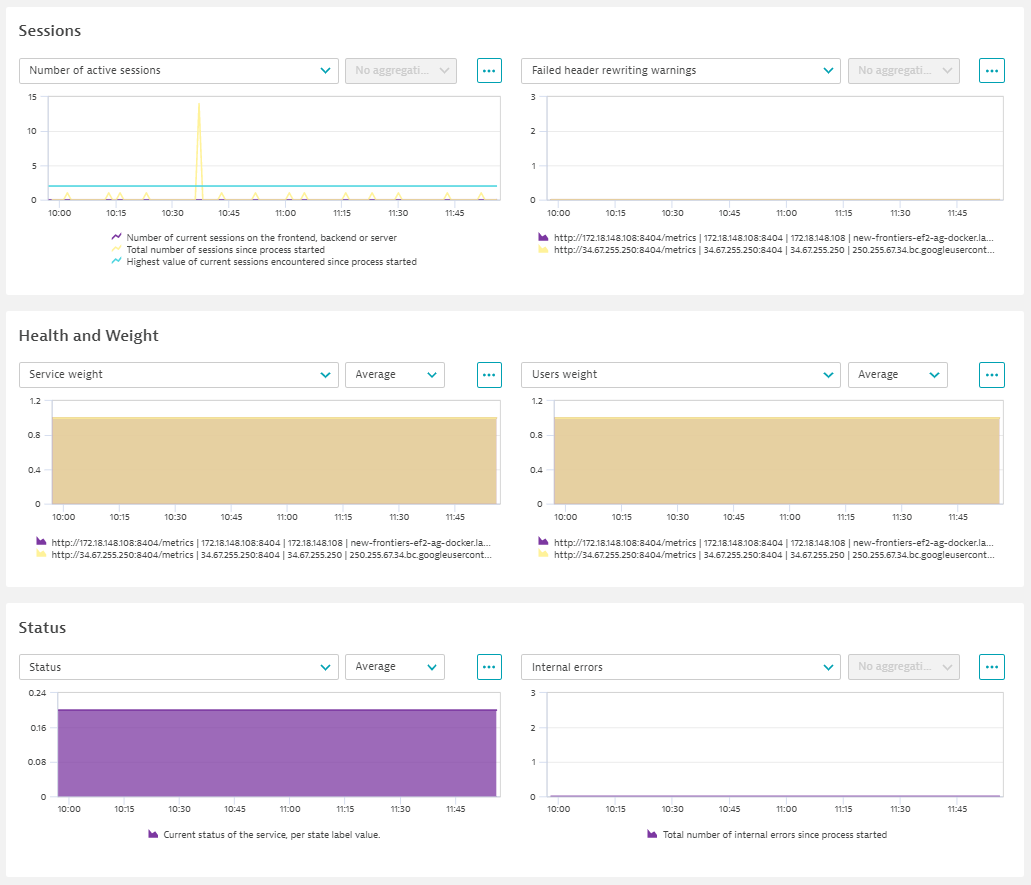
- Overview Dashboard template
- Topology for servers
- Unified Analysis page for server entity
This extension is built on top of the new Extension 2.0 Framework
For more information, see Product News Blog
Feature sets
When activating your extension using monitoring configuration, you can limit monitoring to one of the feature sets. To work properly the extension has to collect at least one metric after the activation.
In highly segmented networks, feature sets can reflect the segments of your environment. Then, when you create a monitoring configuration, you can select a feature set and a corresponding ActiveGate group that can connect to this particular segment.
All metrics that aren't categorized into any feature set are considered to be the default and are always reported.
A metric inherits the feature set of a subgroup, which in turn inherits the feature set of a group. Also, the feature set defined on the metric level overrides the feature set defined on the subgroup level, which in turn overrides the feature set defined on the group level.
| Metric name | Metric key | Description |
|---|---|---|
| Limit of connections | com.dynatrace.extension.haproxy-prometheus.process_max_connections | Hard limit on the number of per-process connections (configured or imposed by Ulimit-n) |
| Hard limit of connections | com.dynatrace.extension.haproxy-prometheus.process_hard_max_connections | Hard limit on the number of per-process connections (imposed by Memmax_MB or Ulimit-n) |
| Current connections | com.dynatrace.extension.haproxy-prometheus.process_current_connections | Current number of connections on this worker process |
| Worker connections | com.dynatrace.extension.haproxy-prometheus.process_connections_total.count | Total number of connections on this worker process since started |
| Metric name | Metric key | Description |
|---|---|---|
| SSL connections limit | com.dynatrace.extension.haproxy-prometheus.process_max_ssl_connections | Hard limit on the number of per-process SSL endpoints (front+back), 0=unlimited |
| Current SSL connections | com.dynatrace.extension.haproxy-prometheus.process_current_ssl_connections | Current number of SSL endpoints on this worker process (front+back) |
| SSL connections | com.dynatrace.extension.haproxy-prometheus.process_ssl_connections_total.count | Total number of SSL endpoints on this worker process since started (front+back) |
| SSL connections rate | com.dynatrace.extension.haproxy-prometheus.process_current_ssl_rate | Number of SSL connections created on this worker process over the last second |
| Limit ssl rate | com.dynatrace.extension.haproxy-prometheus.process_limit_ssl_rate | Hard limit for SslRate (global.maxsslrate) |
| Highest ssl rate | com.dynatrace.extension.haproxy-prometheus.process_max_ssl_rate | Highest SslRate reached on this worker process since started (in connections per second) |
| Frontend SSL key rate | com.dynatrace.extension.haproxy-prometheus.process_current_frontend_ssl_key_rate | Number of SSL keys created on frontends in this worker process over the last second |
| Highest frontend Ssl key rate | com.dynatrace.extension.haproxy-prometheus.process_max_frontend_ssl_key_rate | Highest SslFrontendKeyRate reached on this worker process since started (in SSL keys per second) |
| Frontend SSL reuse | com.dynatrace.extension.haproxy-prometheus.process_frontend_ssl_reuse | Percent of frontend SSL connections which did not require a new key |
| Backend SSL key rate | com.dynatrace.extension.haproxy-prometheus.process_current_backend_ssl_key_rate | Number of SSL keys created on backends in this worker process over the last second |
| Highest backend Ssl key rate | com.dynatrace.extension.haproxy-prometheus.process_max_backend_ssl_key_rate | Highest SslBackendKeyRate reached on this worker process since started (in SSL keys per second) |
| SSL sessions ID lookups in cache | com.dynatrace.extension.haproxy-prometheus.process_ssl_cache_lookups_total.count | Total number of SSL session ID lookups in the SSL session cache on this worker since started |
| SSL session ID not found in cache | com.dynatrace.extension.haproxy-prometheus.process_ssl_cache_misses_total.count | Total number of SSL session ID lookups that didn't find a session in the SSL session cache on this worker since started |
| Metric name | Metric key | Description |
|---|---|---|
| Current frontend sessions | com.dynatrace.extension.haproxy-prometheus.frontend_current_sessions | Number of current sessions on the frontend, backend or server |
| Frontend limit sessions | com.dynatrace.extension.haproxy-prometheus.frontend_limit_sessions | Frontend/listener/server's maxconn, backend's fullconn |
| Frontend sessions | com.dynatrace.extension.haproxy-prometheus.frontend_sessions_total.count | Total number of sessions since process started |
| Frontend bytes in | com.dynatrace.extension.haproxy-prometheus.frontend_bytes_in_total.count | Total number of request bytes since process started |
| Frontend bytes out | com.dynatrace.extension.haproxy-prometheus.frontend_bytes_out_total.count | Total number of response bytes since process started |
| Frontend denied requests | com.dynatrace.extension.haproxy-prometheus.frontend_requests_denied_total.count | Total number of denied requests since process started |
| Frontend denied responses | com.dynatrace.extension.haproxy-prometheus.frontend_responses_denied_total.count | Total number of denied responses since process started |
| Frontend requests errors | com.dynatrace.extension.haproxy-prometheus.frontend_request_errors_total.count | Total number of invalid requests since process started |
| Frontend service status | com.dynatrace.extension.haproxy-prometheus.frontend_status | Current status of the service, per state label value. |
| Frontend limit sessions rate | com.dynatrace.extension.haproxy-prometheus.frontend_limit_session_rate | Limit on the number of sessions accepted in a second (frontend only, 'rate-limit sessions' setting) |
| Highest frontend session rate | com.dynatrace.extension.haproxy-prometheus.frontend_max_session_rate | Highest value of sessions per second observed since the worker process started |
| Frontend HTTP responses | com.dynatrace.extension.haproxy-prometheus.frontend_http_responses_total.count | Total number of HTTP responses with status 100-199 returned by this object since the worker process started |
| Highest frontend HTTP requests | com.dynatrace.extension.haproxy-prometheus.frontend_http_requests_rate_max | Highest value of http requests observed since the worker process started |
| Frontend HTTP requests | com.dynatrace.extension.haproxy-prometheus.frontend_http_requests_total.count | Total number of HTTP requests processed by this object since the worker process started |
| Frontend connections rate max | com.dynatrace.extension.haproxy-prometheus.frontend_connections_rate_max | Highest value of connections per second observed since the worker process started |
| Frontend new connections | com.dynatrace.extension.haproxy-prometheus.frontend_connections_total.count | Total number of new connections accepted on this frontend since the worker process started |
| Frontend HTTP request intercepted | com.dynatrace.extension.haproxy-prometheus.frontend_intercepted_requests_total.count | Total number of HTTP requests intercepted on the frontend (redirects/stats/services) since the worker process started |
| Frontend denied connections | com.dynatrace.extension.haproxy-prometheus.frontend_denied_connections_total.count | Total number of incoming connections blocked on a listener/frontend by a tcp-request connection rule since the worker process started |
| Frontend denied sessions | com.dynatrace.extension.haproxy-prometheus.frontend_denied_sessions_total.count | Total number of incoming sessions blocked on a listener/frontend by a tcp-request connection rule since the worker process started |
| Frontend failed HTTP header rewrites | com.dynatrace.extension.haproxy-prometheus.frontend_failed_header_rewriting_total.count | Total number of failed HTTP header rewrites since the worker process started |
| Frontend internal errors | com.dynatrace.extension.haproxy-prometheus.frontend_internal_errors_total.count | Total number of internal errors since process started |
| Metric name | Metric key | Description |
|---|---|---|
| HTTP compressor bytes in | com.dynatrace.extension.haproxy-prometheus.process_http_comp_bytes_in_total.count | Number of bytes submitted to the HTTP compressor in this worker process over the last second |
| HTTP compressor bytes out | com.dynatrace.extension.haproxy-prometheus.process_http_comp_bytes_out_total.count | Number of bytes emitted by the HTTP compressor in this worker process over the last second |
| CompressBpsOut limit | com.dynatrace.extension.haproxy-prometheus.process_limit_http_comp | Limit of CompressBpsOut beyond which HTTP compression is automatically disabled |
| Currently used memory by HTTP compression | com.dynatrace.extension.haproxy-prometheus.process_current_zlib_memory | Amount of memory currently used by HTTP compression on the current worker process (in bytes) |
| Limit of memory used by HTTP compression | com.dynatrace.extension.haproxy-prometheus.process_max_zlib_memory | Limit on the amount of memory used by HTTP compression above which it is automatically disabled (in bytes, see global.maxzlibmem) |
| Frontend HTTP compressor bytes in | com.dynatrace.extension.haproxy-prometheus.frontend_http_comp_bytes_in_total.count | Total number of bytes submitted to the HTTP compressor for this object since the worker process started |
| Frontend HTTP compressor bytes out | com.dynatrace.extension.haproxy-prometheus.frontend_http_comp_bytes_out_total.count | Total number of bytes emitted by the HTTP compressor for this object since the worker process started |
| Frontend HTTP compressor bytes bypassed | com.dynatrace.extension.haproxy-prometheus.frontend_http_comp_bytes_bypassed_total.count | Total number of bytes that bypassed HTTP compression for this object since the worker process started (CPU/memory/bandwidth limitation) |
| Frontend HTTP compressed responses | com.dynatrace.extension.haproxy-prometheus.frontend_http_comp_responses_total.count | Total number of HTTP responses that were compressed for this object since the worker process started |
| Backend HTTP compressor bytes in | com.dynatrace.extension.haproxy-prometheus.backend_http_comp_bytes_in_total.count | Total number of bytes submitted to the HTTP compressor for this object since the worker process started |
| Backend HTTP compressor bytes out | com.dynatrace.extension.haproxy-prometheus.backend_http_comp_bytes_out_total.count | Total number of bytes emitted by the HTTP compressor for this object since the worker process started |
| Backend HTTP compressor bytes bypassed | com.dynatrace.extension.haproxy-prometheus.backend_http_comp_bytes_bypassed_total.count | Total number of bytes that bypassed HTTP compression for this object since the worker process started (CPU/memory/bandwidth limitation) |
| Backend HTTP compressed responses | com.dynatrace.extension.haproxy-prometheus.backend_http_comp_responses_total.count | Total number of HTTP responses that were compressed for this object since the worker process started |
| Metric name | Metric key | Description |
|---|---|---|
| Server avg. queue time | com.dynatrace.extension.haproxy-prometheus.server_queue_time_average_seconds | Avg. queue time for last 1024 successful connections. |
| Server avg. connect time | com.dynatrace.extension.haproxy-prometheus.server_connect_time_average_seconds | Avg. connect time for last 1024 successful connections. |
| Server avg. response time | com.dynatrace.extension.haproxy-prometheus.server_response_time_average_seconds | Avg. response time for last 1024 successful connections. |
| Server max queue time | com.dynatrace.extension.haproxy-prometheus.server_max_queue_time_seconds | Maximum observed time spent in the queue |
| Server max connection time | com.dynatrace.extension.haproxy-prometheus.server_max_connect_time_seconds | Maximum observed time spent waiting for a connection to complete |
| Server max response time | com.dynatrace.extension.haproxy-prometheus.server_max_response_time_seconds | Maximum observed time spent waiting for a server response |
| Server max request+response time | com.dynatrace.extension.haproxy-prometheus.server_max_total_time_seconds | Maximum observed total request+response time (request+queue+connect+response+processing) |
| Metric name | Metric key | Description |
|---|
| Metric name | Metric key | Description |
|---|---|---|
| Highest frontend current sessions | com.dynatrace.extension.haproxy-prometheus.frontend_max_sessions | Highest value of current sessions encountered since process started |
| Metric name | Metric key | Description |
|---|---|---|
| Backend avg. queue time | com.dynatrace.extension.haproxy-prometheus.backend_queue_time_average_seconds | Avg. queue time for last 1024 successful connections. |
| Backend avg. connect time | com.dynatrace.extension.haproxy-prometheus.backend_connect_time_average_seconds | Avg. connect time for last 1024 successful connections. |
| Backend avg. response time | com.dynatrace.extension.haproxy-prometheus.backend_response_time_average_seconds | Avg. response time for last 1024 successful connections. |
| Backend avg. total time | com.dynatrace.extension.haproxy-prometheus.backend_total_time_average_seconds | Avg. total time for last 1024 successful connections. |
| Backend max queue time | com.dynatrace.extension.haproxy-prometheus.backend_max_queue_time_seconds | Maximum observed time spent in the queue |
| Backend max connection time | com.dynatrace.extension.haproxy-prometheus.backend_max_connect_time_seconds | Maximum observed time spent waiting for a connection to complete |
| Backend max response time | com.dynatrace.extension.haproxy-prometheus.backend_max_response_time_seconds | Maximum observed time spent waiting for a server response |
| Backend max request+response time | com.dynatrace.extension.haproxy-prometheus.backend_max_total_time_seconds | Maximum observed total request+response time (request+queue+connect+response+processing) |
| Metric name | Metric key | Description |
|---|---|---|
| Backend current queued connections | com.dynatrace.extension.haproxy-prometheus.backend_current_queue | Number of current queued connections |
| Backend highest queued connections | com.dynatrace.extension.haproxy-prometheus.backend_max_queue | Highest value of queued connections encountered since process started |
| Backend current sessions | com.dynatrace.extension.haproxy-prometheus.backend_current_sessions | Number of current sessions on the frontend, backend or server |
| Backend highest sessions | com.dynatrace.extension.haproxy-prometheus.backend_max_sessions | Highest value of current sessions encountered since process started |
| Backend limit sessions | com.dynatrace.extension.haproxy-prometheus.backend_limit_sessions | Frontend/listener/server's maxconn, backend's fullconn |
| Backend sessions | com.dynatrace.extension.haproxy-prometheus.backend_sessions_total.count | Total number of sessions since process started |
| Backend bytes in | com.dynatrace.extension.haproxy-prometheus.backend_bytes_in_total.count | Total number of request bytes since process started |
| Backend bytes out | com.dynatrace.extension.haproxy-prometheus.backend_bytes_out_total.count | Total number of response bytes since process started |
| Backend requests denied | com.dynatrace.extension.haproxy-prometheus.backend_requests_denied_total.count | Total number of denied requests since process started |
| Backend responses denied | com.dynatrace.extension.haproxy-prometheus.backend_responses_denied_total.count | Total number of denied responses since process started |
| Backend connections errors | com.dynatrace.extension.haproxy-prometheus.backend_connection_errors_total.count | Total number of failed connections to server since the worker process started |
| Backend responses errors | com.dynatrace.extension.haproxy-prometheus.backend_response_errors_total.count | Total number of invalid responses since the worker process started |
| Backend server connection retries | com.dynatrace.extension.haproxy-prometheus.backend_retry_warnings_total.count | Total number of server connection retries since the worker process started |
| Backend redispatch warnings | com.dynatrace.extension.haproxy-prometheus.backend_redispatch_warnings_total.count | Total number of server redispatches due to connection failures since the worker process started |
| Backend current status | com.dynatrace.extension.haproxy-prometheus.backend_status | Current status of the service, per state label value. |
| Backend weight | com.dynatrace.extension.haproxy-prometheus.backend_weight | Server's effective weight, or sum of active servers' effective weights for a backend |
| Backend active servers | com.dynatrace.extension.haproxy-prometheus.backend_active_servers | Total number of active UP servers with a non-zero weight |
| Backend backup servers | com.dynatrace.extension.haproxy-prometheus.backend_backup_servers | Total number of backup UP servers with a non-zero weight |
| Backend check up down | com.dynatrace.extension.haproxy-prometheus.backend_check_up_down_total.count | Total number of failed checks causing UP to DOWN server transitions, per server/backend, since the worker process started |
| Backend check last change | com.dynatrace.extension.haproxy-prometheus.backend_check_last_change_seconds | How long ago the last server state changed, in seconds |
| Backend downtime seconds | com.dynatrace.extension.haproxy-prometheus.backend_downtime_seconds_total.count | Total time spent in DOWN state, for server or backend |
| Backend loadbalanced | com.dynatrace.extension.haproxy-prometheus.backend_loadbalanced_total.count | Total number of requests routed by load balancing since the worker process started (ignores queue pop and stickiness) |
| Backend highest sessions rate | com.dynatrace.extension.haproxy-prometheus.backend_max_session_rate | Highest value of sessions per second observed since the worker process started |
| Backend HTTP responses | com.dynatrace.extension.haproxy-prometheus.backend_http_responses_total.count | Total number of HTTP responses with status 100-199 returned by this object since the worker process started |
| Backend HTTP requests | com.dynatrace.extension.haproxy-prometheus.backend_http_requests_total.count | Total number of HTTP requests processed by this object since the worker process started |
| Backend client aborts | com.dynatrace.extension.haproxy-prometheus.backend_client_aborts_total.count | Total number of requests or connections aborted by the client since the worker process started |
| Backend server aborts | com.dynatrace.extension.haproxy-prometheus.backend_server_aborts_total.count | Total number of requests or connections aborted by the server since the worker process started |
| Backend last session | com.dynatrace.extension.haproxy-prometheus.backend_last_session_seconds | How long ago some traffic was seen on this object on this worker process, in seconds |
| Backend failed HTTP header rewrites | com.dynatrace.extension.haproxy-prometheus.backend_failed_header_rewriting_total.count | Total number of failed HTTP header rewrites since the worker process started |
| Backend connection attempts | com.dynatrace.extension.haproxy-prometheus.backend_connection_attempts_total.count | Total number of outgoing connection attempts on this backend/server since the worker process started |
| Backend connection reuses | com.dynatrace.extension.haproxy-prometheus.backend_connection_reuses_total.count | Total number of reused connection on this backend/server since the worker process started |
| Backend internal errors | com.dynatrace.extension.haproxy-prometheus.backend_internal_errors_total.count | Total number of internal errors since process started |
| Backend user weight | com.dynatrace.extension.haproxy-prometheus.backend_uweight | Server's user weight, or sum of active servers' user weights for a backend |
| Backend aggregated server check status | com.dynatrace.extension.haproxy-prometheus.backend_agg_server_check_status | Backend's aggregated gauge of servers' state check status |
| Metric name | Metric key | Description |
|---|---|---|
| Server current queued connections | com.dynatrace.extension.haproxy-prometheus.server_current_queue | Number of current queued connections |
| Server highest queued connections | com.dynatrace.extension.haproxy-prometheus.server_max_queue | Highest value of queued connections encountered since process started |
| Server current sessions | com.dynatrace.extension.haproxy-prometheus.server_current_sessions | Number of current sessions on the frontend, backend or server |
| Server highest current sessions | com.dynatrace.extension.haproxy-prometheus.server_max_sessions | Highest value of current sessions encountered since process started |
| Server limit sessions | com.dynatrace.extension.haproxy-prometheus.server_limit_sessions | Frontend/listener/server's maxconn, backend's fullconn |
| Server sessions | com.dynatrace.extension.haproxy-prometheus.server_sessions_total.count | Total number of sessions since process started |
| Server bytes in | com.dynatrace.extension.haproxy-prometheus.server_bytes_in_total.count | Total number of request bytes since process started |
| Server bytes out | com.dynatrace.extension.haproxy-prometheus.server_bytes_out_total.count | Total number of response bytes since process started |
| Server denied responses | com.dynatrace.extension.haproxy-prometheus.server_responses_denied_total.count | Total number of denied responses since process started |
| Server responses errors | com.dynatrace.extension.haproxy-prometheus.server_response_errors_total.count | Total number of invalid responses since the worker process started |
| Server connection retries | com.dynatrace.extension.haproxy-prometheus.server_retry_warnings_total.count | Total number of server connection retries since the worker process started |
| Server redispatch warnings | com.dynatrace.extension.haproxy-prometheus.server_redispatch_warnings_total.count | Total number of server redispatches due to connection failures since the worker process started |
| Server status | com.dynatrace.extension.haproxy-prometheus.server_status | Current status of the service, per state label value. |
| Server weight | com.dynatrace.extension.haproxy-prometheus.server_weight | Server's effective weight, or sum of active servers' effective weights for a backend |
| Server check failures | com.dynatrace.extension.haproxy-prometheus.server_check_failures_total.count | Total number of failed individual health checks per server/backend, since the worker process started |
| Server check up down | com.dynatrace.extension.haproxy-prometheus.server_check_up_down_total.count | Total number of failed checks causing UP to DOWN server transitions, per server/backend, since the worker process started |
| Server last state change | com.dynatrace.extension.haproxy-prometheus.server_check_last_change_seconds | How long ago the last server state changed, in seconds |
| Server downtime | com.dynatrace.extension.haproxy-prometheus.server_downtime_seconds_total.count | Total time spent in DOWN state, for server or backend |
| Server queue limit | com.dynatrace.extension.haproxy-prometheus.server_queue_limit | Limit on the number of connections in queue, for servers only (maxqueue argument) |
| Server current throttle | com.dynatrace.extension.haproxy-prometheus.server_current_throttle | Throttling ratio applied to a server's maxconn and weight during the slowstart period (0 to 100%) |
| Server loadbalanced | com.dynatrace.extension.haproxy-prometheus.server_loadbalanced_total.count | Total number of requests routed by load balancing since the worker process started (ignores queue pop and stickiness) |
| Server highest sessions rate | com.dynatrace.extension.haproxy-prometheus.server_max_session_rate | Highest value of sessions per second observed since the worker process started |
| Server check status | com.dynatrace.extension.haproxy-prometheus.server_check_status | Status of last health check, per state label value. |
| Server check code | com.dynatrace.extension.haproxy-prometheus.server_check_code | layer5-7 code, if available of the last health check. |
| Server latest check duration | com.dynatrace.extension.haproxy-prometheus.server_check_duration_seconds | Total duration of the latest server health check, in seconds. |
| Server HTTP responses | com.dynatrace.extension.haproxy-prometheus.server_http_responses_total.count | Total number of HTTP responses with status 100-199 returned by this object since the worker process started |
| Server client aborts | com.dynatrace.extension.haproxy-prometheus.server_client_aborts_total.count | Total number of requests or connections aborted by the client since the worker process started |
| Server server aborts | com.dynatrace.extension.haproxy-prometheus.server_server_aborts_total.count | Total number of requests or connections aborted by the server since the worker process started |
| Server last session | com.dynatrace.extension.haproxy-prometheus.server_last_session_seconds | How long ago some traffic was seen on this object on this worker process, in seconds |
| Server avg. time | com.dynatrace.extension.haproxy-prometheus.server_total_time_average_seconds | Avg. total time for last 1024 successful connections. |
| Server failed header rewriting | com.dynatrace.extension.haproxy-prometheus.server_failed_header_rewriting_total.count | Total number of failed HTTP header rewrites since the worker process started |
| Server internal errors | com.dynatrace.extension.haproxy-prometheus.server_internal_errors_total.count | Total number of internal errors since process started |
| Server user weight | com.dynatrace.extension.haproxy-prometheus.server_uweight | Server's user weight, or sum of active servers' user weights for a backend |
| Metric name | Metric key | Description |
|---|---|---|
| Current connection rate | com.dynatrace.extension.haproxy-prometheus.process_current_connection_rate | Number of front connections created on this worker process over the last second |
| Limit connection rate | com.dynatrace.extension.haproxy-prometheus.process_limit_connection_rate | Hard limit for ConnRate (global.maxconnrate) |
| Highest connection rate | com.dynatrace.extension.haproxy-prometheus.process_max_connection_rate | Highest ConnRate reached on this worker process since started (in connections per second) |
| Current sessions rate | com.dynatrace.extension.haproxy-prometheus.process_current_session_rate | Number of sessions created on this worker process over the last second |
| Limit session rate | com.dynatrace.extension.haproxy-prometheus.process_limit_session_rate | Hard limit for SessRate (global.maxsessrate) |
| Highest session rate | com.dynatrace.extension.haproxy-prometheus.process_max_session_rate | Highest SessRate reached on this worker process since started (in sessions per second) |
| Bytes out rate | com.dynatrace.extension.haproxy-prometheus.process_bytes_out_rate | Number of bytes emitted by current worker process over the last second |
| Metric name | Metric key | Description |
|---|---|---|
| Frontend HTTP requests looked up in the cache | com.dynatrace.extension.haproxy-prometheus.frontend_http_cache_lookups_total.count | Total number of HTTP requests looked up in the cache on this frontend/backend since the worker process started |
| Frontend HTTP requests not found in the cache | com.dynatrace.extension.haproxy-prometheus.frontend_http_cache_hits_total.count | Total number of HTTP requests not found in the cache on this frontend/backend since the worker process started |
| Backend HTTP requests looked up in cache | com.dynatrace.extension.haproxy-prometheus.backend_http_cache_lookups_total.count | Total number of HTTP requests looked up in the cache on this frontend/backend since the worker process started |
| Backend HTTP requests not found in cache | com.dynatrace.extension.haproxy-prometheus.backend_http_cache_hits_total.count | Total number of HTTP requests not found in the cache on this frontend/backend since the worker process started |
| Metric name | Metric key | Description |
|---|---|---|
| Started threads | com.dynatrace.extension.haproxy-prometheus.process_nbthread | Number of started threads (global.nbthread) |
| Started worker processes | com.dynatrace.extension.haproxy-prometheus.process_nbproc | Number of started worker processes (global.nbproc) |
| Relative process id | com.dynatrace.extension.haproxy-prometheus.process_relative_process_id | Relative worker process number (1..Nbproc) |
| Uptime | com.dynatrace.extension.haproxy-prometheus.process_uptime_seconds | How long ago this worker process was started (seconds) |
| Worker requests | com.dynatrace.extension.haproxy-prometheus.process_requests_total.count | Total number of requests on this worker process since started |
| Limit of pipes | com.dynatrace.extension.haproxy-prometheus.process_max_pipes | Hard limit on the number of pipes for splicing, 0=unlimited |
| Pipes used | com.dynatrace.extension.haproxy-prometheus.process_pipes_used_total.count | Current number of pipes in use in this worker process |
| Available pipes | com.dynatrace.extension.haproxy-prometheus.process_pipes_free_total.count | Current number of allocated and available pipes in this worker process |
| Worker current tasks | com.dynatrace.extension.haproxy-prometheus.process_current_tasks | Total number of tasks in the current worker process (active + sleeping) |
| tasks+tasklets | com.dynatrace.extension.haproxy-prometheus.process_current_run_queue | Total number of active tasks+tasklets in the current worker process |
| Idle time percent | com.dynatrace.extension.haproxy-prometheus.process_idle_time_percent | Percentage of last second spent waiting in the current worker thread |
| Process stopping 1-true 0-false | com.dynatrace.extension.haproxy-prometheus.process_stopping | 1 if the worker process is currently stopping, otherwise zero |
| Active jobs | com.dynatrace.extension.haproxy-prometheus.process_jobs | Current number of active jobs on the current worker process (frontend connections, master connections, listeners) |
| Unstoppable jobs | com.dynatrace.extension.haproxy-prometheus.process_unstoppable_jobs | Current number of unstoppable jobs on the current worker process (master connections) |
| Active listeners | com.dynatrace.extension.haproxy-prometheus.process_listeners | Current number of active listeners on the current worker process |
| Active peers | com.dynatrace.extension.haproxy-prometheus.process_active_peers | Current number of verified active peers connections on the current worker process |
| Connected peers | com.dynatrace.extension.haproxy-prometheus.process_connected_peers | Current number of peers having passed the connection step on the current worker process |
| Dropped logs | com.dynatrace.extension.haproxy-prometheus.process_dropped_logs_total.count | Total number of dropped logs for current worker process since started |
| Busy polling 1-enabled 0-disabled | com.dynatrace.extension.haproxy-prometheus.process_busy_polling_enabled | 1 if busy-polling is currently in use on the worker process, otherwise zero (config.busy-polling) |
| Failed DNS resolutions | com.dynatrace.extension.haproxy-prometheus.process_failed_resolutions.count | Total number of failed DNS resolutions in current worker process since started |
| Bytes out | com.dynatrace.extension.haproxy-prometheus.process_bytes_out_total.count | Total number of bytes emitted by current worker process since started |
| Bytes out through kernel pipe | com.dynatrace.extension.haproxy-prometheus.process_spliced_bytes_out_total.count | Total number of bytes emitted by current worker process through a kernel pipe since started |
| Received logs | com.dynatrace.extension.haproxy-prometheus.process_recv_logs_total.count | Total number of log messages received by log-forwarding listeners on this worker process since started |
| Build info | com.dynatrace.extension.haproxy-prometheus.process_build_info | Build info |
| Start time | com.dynatrace.extension.haproxy-prometheus.process_start_time_seconds | Start time in seconds |
| File descriptors | com.dynatrace.extension.haproxy-prometheus.process_max_fds | Hard limit on the number of per-process file descriptors |
| Limit of sockets | com.dynatrace.extension.haproxy-prometheus.process_max_sockets | Hard limit on the number of per-process sockets |
| Hard limit on memory usage in bytes | com.dynatrace.extension.haproxy-prometheus.process_max_memory_bytes | Worker process's hard limit on memory usage in bytes (-m on command line) |
| Metric name | Metric key | Description |
|---|---|---|
| Memory allocated in pools | com.dynatrace.extension.haproxy-prometheus.process_pool_allocated_bytes | Amount of memory allocated in pools (in bytes) |
| Pool memory used | com.dynatrace.extension.haproxy-prometheus.process_pool_used_bytes | Amount of pool memory currently used (in bytes) |
| Failed pool allocations | com.dynatrace.extension.haproxy-prometheus.process_pool_failures_total.count | Number of failed pool allocations since this worker was started |
| Metric name | Metric key | Description |
|---|---|---|
| Server connections errors | com.dynatrace.extension.haproxy-prometheus.server_connection_errors_total.count | Total number of failed connections to server since the worker process started |
| Server connection attempts | com.dynatrace.extension.haproxy-prometheus.server_connection_attempts_total.count | Total number of outgoing connection attempts on this backend/server since the worker process started |
| Server connection reuses | com.dynatrace.extension.haproxy-prometheus.server_connection_reuses_total.count | Total number of reused connection on this backend/server since the worker process started |
| Server current idle connections | com.dynatrace.extension.haproxy-prometheus.server_idle_connections_current | Current number of idle connections available for reuse on this server |
| Server idle connections limit | com.dynatrace.extension.haproxy-prometheus.server_idle_connections_limit | Limit on the number of available idle connections on this server (server 'pool_max_conn' directive) |
| Server current unsafe idle connections | com.dynatrace.extension.haproxy-prometheus.server_unsafe_idle_connections_current | Current number of unsafe idle connections |
| Server current safe idle connections | com.dynatrace.extension.haproxy-prometheus.server_safe_idle_connections_current | Current number of safe idle connections |
| Server current used connections | com.dynatrace.extension.haproxy-prometheus.server_used_connections_current | Current number of connections in use |
| Server needed connections | com.dynatrace.extension.haproxy-prometheus.server_need_connections_current | Estimated needed number of connections |
