The Kubernetes Enhanced Object Visibility Preview introduces a new way to explore Kubernetes environments in Dynatrace, offering deeper visibility, improved performance, and powerful troubleshooting capabilities. The preview is completed since December 2025.
Prerequisites
Dynatrace SaaS environment powered by Grail and AppEngine
There is a very small exception for a few specific tenants that won't be able to access the preview. More information on that will be available within the product.
DPS license with the Kubernetes Platform Monitoring capability on your Rate Card
Visibility into additional Kubernetes objects: Ingress, NetworkPolicies, CRDs, PVCs, PVs, ConfigMaps, and more.
Access to YAML definitions to debug and validate configurations in real time.
Ability to query YAMLs across all clusters and namespaces using Dynatrace Query Language (DQL) to instantly surface misconfigurations, missing references, or policy violations across your Kubernetes environment
Specifically, this preview unlocks visibility into:
Secrets and ConfigMaps are not ingested by default due to their potentially sensitive content. To monitor these Kubernetes objects, you can manually grant the necessary permissions. For instructions on how to enable ConfigMaps and Secrets, see the Setup tab.
This preview also adds insights into the YAML files of all Kubernetes objects, allowing you to inspect object configurations directly in Dynatrace. Turn on Watch to stream updates of these configurations within a few seconds to the web UI, allowing for fast validation of recent changes. The YAML is currently limited to a size of 32 kb, and we automatically strip less important fields (for example, /metadata/managedFields and kubectl.kubernetes.io/last-applied-configuration annotation).
These additions are available upon opt-in on the additional Explorer (Preview) tab in Kubernetes.
A variety of further use-cases are unlocked, by allowing users to query all YAML files also via DQL. You can find a notebook with different examples within our community.
To opt in to this preview, go to Settings > Cloud and virtualization > Kubernetes. This setting is available within the scope of your tenant or within the scope a monitored Kubernetes cluster.
We recommend getting started by enabling the preview only for a single Kubernetes cluster first, as this new functionality might increase the load on the ActiveGate monitoring this cluster. To enable this only for one cluster, go to the Settings of a selected cluster within Kubernetes and select > Connection settings in the upper-right corner of the cluster's detail page.
If you've set tight resource constraints (CPU and memory limits) on the ActiveGate monitoring this cluster, this might cause interruptions in your monitoring. You can easily remedy that by increasing the configured limits, or by removing them temporarly to find a good fit for new limits. While the ingest of additional data can be controlled on a cluster-by-cluster basis, the additional Explorer (Preview) tab within Kubernetes is available as soon as any cluster is enabled for the preview.
Unlocking ConfigMaps and Secrets
To gain visibility into ConfigMaps and Secrets, you need to grant additional permissions to the ActiveGate, allowing it to access these objects. By default, this functionality is disabled because these objects might contain sensitive data. For Secrets, ActiveGate automatically applies data masking.
Apply the following YAML with kubectl to enable these objects:
apiVersion: rbac.authorization.k8s.io/v1
kind: ClusterRoleBinding
metadata:
name: dynatrace-kubernetes-monitoring-sensitive
roleRef:
apiGroup: rbac.authorization.k8s.io
kind: ClusterRole
name: dynatrace-kubernetes-monitoring-sensitive
subjects:
-kind: ServiceAccount
name: dynatrace-kubernetes-monitoring
namespace: dynatrace
---
apiVersion: rbac.authorization.k8s.io/v1
kind: ClusterRole
metadata:
name: dynatrace-kubernetes-monitoring-sensitive
labels:
rbac.dynatrace.com/aggregate-to-monitoring:"true"
rules:
-apiGroups:
-""
resources:
- configmaps
- secrets
verbs:
- list
- watch
- get
Does this preview increase my DPS consumption?
The preview builds upon the existing Kubernetes and the corresponding license based on pod-hours. The consumed pod-hours include insights into all newly added Kubernetes objects, meaning there won't be any increase in DPS consumption specific to this preview.
What happens technically by joining this preview?
Dynatrace starts to ingest Kubernetes objects additionally into the new Smartscape. The newly unlocked objects (for example, Ingress, Network Policies) will only be available in the new Smartscape. This unlocks easier DQL access, faster queries, and access to the YAML of these objects. We will continue to write the existing entities into the old storage. In our community, you also find a notebook that helps you get started working with Kubernetes objects stored in the new Smartscape using DQL. Within Kubernetes, the new Explorer (Preview) automatically leverages the new Smartscape in the background, while the already existing Explorer continues to operate on data stored in our old storage.
Where will this preview go from here?
The Explorer (Preview) will incrementally improve over the next months until it includes all the same features as the existing Explorer. With the GA of this new functionality, Explorer (Preview) will replace the existing Explorer for everyone, and we also plan to include more custom resources. We would be happy to hear your feedback on which ones would be most important to you.
We will continue for some time to offer the entities that powered the former Explorer via DQL (for example, fetch dt.entity.cloud_application).
What observability option do I need for this preview? Do I need Full-Stack observability?
This preview is based on Kubernetes platform monitoring, which is included in all observability options.
What are top-level workloads?
A top-level workload is the topmost controlling owner of a Pod.
Possible top-level workload types are: Deployment, ReplicaSet, StatefulSet, DaemonSet, Job, CronJob, ReplicationController, DeploymentConfig.
A list of those workloads can be found in the Top-level workloads menu entry.
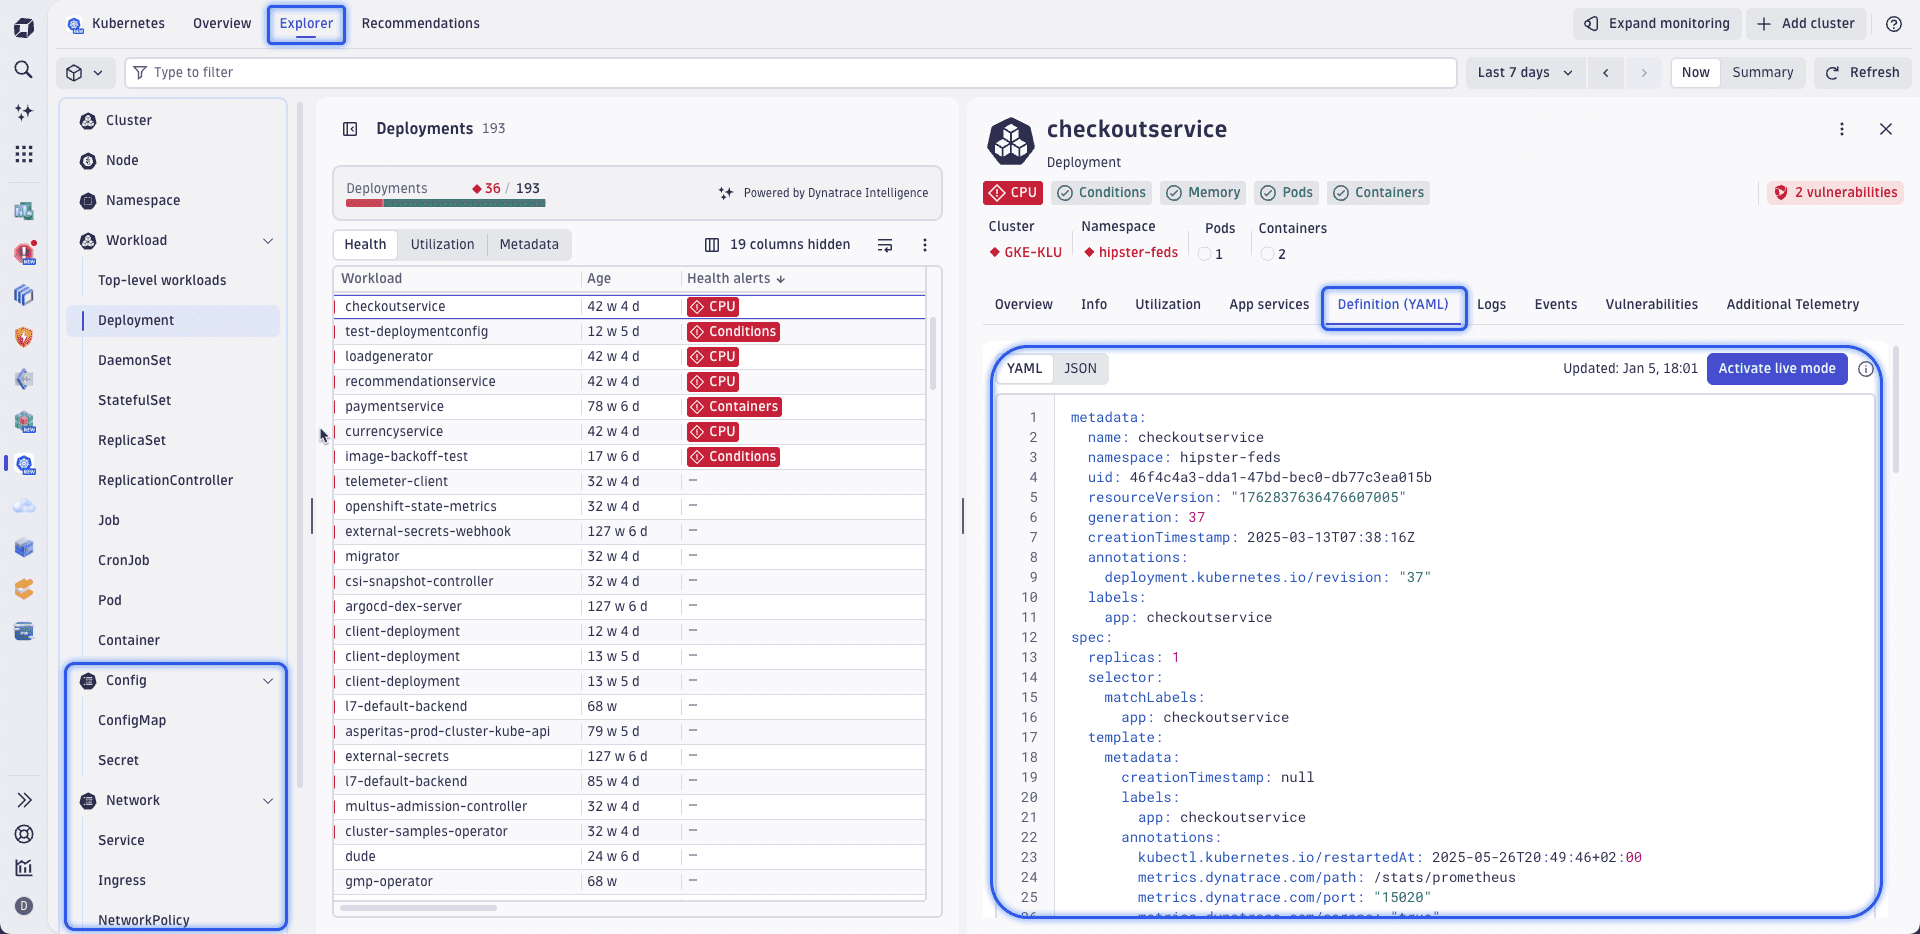
What do I see in the Definition (YAML) view?
When first opening this view you see a reduced version of the original YAML as available from the Kubernetes API. When you activate the live mode, you get full YAML directly streamed from the Kubernetes API.
The reduced version of the YAML is also available in json format via DQL in the k8s.object field of the respective Smartscape node.
Please note, that labels and annotation are not part of this field, but are stored as tags.
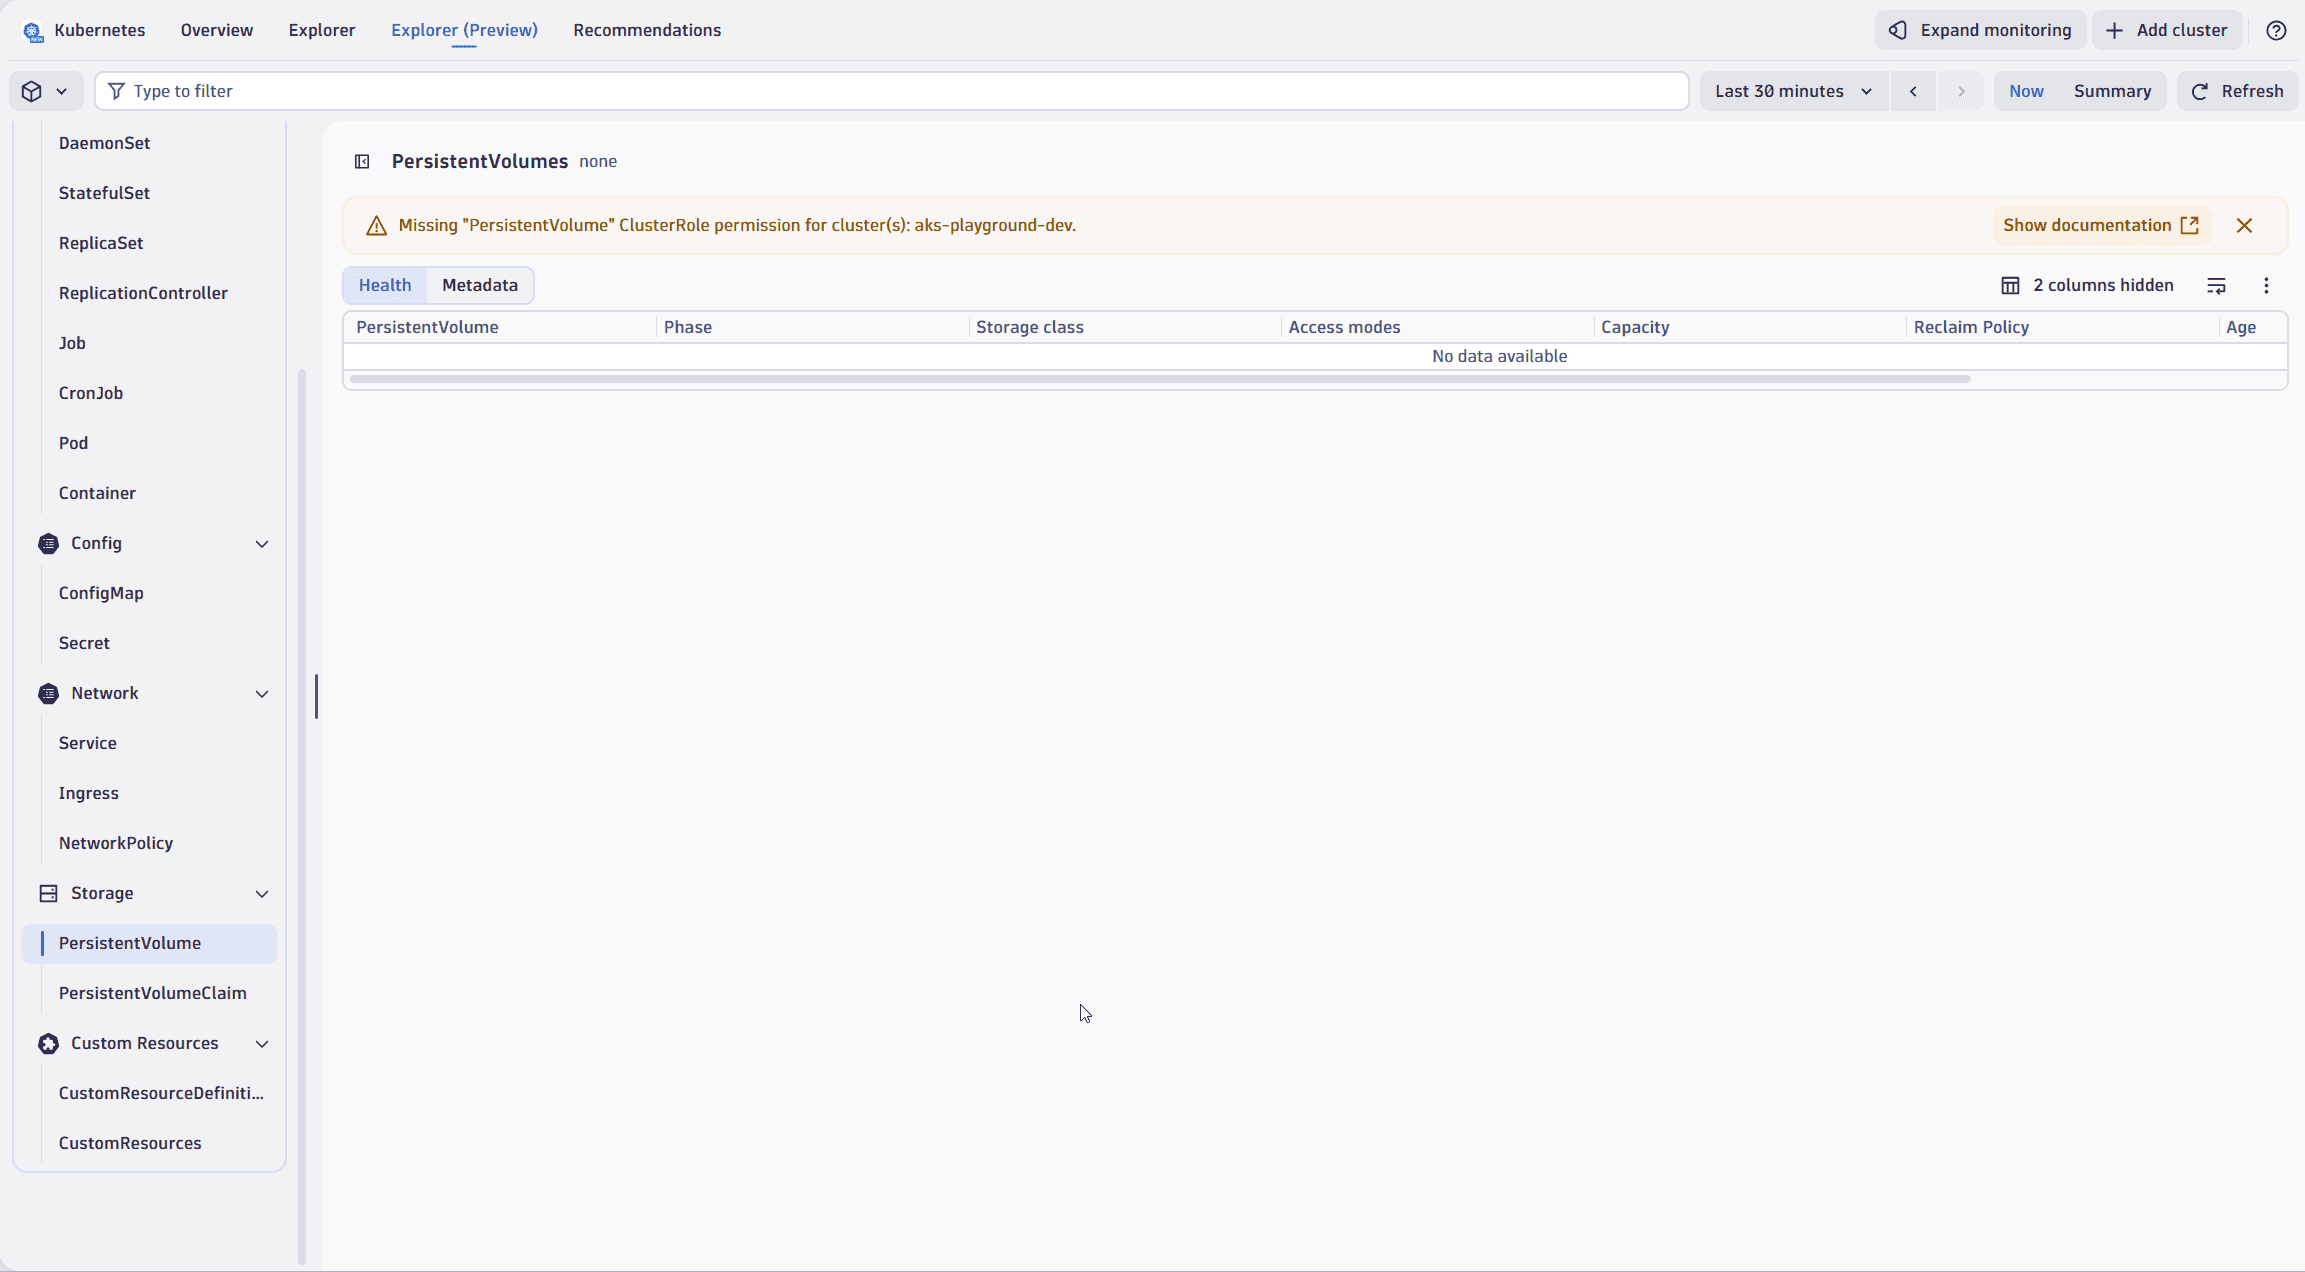
How can I fix missing ClusterRole permissions?
The newly added Kubernetes object types require additional ActiveGate permissions. These permissions (except for ConfigMaps and Secrets 1) are automatically granted when Dynatrace Operator is updated to version 1.7.0. Customers using older Dynatrace Operator versions, or those who manually have overwritten the ActiveGate permissions, may lack access to the new Kubernetes endpoints. If permissions are missing, a warning message appears above the table (for example Missing "ConfigMap" ClusterRole permission for cluster(s): aks-playground-dev.):
ConfigMaps and Secrets can contain sensitive information. Therefore, Dynatrace Operator version 1.7.0 does not grant permissions to these endpoints by default. To enable access to these objects, follow the guidance provided in Unlocking ConfigMaps and Secrets.
Learn more
Dive deeper into Kubernetes with the following resources:
") Kubernetes within your Dynatrace environment
Kubernetes within your Dynatrace environment