Data-driven cloud tuning
- Latest Dynatrace
- Tutorial
- 13-min read
- Published Jan 31, 2024
Each cloud application consists of many components that communicate with each other as well as with the outside world. We typically take the cloud's network layer for granted until reality reminds us of its existence. For example:
- An application breaks because the components cannot talk to one other due to changing network security rules.
- It's time to pay an AWS bill for traffic sent across availability zones or regions.
In such cases, the understanding of what's going on in the networking layer and the ability to analyze traffic patterns become crucial.
By adopting these best practices, you can streamline cloud usage, leading to significant cost savings and a more efficient cloud infrastructure. Simple yet impactful, this use case is about smart resource management for optimal financial and operational benefits.
Target audience
This article is specifically designed for CloudOps professionals tasked with overseeing cloud infrastructure and managing its associated costs. It is intended to provide valuable insights and actionable strategies for efficient resource utilization.
-
A fundamental understanding of cloud computing concepts, and familiarity with cloud service providers (particularly AWS, if applicable), are recommended.
-
Expert-level knowledge is not a prerequisite, but some experience with cloud management tools, including Dynatrace, will enable you to apply these best practices more effectively.
Scenario
In this example, we send the VPC Flows Logs data into Dynatrace and store them in Grail for intelligent analysis of the data.
With the power of DQL, you can combine networking data with Dynatrace-native information about monitored entities, topology, and metrics collected in other ways to deliver answers beyond the standard VPC Flow Logs.
The examples focus on tracking data volume exchanges within and between different parties (VPCs, regions, availability zones, hosts playing particular roles), but they can be easily extended to other use cases.
Prerequisites
AWS requirements
- Set up VPC log generation
Dynatrace requirements
-
Set up log ingestion (ingests AWS VPC flow logs into Grail). Depending on VPC flow logs availability, log forwarding via CloudWatch/Kinesis or via S3 is possible.
-
Optional You can assign the VPC flow logs into a dedicated bucket for dedicated retention configuration as well as better performance of queries.
- Set up buckets with the desired retention. Note that VPC flow logs can be chatty, so plan a retention period accordingly.
- Set up a proper bucket assignment rule in Settings > Log Monitoring > Bucket Assignment. For logs obtained via CloudWatch, you can use the
aws.log_groupattribute. For S3 log forwarding, you can uselog.source.aws.s3.bucket.nameorlog.source.aws.s3.key.nameattributes. Filter on a bucket in DQL queries to get only logs from it. For example:
filter dt.system.bucket=="vpc_flow_logs"-
Make sure the following permissions are enabled. Grail:
storage:logs:read. For instructions, see Permissions in Grail -
Set up a log processing rule in Settings > Log Monitoring > Processing. Use a proper matcher to find the VPC flow log lines (see bucket configuration) and set up a parsing rule extracting flow log attributes from content. Adjust the parsing rule to the content and order of fields defined on the AWS side.
Example of possible fields
Here's an example of all possible fields in the alphabetical order. It reuses the original AWS field naming (
-replaced with_).PARSE(content, "STRING:account_id SPACE STRING:action SPACE STRING:az_id SPACE INT:bytes SPACE IPV4:dstaddr SPACE INT:dstport SPACE STRING:end SPACE STRING:flow_direction SPACE STRING:instance_id SPACE STRING:interface_id SPACE STRING:log_status SPACE INT:packets SPACE STRING:pkt_dst_aws_service SPACE IPADDR:pkt_dstaddr SPACE STRING:pkt_src_aws_service SPACE PV4:pkt_srcaddr SPACE INT:protocol SPACE STRING:region SPACE IPV4:srcaddr SPACE INT:srcport SPACE STRING:start SPACE STRING:sublocation_id SPACE STRING:sublocation_type SPACE STRING:subnet_id SPACE INT:tcp_flags SPACE STRING:traffic_path SPACE STRING:type SPACE STRING:version SPACE STRING:vpc_id") -
Alternatively, you don't parse on ingest and don't store ready-to-use attributes, but parse on read in a DQL query.
Steps
1. Check your traffic flow
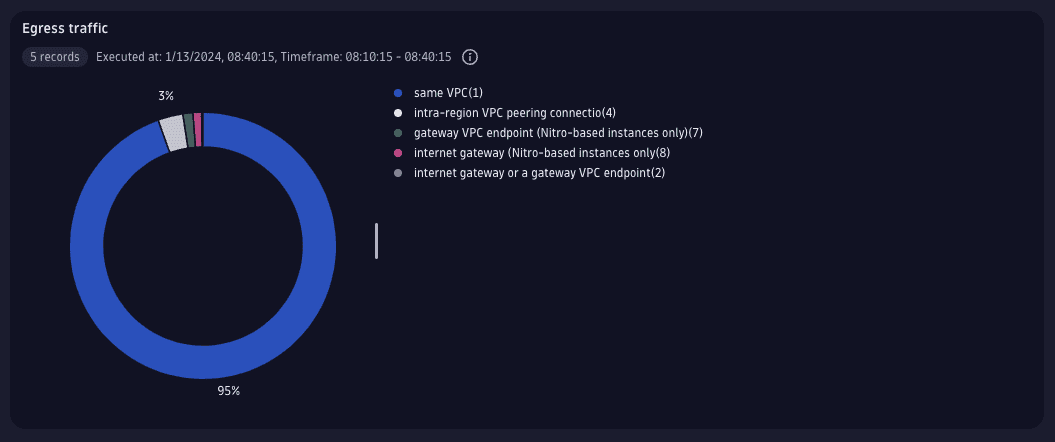
Start with checking where the traffic is being sent to from a selected VPC. VPC Flow Logs carries data volume (in bytes) per each flow, the time the flow spans, and the type of destination, which can be translated into a readable form.
Note:
- For now, the attributes parsed from log lines are stored as strings. To use them for calculations, they have to be converted to other types first.
- Using Options > Units and formats for the section setting, you can select proper unit and metric formatting for calculated summary (Gbps).
- For the detailed meaning of all VPC Flow Logs fields, please refer to the AWS documentation.
fetch logs| filter dt.system.bucket=="vpc_flow_logs" // bucket with data| filter account_id=="<your-account-id>" and vpc_id=="<vpc-id>" // specific AWS account and VPC| filter flow_direction=="egress"| fieldsAdd bytes=toLong(bytes), start=toLong(start), end=toLong(end) // conversion to numeric types| summarize {bandwidth=8*sum(bytes)/ (max(end)-min(start)) }, by:{traffic_path}| fieldsAdd destination=coalesce(if(traffic_path=="1","same VPC"),if(traffic_path=="2","internet gateway or a gateway VPC endpoint") ,if(traffic_path=="3","virtual private gateway") ,if(traffic_path=="4","intra-region VPC peering connection") ,if(traffic_path=="5","inter-region VPC peering connection") ,if(traffic_path=="6","local gateway") ,if(traffic_path=="7","gateway VPC endpoint (Nitro-based instances only)") ,if(traffic_path=="8","internet gateway (Nitro-based instances only") ,"Unknown")| fields destination=concat(destination, "(", traffic_path, ")"), bandwidth| sort bandwidth desc

2. Get the traffic breakdown
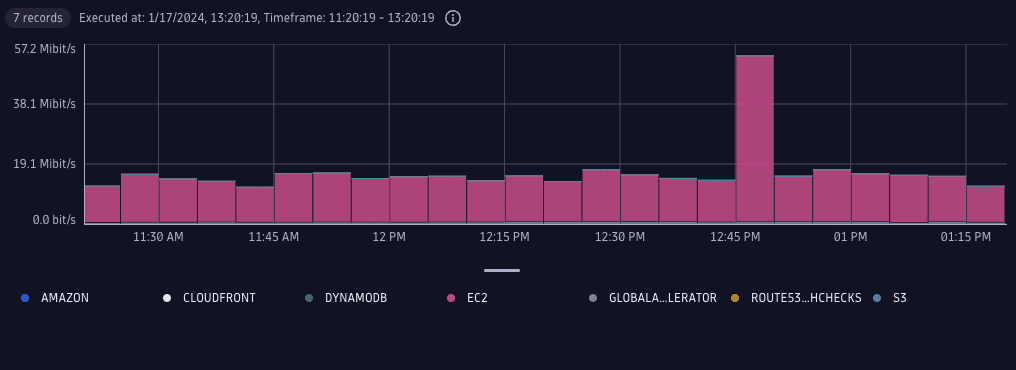
A VPC Flow Log record contains information about the source and destination AWS services involved in the communication, if applicable. Because each record has information about the first and last time for the flow, we can graph the approximation of bandwidth usage over time. The granularity of the analysis is limited by time aggregation settings for the particular VPC Flow Log setup.
With this query, you'll get the local traffic breakdown (by the target AWS service).
fetch logs, scanLimitGBytes:-1| filter dt.system.bucket=="vpc_flow_logs" // bucket with data| filter account_id=="<your-account-id>" and vpc_id=="<vpc-id>" // specific AWS account and VPC| filter flow_direction=="egress" and traffic_path=="1" // sent and local traffic only| filterOut pkt_dst_aws_service=="-" // filter out traffic not to specific AWS service| fieldsAdd bytes=toLong(bytes) // conversion to numeric types| makeTimeseries bandwidth=sum(bytes), by:{pkt_dst_aws_service}, // group by AWS servicetime:timestampFromUnixSeconds(toLong(end)), interval:5m| fieldsAdd bandwidth=8*bandwidth[]/(interval/1s)

3. Organize and filter data
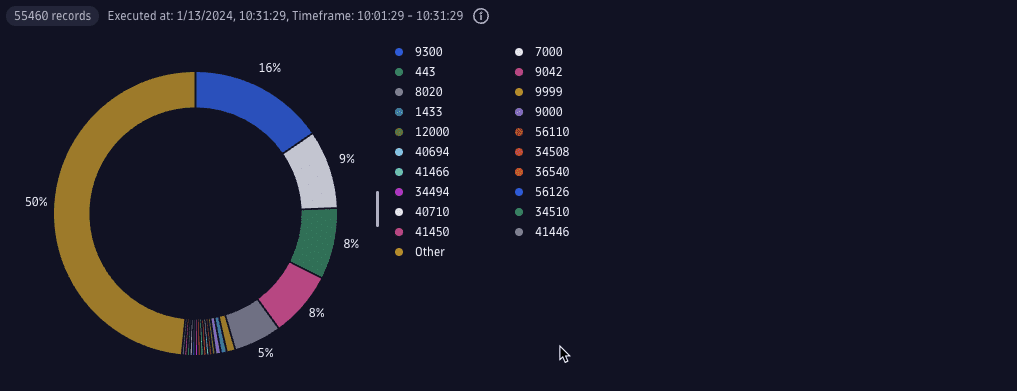
You can also filter or summarize the traffic by identifiers present in the packets, such as protocol identifiers (version of IP protocol, transport level protocols—TCP or UDP, ports) or endpoint addresses.
With the query below, you can find the busiest TCP ports. The query was allowed to return all possible port values (max 65k values) and the top is realized by a donut/pie chart function: merge slices.
fetch logs| filter dt.system.bucket=="vpc_flow_logs" // bucket with data| filter account_id=="<your-account-id>" and vpc_id=="<vpc-id>" // specific AWS account and VPC| filter flow_direction=="egress" and traffic_path=="1" // sent and local traffic only| filter in(type,{"IPv4","IPv6"}) and protocol=="6" // filter TCP traffic only| fieldsAdd bytes=toLong(bytes), start=toLong(start), end=toLong(end) // conversion to numeric types| summarize { bytes=sum(bytes), end=max(end), start=min(start) }, by:{srcport, dstport}| filterOut isNull(bytes)| fieldsAdd port=array(srcport, dstport)| expand port| summarize {bandwidth=8*sum(bytes)/ (max(end)-min(start)) }, by:{ port }| sort bandwidth desc| limit 66000

4. Check cross-availability zone traffic
A VPC flow record carries details of the place where a specific flow record was generated. It includes identification of the network interface, identification of an AWS resource using the interface (like EC2 instance or load balancer), and its location (region and availability zone).
- For "egress" records, this identification applies to the source of the traffic (outgoing).
- For "ingress" records, it applies to the destination of the traffic.
Unfortunately, a single record does not contain details on both ends of the conversation. With the help of the lookup command, we can easily bring together details derived from different types of records.
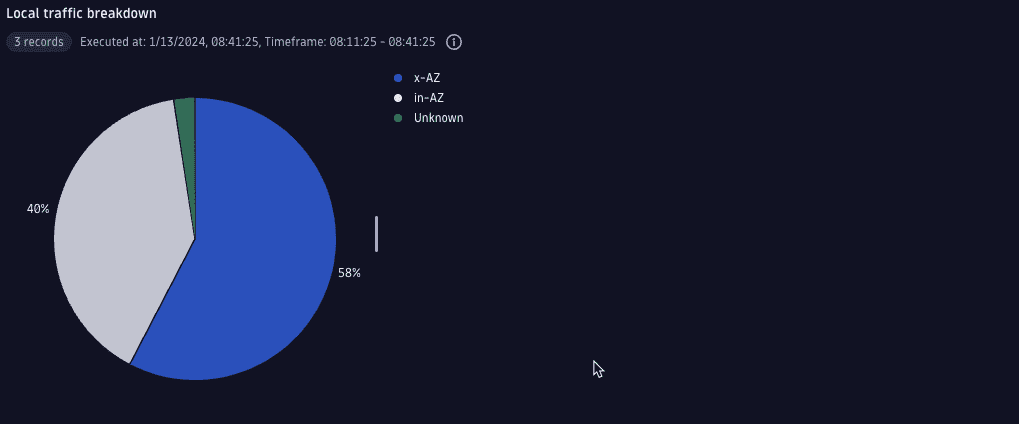
In the following example, you find the availability zones for both ends of internal VPC communication and can see how much traffic is sent locally vs cross-availability zones.
fetch logs| filter dt.system.bucket=="vpc_flow_logs" // bucket with data| filter account_id=="<your-account-id>" and vpc_id=="<vpc-id>" // specific AWS account and VPC| filter flow_direction=="egress" and traffic_path=="1" // sent and local traffic only| fieldsAdd bytes=toLong(bytes), start=toLong(start), end=toLong(end) // conversion to numeric types| lookup [fetch logs| filter dt.system.bucket=="vpc_flow_logs" // bucket with data| filter account_id=="<your-account-id>" and vpc_id=="<vpc-id>" // specific AWS account and VPC| filter flow_direction=="ingress"| summarize {c=count()}, by:{ dstaddr, instance_id, az_id}], sourceField:dstaddr, lookupField:dstaddr, fields:{c, dst_instance_id=instance_id, dst_az_id=az_id}| fieldsAdd type=coalesce(if(isNull(dst_az_id), "Unknown"),if(az_id==dst_az_id, "in-AZ"),"x-AZ")| summarize {bandwidth=8*sum(bytes)/ (max(end)-min(start)) }, by:{ type }| fields type, bandwidth| sort bandwidth desc

5. Calculate the cross-zone communication cost
We can examine in detail how each availability zone communicates with the others. When you know the traffic volume, you can calculate the cost of communication between the availability zones. When this cost is too high, you should consider rearchitecting your deployment.
fetch logs| filter dt.system.bucket=="vpc_flow_logs" // bucket with data| filter account_id=="<your-account-id>" and vpc_id=="<vpc-id>" // specific AWS account and VPC| filter flow_direction=="egress" and traffic_path=="1" // sent and local traffic only| fieldsAdd bytes=toLong(bytes), start=toLong(start), end=toLong(end) // conversion to numeric types| lookup [fetch logs| filter dt.system.bucket=="vpc_flow_logs" // bucket with data| filter account_id=="<your-account-id>" and vpc_id=="<vpc-id>" // specific AWS account and VPC| filter flow_direction=="ingress"| summarize {c=count()}, by:{ dstaddr, instance_id, az_id}], sourceField:dstaddr, lookupField:dstaddr, fields:{c, dst_instance_id=instance_id, dst_az_id=az_id}| filterOut isNull(dst_az_id) or az_id==dst_az_id| summarize {bandwidth=8*sum(bytes)/ (max(end)-min(start)), bytes=sum(bytes) }, by:{ az_id, dst_az_id }| fields src_az_id=az_id, dst_az_id, bandwidth, bytes| fieldsAdd cost=bytes/(1024*1024*1024)*0.01 // calculated gigabytes multiplied by cost of transfer of single GB| sort bandwidth desc
| src_az_id | dst_az_id | bandwidth | bytes | cost |
|---|---|---|---|---|
| use1-az6 | use1-az4 | 633.8 Mbit/s | 135.781 GB | USD 1.4 |
| use1-az4 | use1-az6 | 563.6 Mbit/s | 121.155 GB | USD 1.2 |
| use1-az6 | use1-az2 | 525.6 Mbit/s | 112.596 GB | USD 1.1 |
| use1-az2 | use1-az4 | 456.8 Mbit/s | 97.749 GB | USD 1.0 |
| use1-az4 | use1-az2 | 448.3 Mbit/s | 96.420 GB | USD 1.0 |
| use1-az2 | use1-az6 | 439.6 Mbit/s | 94.070 GB | USD 0.9 |
6. Organize data by tags
Knowing AWS resource identification from VPC flow logs, we can connect networking data with the entity model in Dynatrace to create breakdowns—for example, by host groups or specific tags available for entities. In the following example, we find out how much traffic within availability zone ("in-AZ") and across availability zones ("x-AZ") is sent between differently tagged instances, meaning that they play specific roles in the infrastructure.
fetch logs| filter dt.system.bucket=="vpc_flow_logs" // bucket with data| filter account_id=="<your-account-id>" and vpc_id=="<vpc-id>" // specific AWS account and VPC| filter flow_direction=="egress" and traffic_path=="1" // sent and local traffic only| fieldsAdd bytes=toLong(bytes), start=toLong(start), end=toLong(end) // conversion to numeric types| lookup [fetch logs| filter dt.system.bucket=="vpc_flow_logs" // bucket with data| filter account_id=="<your-account-id>" and vpc_id=="<vpc-id>" // specific AWS account and VPC| filter flow_direction=="ingress"| summarize {c=count()}, by:{ dstaddr, instance_id, az_id}], sourceField:dstaddr, lookupField:dstaddr, fields:{c, dst_instance_id=instance_id, dst_az_id=az_id}// entity model lookup for src instances| lookup [fetch dt.entity.host| fieldsAdd tags, hostGroupName, iid=runs_on[dt.entity.ec2_instance]| filter matchesPhrase(tags,"[AWS]NodeType")| lookup [fetch dt.entity.ec2_instance], sourceField:iid, lookupField:id, fields:{ec2i=awsInstanceId}| expand tags| filter contains(tags, "[AWS]NodeType")| parse tags, "'[AWS]NodeType:' LD:nodeType"], sourceField:instance_id, lookupField:ec2i, fields:{srcNodeType=nodeType, hostGroupName }// entity model lookup for dst instances| lookup [fetch dt.entity.host| fieldsAdd tags, hostGroupName, iid=runs_on[dt.entity.ec2_instance]| filter matchesPhrase(tags,"[AWS]NodeType")| lookup [fetch dt.entity.ec2_instance], sourceField:iid, lookupField:id, fields:{ec2i=awsInstanceId}| expand tags| filter contains(tags, "[AWS]NodeType")| parse tags, "'[AWS]NodeType:' LD:nodeType"], sourceField:dst_instance_id, lookupField:ec2i, fields:{dstNodeType=nodeType }| filterOut isNull(hostGroupName) or isNull(dstNodeType)| summarize {bandwidth=8*sum(bytes)/ (max(end)-min(start)) }, by:{hostGroupName, srcNodeType, dstNodeType, in_AZ=(az_id==dst_az_id) }| summarize {in_AZ_bandidth=sum(if(in_AZ, bandwidth)), x_AZ_bandidth=sum(if(not(in_AZ), bandwidth))},by: {hostGroupName, srcNodeType, dstNodeType}
| hostGroupName | srcNodeType | dstNodeType | in_AZ_bandwidth | x_AZ_bandwidth |
|---|---|---|---|---|
| test_cluster_1 | DATABASE_TYPE_1 | DATABASE_TYPE_1 | 23.8 Kbit/s | 77.0 Mbit/s |
| test_cluster_1 | DATABASE_TYPE_1 | TIER_2 | 34.6 Mbit/s | 1.5 Kbit/s |
| test_cluster_1 | DATABASE_TYPE_2 | DATABASE_TYPE_2 | 11.5 Mbit/s | 87.8 Mbit/s |
| test_cluster_1 | DATABASE_TYPE_2 | TIER_2 | 15.2 Mbit/s | 26.8 Mbit/s |
| test_cluster_1 | TIER_1 | TIER_1 | 20.0 Kbit/s | 80.1 Kbit/s |
| test_cluster_1 | TIER_1 | TIER_2 | 26.7 Mbit/s | 28.1 Mbit/s |
| test_cluster_1 | TIER_2 | DATABASE_TYPE_1 | 39.8 Mbit/s | 1,020.3 bit/s |
| test_cluster_1 | TIER_2 | DATABASE_TYPE_2 | 173.2 Mbit/s | 284.3 Mbit/s |
| test_cluster_1 | TIER_2 | TIER_1 | 3.1 Mbit/s | 6.6 Mbit/s |
| test_cluster_1 | TIER_2 | TIER_2 | 544.2 Kbit/s | 2.9 Mbit/s |
| test_cluster_2 | DATABASE_TYPE_1 | DATABASE_TYPE_1 | 229.1Kbit/s | 214.8 Mbit/s |
| test_cluster_2 | DATABASE_TYPE_1 | TIER_2 | 119.5 Mit/s | 2.7 Kbit/s |
| test_cluster_2 | DATABASE_TYPE_2 | DATABASE_TYPE_2 | 13.3 Mbit/s | 22.6 Mbit/s |
| test_cluster_2 | DATABASE_TYPE_2 | TIER_2 | 25.4 Mbit/s | 58.5 Mbit/s |
| test_cluster_2 | TIER_1 | TIER_1 | 0.0 bit/s | 56.1 Kbit/s |
| test_cluster_2 | TIER_1 | TIER_2 | 43.2 Mbit/s | 15.6 Mbit/s |
| test_cluster_2 | TIER_2 | DATABASE_TYPE_1 | 91.7 Mbit/s | 1.8 Kbit/s |
| test_cluster_2 | TIER_2 | DATABASE_TYPE_2 | 14.9 Mbit/s | 25.5 Mbit/s |
| test_cluster_2 | TIER_2 | TIER_1 | 22.0 Mbit/s | 36.9 Mbit/s |
| test_cluster_2 | TIER_2 | TIER_2 | 1.9 Mbit/s | 7.5 Mbit/s |
Conclusion
By implementing the steps outlined in this guide, you'll have taken a proactive approach to cloud cost management with Dynatrace.
- This practice equips a CloudOps professional with the necessary tools to analyze, monitor, and optimize your cloud deployment effectively.
- The result is a more efficient, cost-effective cloud infrastructure aligned with your organization's financial objectives.
To further enhance your skills and understanding, we encourage you to explore additional resources and continue refining your approach to cloud cost optimization.
