HTTP monitor metrics in Synthetic Monitoring
- Latest Dynatrace
- Reference
Metrics and dimensions
Monitor
| Metric key | Metric name | Metric description | Unit | Dimensions |
|---|---|---|---|---|
| Availability rate (by location) [HTTP monitor] | The availability rate of HTTP monitors. | % |
|
| DNS lookup time (by location) [HTTP monitor] | The time taken to resolve the hostname for a target URL for the sum of all requests. | ms |
|
| Download time (by location) [HTTP monitor] | The time taken to download the HTTP response for the sum of all steps. This metric isn't based on the metric in Synthetic Classic. | ms |
|
| Duration (by location) [HTTP monitor] | The duration of the sum of all requests. | ms |
|
| Duration threshold [HTTP monitor] | The performance threshold for the sum of all requests. | ms |
|
| Execution count (by status) [HTTP monitor] | The number of monitor executions. The | count |
|
| Response size (by location) [HTTP monitor] | The response size of the sum of all requests. | By |
|
| TCP connect time (by location) [HTTP monitor] | The time taken to establish the TCP connection to the server (including SSL) for the sum of all requests. | ms |
|
| Time to first byte (by location) [HTTP monitor] | The time taken until the first byte of the response is received from the server, relevant application caches, or a local resource. Calculated for the sum of all steps. | ms |
|
| TLS handshake time (by location) [HTTP monitor] | The time taken to complete the TLS handshake for the sum of all requests. | ms |
|
| Redirects count (by location) [HTTP monitor] | The number of redirects for the sum of all requests. | count |
|
| Redirects Time (by location) [HTTP monitor] | The time taken to complete the redirects for the sum of all requests. | ms |
|
| Waiting time (by location)[HTTP monitor] | The time taken for the server to respond with the first byte for the sum of all steps. This metric isn't based on the metric in Synthetic Classic. | ms |
|
Steps
| Metric key | Metric name | Metric description | Unit | Dimensions |
|---|---|---|---|---|
| DNS lookup time (by request, location) [HTTP monitor] | The time taken to resolve the hostname for a target URL for individual HTTP requests. | ms |
|
| Download time (by step, location) [HTTP monitor] | The time taken to resolve the hostname for a target URL for individual HTTP steps. This metric isn't based on the metric in Synthetic Classic. | ms |
|
| Duration (by request, location) [HTTP monitor] | The duration of individual HTTP requests. | ms |
|
| Execution count (request) [HTTP monitor] | The number of request executions. | count |
|
| Response size (by request, location) [HTTP monitor] | The response size of individual HTTP requests. | By |
|
| TCP connect time (by request, location) [HTTP monitor] | The time taken to establish the TCP connection to the server (including SSL) for individual HTTP requests. | ms |
|
| Time to first byte (by request, location) [HTTP monitor] | The time taken until the first byte of the response is received from the server, relevant application caches, or a local resource. Calculated for individual HTTP requests. | ms |
|
| TLS handshake time (by request, location) [HTTP monitor] | The time taken to complete the TLS handshake for individual HTTP requests. | ms |
|
| Redirects count (request) [HTTP monitor] | The number of redirects. | count |
|
| Redirects Time (request) [HTTP monitor] | The time taken to complete the redirects. | ms |
|
| Waiting time (step) (by location) [HTTP monitor] | The time taken for the server to respond with the first byte. This metric isn't based on the metric in Synthetic Classic. | ms |
|
Deprecated
| Metric key | Metric name | Metric description | Unit | Dimensions |
|---|---|---|---|---|
| Availability rate excluding maintenance windows (by location) [HTTP monitor] | The availability rate of HTTP monitors excluding maintenance windows. The metric doesn't exist in the latest Dynatrace. | % |
|
Use cases
The following use cases show how you can use the metrics in your DQL queries.
Track monitor availability
Suppose you need to identify monitors that have availability issues.
The following query uses the dt.synthetic.http.availability metric and the dt.entity.http_check dimension to return the monitors sorted by their availability, with the least available monitors listed first.
timeseries {availability_series = avg(dt.synthetic.http.availability) },by:{ dt.entity.http_check }| fieldsAdd monitor_name = entityName(dt.entity.http_check)| summarize { monitor_name = takeFirst(monitor_name),availability = avg(arrayAvg(availability_series)) },by: {dt.entity.http_check}| sort availability asc
The raw response looks like this:
{"records": [{"dt.entity.http_check": "HTTP_CHECK-D1DF6416D98DF200","monitor_name": "HTTP monitor","availability": 0},{"dt.entity.http_check": "HTTP_CHECK-DD85DA9C14659614","monitor_name": "HTTP monitor2","availability": 31.746031746031743},{"dt.entity.http_check": "HTTP_CHECK-ADA43EC2FFF9115D","monitor_name": "HTTP monitor3","availability": 46.03174603174603},{"dt.entity.http_check": "HTTP_CHECK-0135CB5835BEAEA8","monitor_name": "HTTP monitor4","availability": 100},
Identify the most problematic locations
Suppose you need to identify the locations with the lowest availability and the slowest average response time for HTTP requests.
The following query uses the dt.synthetic.http.request.duration and dt.synthetic.http.availability metrics and the dt.entity.synthetic_location dimension.
timeseries {availability_series = avg(dt.synthetic.http.availability),performance_series = avg(dt.synthetic.http.request.duration) },by:{ dt.entity.synthetic_location }| fieldsAdd location_name = entityName(dt.entity.synthetic_location)| summarize { location_name = takeFirst(location_name),availability = avg(arrayAvg((availability_series))),request_duration = avg(arrayAvg(performance_series))},by: {dt.entity.synthetic_location}| sort availability asc, request_duration desc
The raw response looks like this:
{{"records": [{"dt.entity.synthetic_location": "SYNTHETIC_LOCATION-00000000000003B3","location_name": "Las Vegas","availability": 23.809523809523807,"request_duration": 2662.3457875457875},{"dt.entity.synthetic_location": "SYNTHETIC_LOCATION-0000000000000004","location_name": "Amazon US East (N. Virginia)","availability": 60.714285714285715,"request_duration": 1297.4880952380952},{"dt.entity.synthetic_location": "SYNTHETIC_LOCATION-2D4A33F9E13D70E7","location_name": "Oslo","availability": 66.66666666666667,"request_duration": 1114.1904761904761},{"dt.entity.synthetic_location": "SYNTHETIC_LOCATION-0000000000000064","location_name": "Gdańsk","availability": 70,"request_duration": 294.2772881374772},{"dt.entity.synthetic_location": "SYNTHETIC_LOCATION-9FFF47C604374908","location_name": "Dublin","availability": 72.06349206349208,"request_duration": 1146.2952380952381},
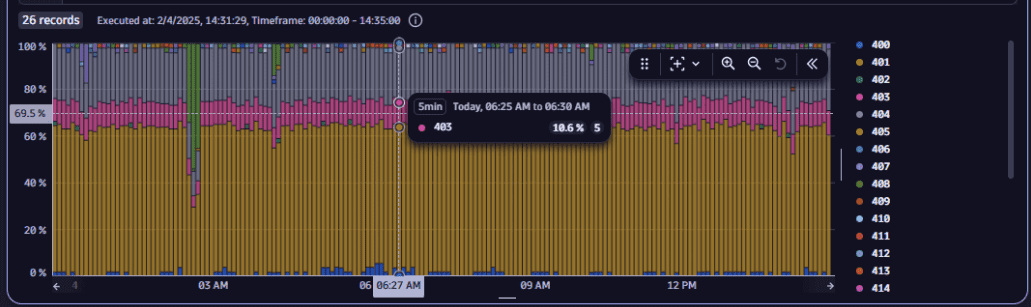
Identify status codes retrieved during test executions
Suppose you need to identify the error status codes (>= 400) retrieved during test executions.
The following query uses the dt.synthetic.http.executions metric and the result.http_status.code dimension.
timeseries {execution_series = sum(dt.synthetic.http.executions)}, by:{ result.http_status.code }| filter result.http_status.code >= 400| summarize { executions = sum(execution_series[]),status.code = toString(takeFirst(result.http_status.code)) },by: { timeframe, interval, result.http_status.code}
The visualized response looks like this: