Manage private locations
- Latest Dynatrace
- How-to guide
To view and manage private locations, go to the Private locations tab in  Synthetic.
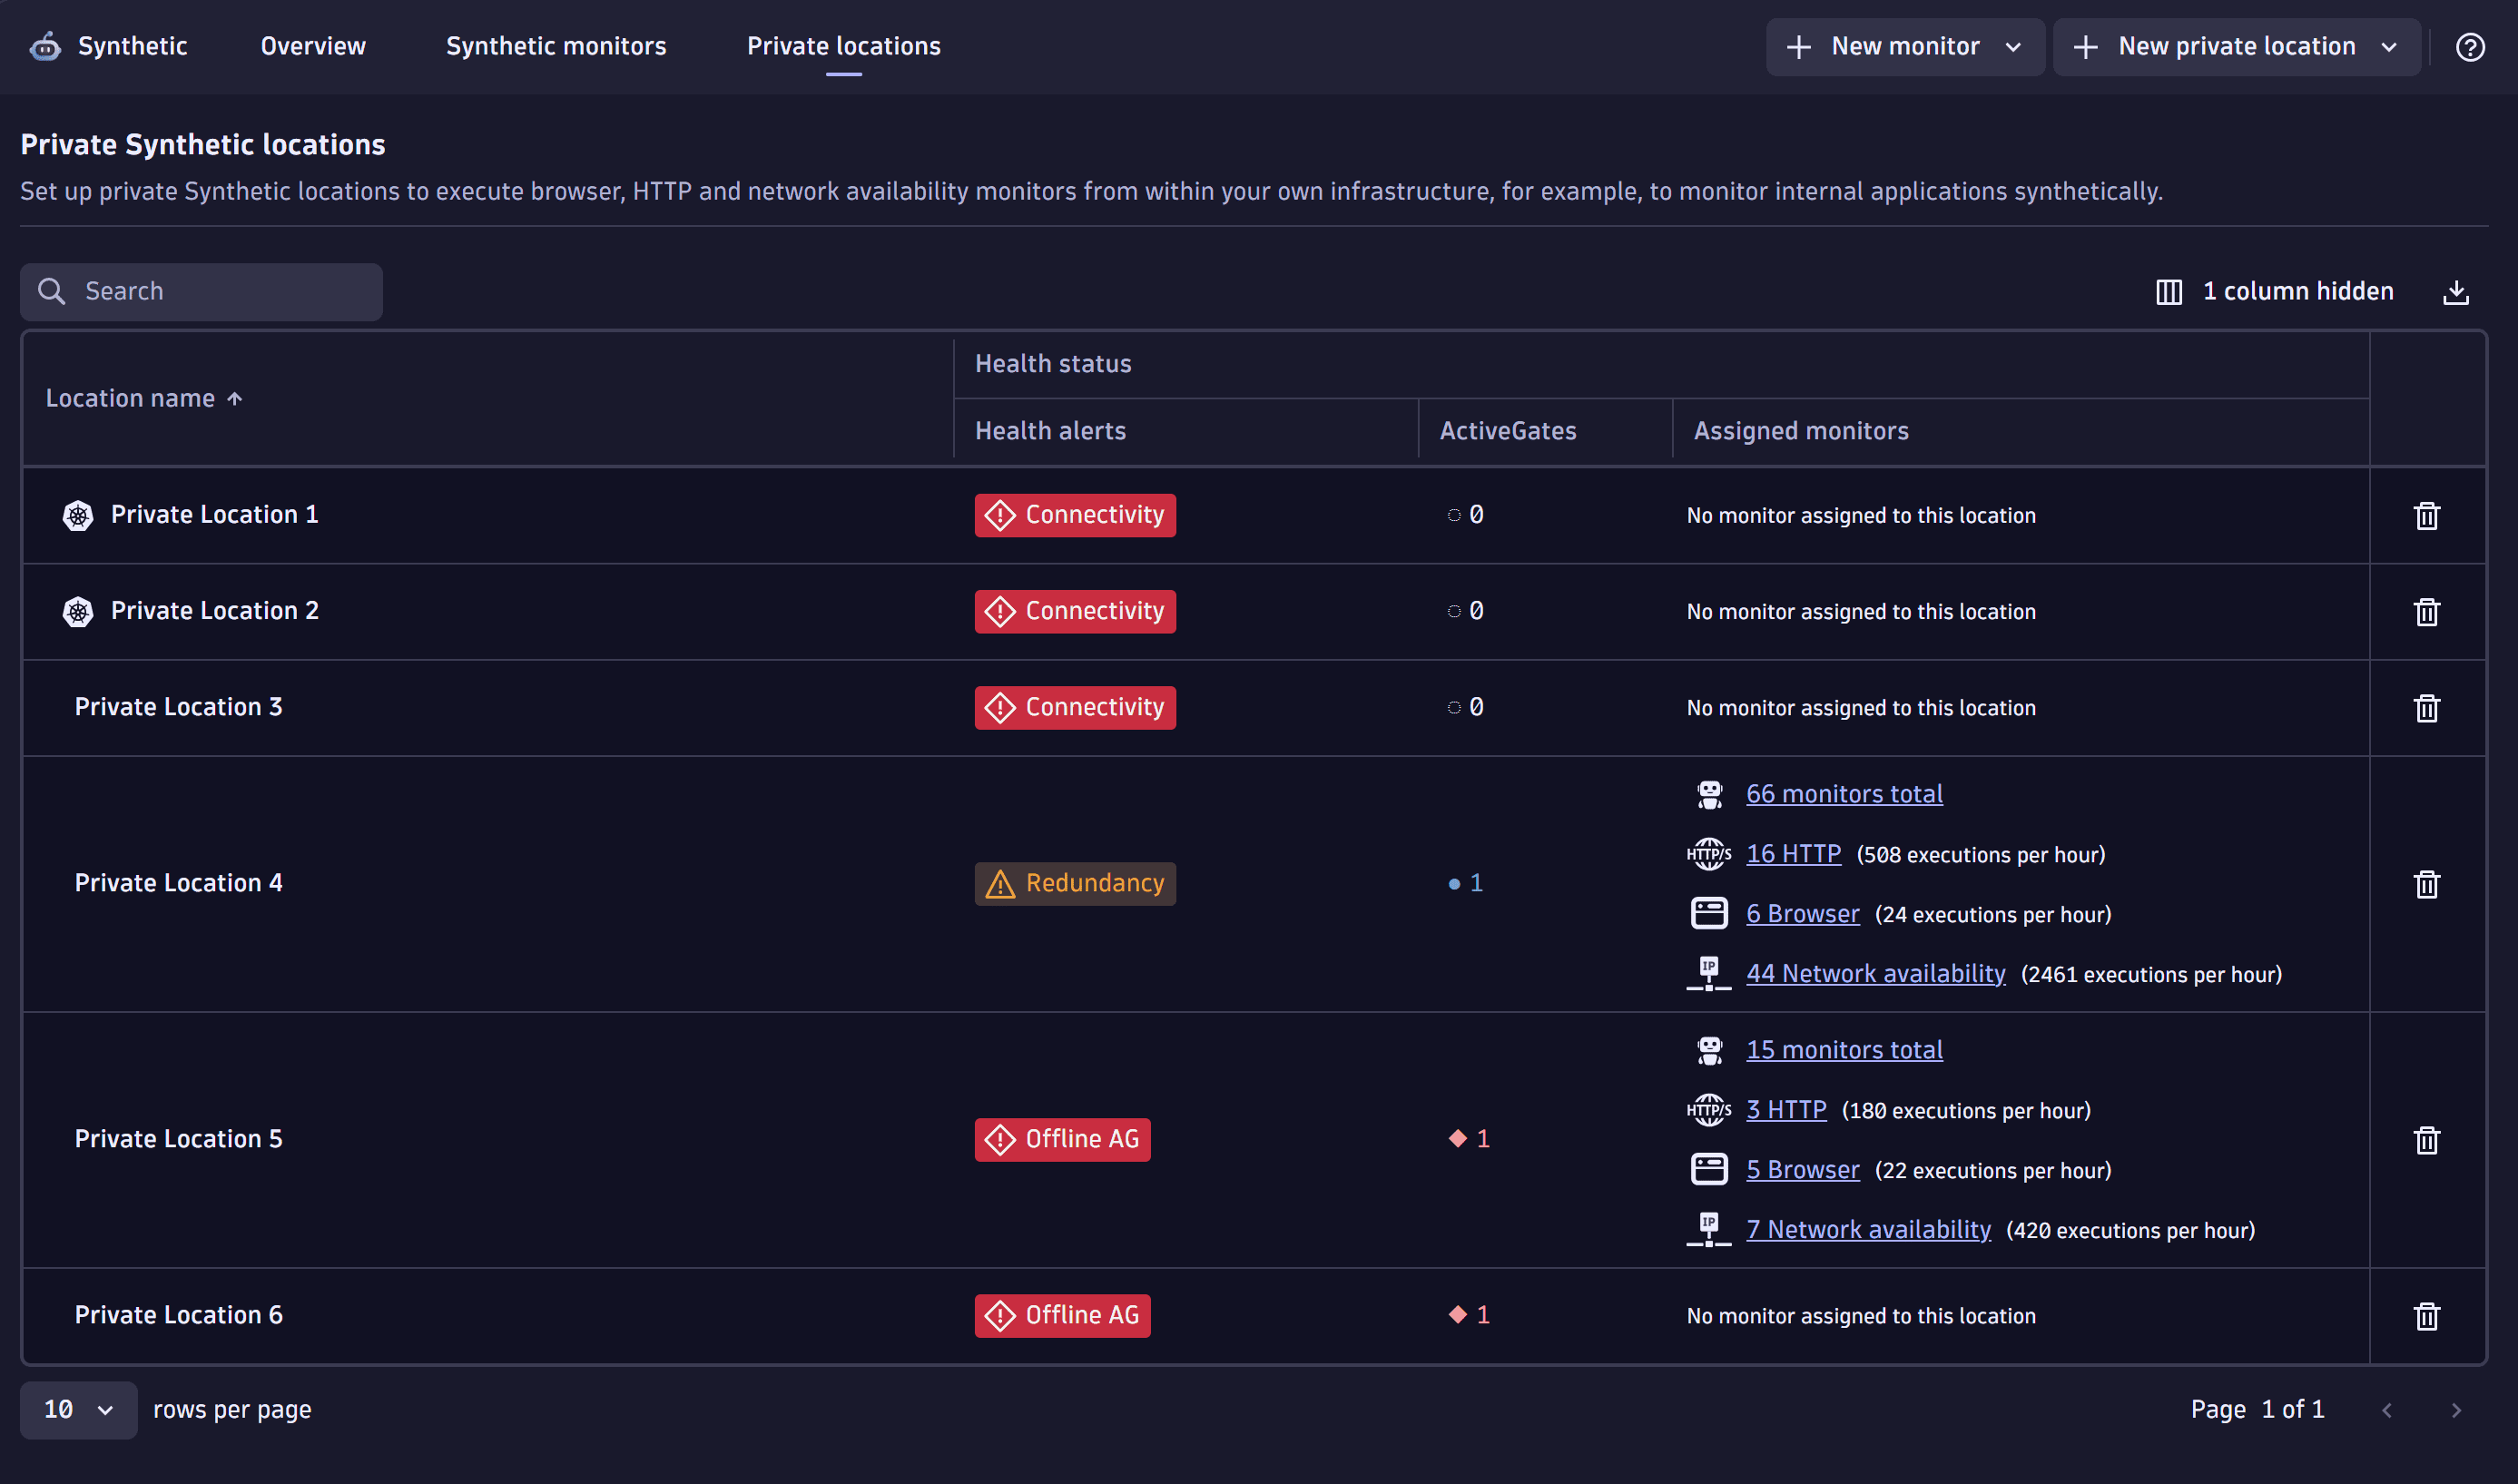
Health status
In the Health status column of the Private Synthetic locations list, you can see ActiveGates health status for each private location in your environment. The column has three sub-columns:
-
Health alerts—the alerts display reasons behind ActiveGates health issues. The alerts are also highlighted with colored indicators depending on issues severity:
-
Yellow:
- Capacity—the capacity usage of at least one type of Synthetic monitors is more than 80%.
- Redundancy—if any ActiveGate is down, it can result in the private location being used beyond its maximum capacity.
- Compatibility—at least one ActiveGate doesn't support at least one monitor type assigned to the location. For details, point to the (Warning) in the Assigned monitors column.
-
Red:
- Capacity—the capacity usage of at least one type of Synthetic monitors is more than 90%.
- Offline AG—at least one ActiveGate is down.
- Connectivity—the private location is down. It happens when no ActiveGates are assigned to the private location.
- Discarded—there is at least one discarded monitor execution in the last 30 minutes.
-
-
ActiveGates—number of ActiveGates assigned to a location by their health status. Health status is indicated by one of the following colors:
- Green—no ActiveGates with issues.
- Yellow—one or more ActiveGates experience issues that are still not serious but might require attention.
- Red—one or more ActiveGates experience serious issues that require immediate attention.
-
Assigned monitors—the type and number of Synthetic monitors assigned to the location. The number of HTTP monitors also includes HTTP High Resource monitors.
Even when there are no reported issues related to any of the location's ActiveGates, the following behavior may be observed:
- The
dt.sfm.synthetic.location.health_statusmetric shows theFAILOVER_WARNINGalert for the location. - The Health alerts column shows the yellow Redundancy alert for the location in the UI.
This happens if Dynatrace determines that, if the busiest ActiveGate went down, the remaining capacity would fall below the safe limit.
For each monitor type, Dynatrace:
-
Collects the following load/utilization data for the last 30 minutes using these metrics:
- ActiveGate load:
dt.sfm.location.executionsmetric value per monitor type. - ActiveGate utilization:
dt.sfm.synthetic.__monitor_type__.engine_utilizationmetric value. For example, for browser monitors, the metric isdt.sfm.synthetic.browser.engine_utilization.
- ActiveGate load:
-
Identifies the busiest ActiveGate (the ActiveGate with the highest load in the last 30 minutes).
-
Analyzes the total count of executions made by the location's monitors in the last 30 minutes.
-
Calculates how much capacity would be left if the busiest ActiveGate went down. If, for at least one monitor type, the remaining ActiveGates would have to handle more than 95% of executions made by the location's monitors in the 30-minutes period, the remaining capacity is below the safe limit, and the alert is displayed.
See location details and edit location
Select a location to see its details and edit it. For classic locations, you can see ActiveGates assigned to the locations. They are listed and displayed in red when a Synthetic engine or an ActiveGate itself is offline; the Status column shows a corresponding message.
You can see the ActiveGate ID in the column that is hidden by default. To display it, select the columns icon > ActiveGate ID > Apply.
You can add or delete ActiveGates from the location details page. You can also make other changes and select Save to save them.
Diagnostics
The Diagnostics card displays the health status for each monitor type.
- Capacity usage—the capacity usage for a monitor type. If the capacity usage is less than 80%,
OKis displayed in the column, and if there is no data,0is displayed. - Compatibility—the number of ActiveGates that support a monitor type. For example, if there are three ActiveGates assigned to the location, but only two of them support the monitor type, you will see
2/3. - Monitors—the number of monitors by type assigned to the location.
- Executions/hour—the number of executions per hour for a monitor type.
- ActiveGates—the number of ActiveGates assigned to the location. This also includes the number of those ActiveGates that are offline. For example, if there are three ActiveGates assigned to the location, but one of them is offline, you will see
1/3.
For Capacity usage, Compatibility, and ActiveGates, the health status is additionally indicated by one of the following colors:
- Green—no issues.
- Yellow—there are issues that are not yet serious but might require attention.
- Red—there are serious issues that require immediate attention.
Metrics for health status
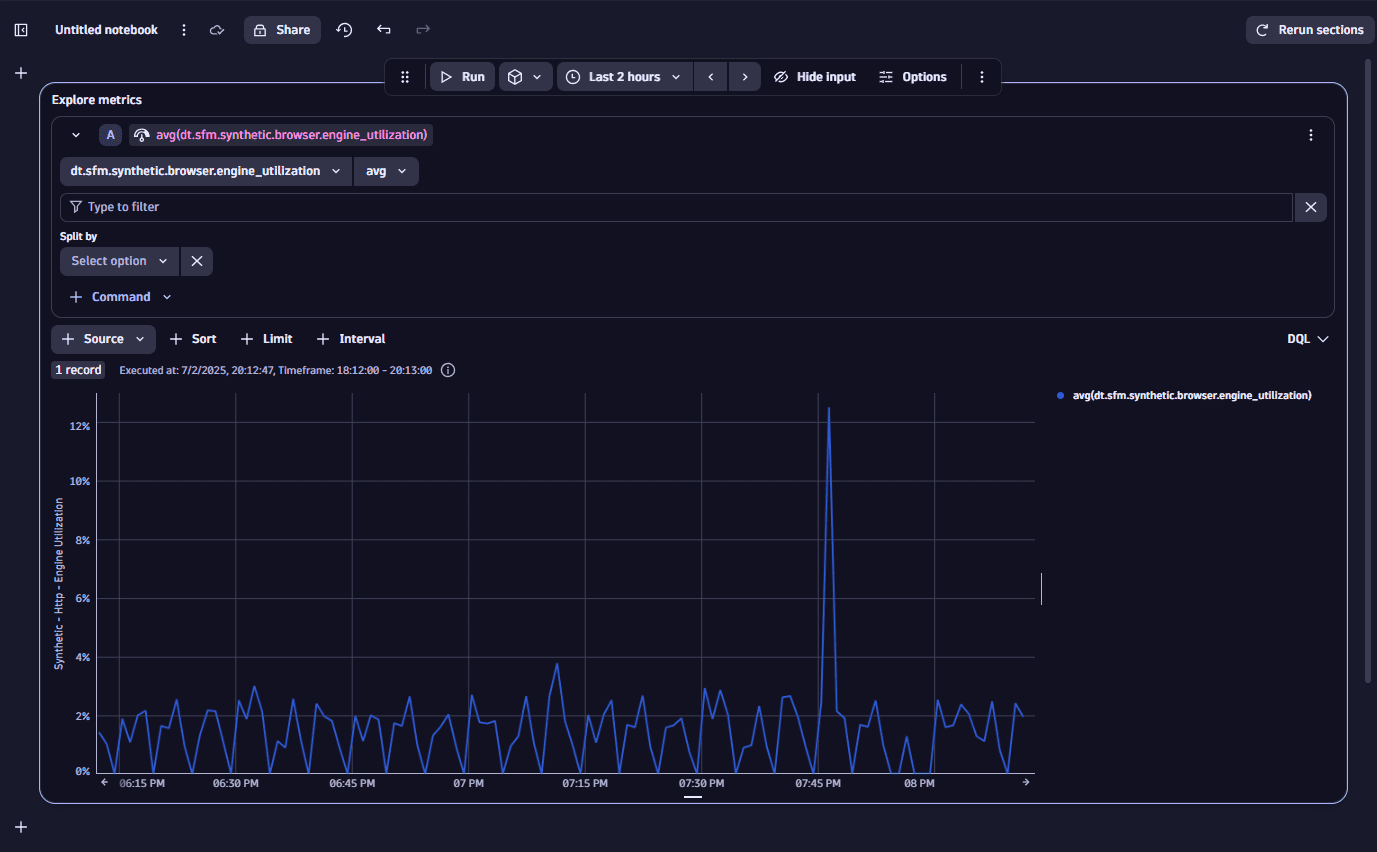
Metrics for the health status of each monitor type are available for charting and alerting. Metrics for charting and alerting on the health status of each monitor type are available in  Notebooks. For example, you can choose the following metrics for charting and alerting:
- Synthetic - HTTP - Engine Utilization
- Synthetic - HTTP High Resource - Engine Utilization
- Synthetic - Browser - Engine Utilization
We strongly recommend splitting these metrics by location to get an accurate view of location health.
Location outage handling
For each location, enable the corresponding switches to generate problems when a location or any of its ActiveGate engines are unavailable. The following switches are currently available:
-
You can generate a problem when the entire private location is unavailable (all ActiveGates are offline), or if the location lacks the capability required for the monitor type to be executed.
-
You can generate a problem when a single ActiveGate at this location is offline.
For example, suppose your location has two ActiveGates, and you enable both problem switches. You will see three problems when your location is unavailable—one for the entire location and one for each ActiveGate that's offline.
For containerized locations, you can only generate a problem when the entire private location is unavailable (all ActiveGates are offline), or if the location lacks the capability required for the monitor type to be executed.