Browser monitors reporting results
- Latest Dynatrace
- Reference
- 15-min read
The browser monitors reporting provides:
- Preview panel—displays monitor execution results, problems, errors, and monitor properties. It features at-a-glance information with ready links to drill right down to problem details and edit monitor settings.
- Reporting results page—displays more detailed information including result visualizations like charts and tables that show availability and performance metrics for the monitor in the selected timeframe.
- Analyze executions—allows you to analyze individual monitor executions in detail.
To display browser monitor results
- Go to
 Synthetic.
 - Optional To filter the table for browser monitors, select Browser under Filter options on the left.
- From the list of browser monitors, select the monitor you want to examine. This displays a preview panel on the right.
- To access the details page, select View details in the upper-right of the preview panel.
Metric visualizations
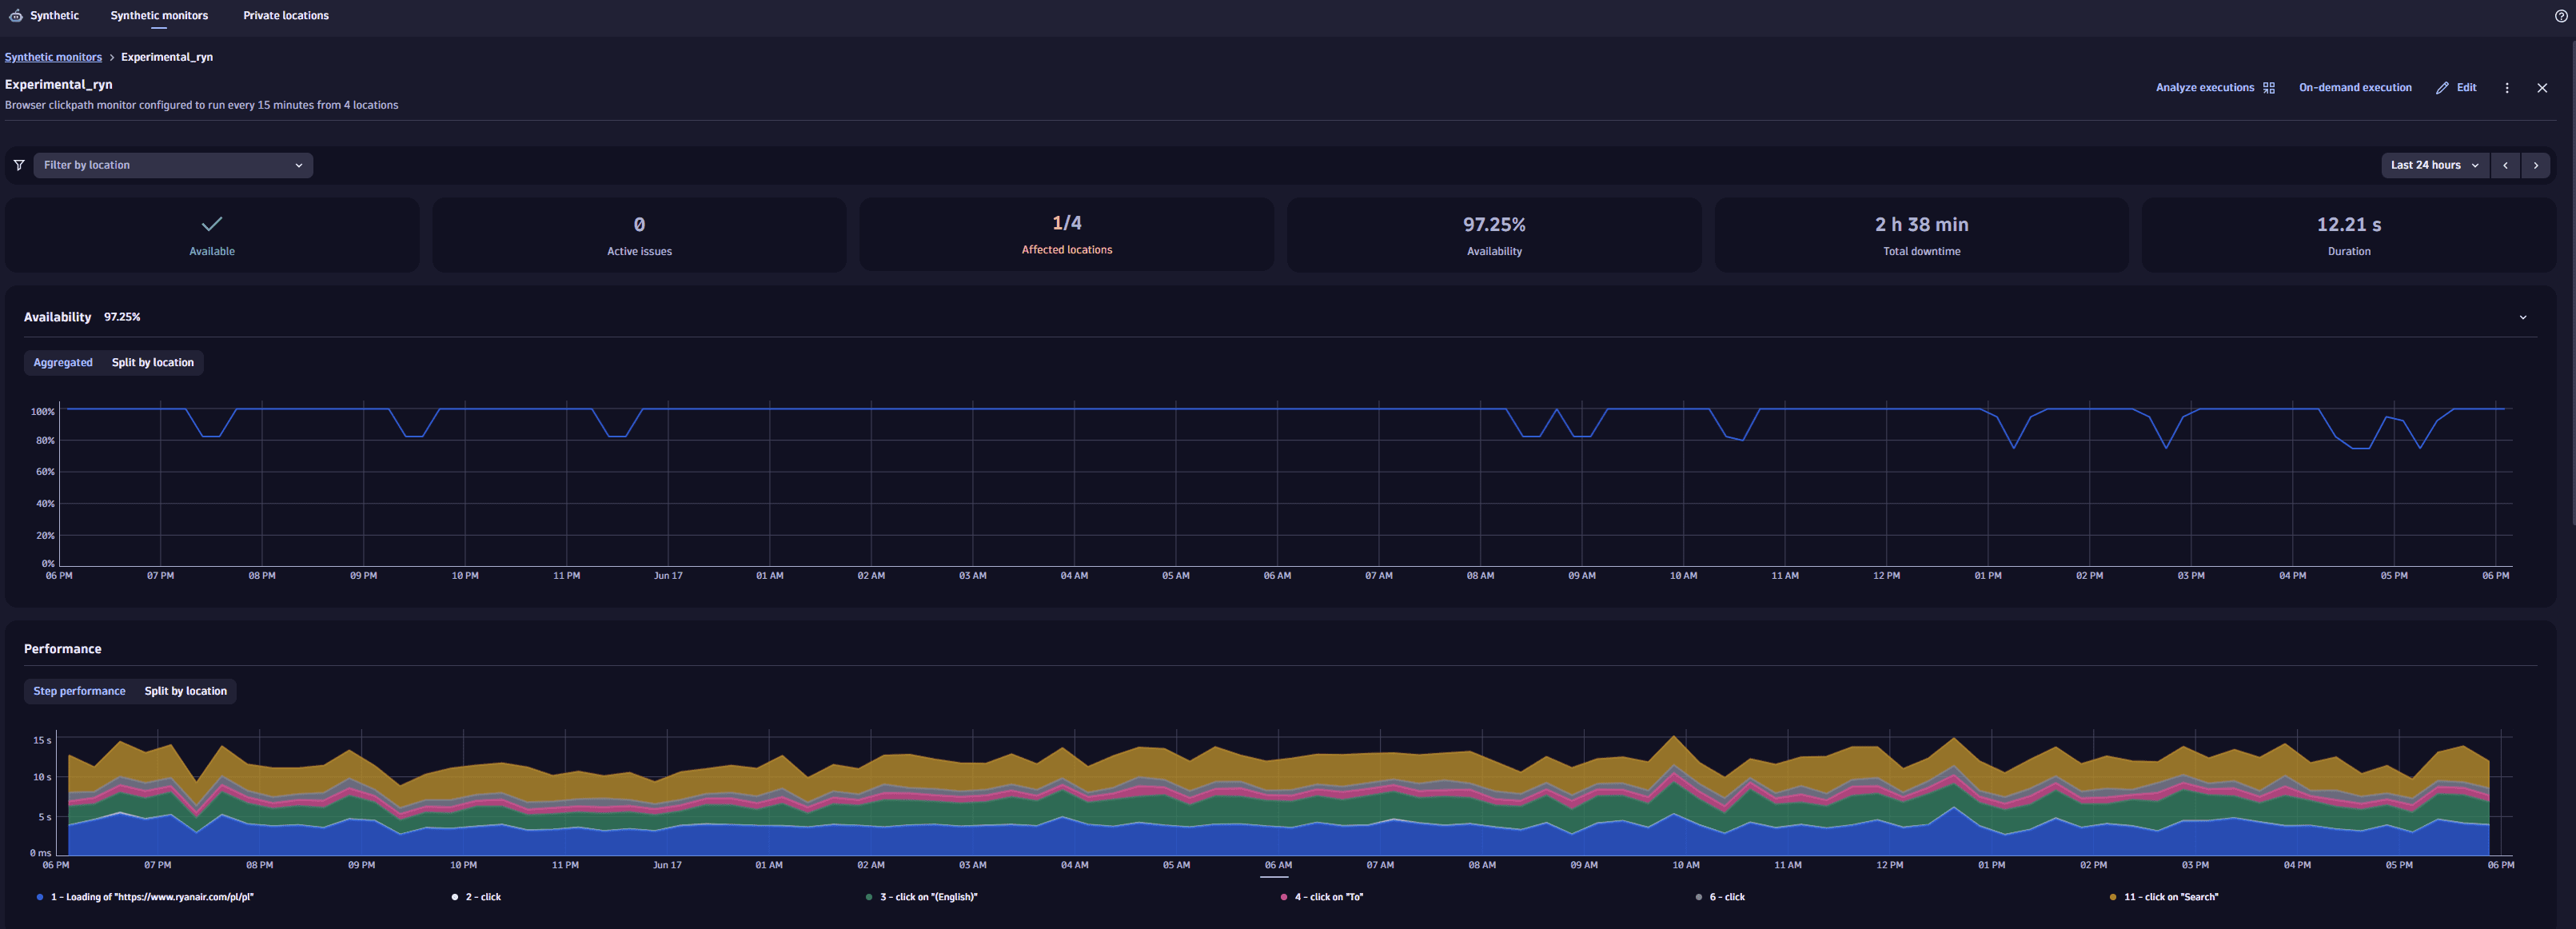
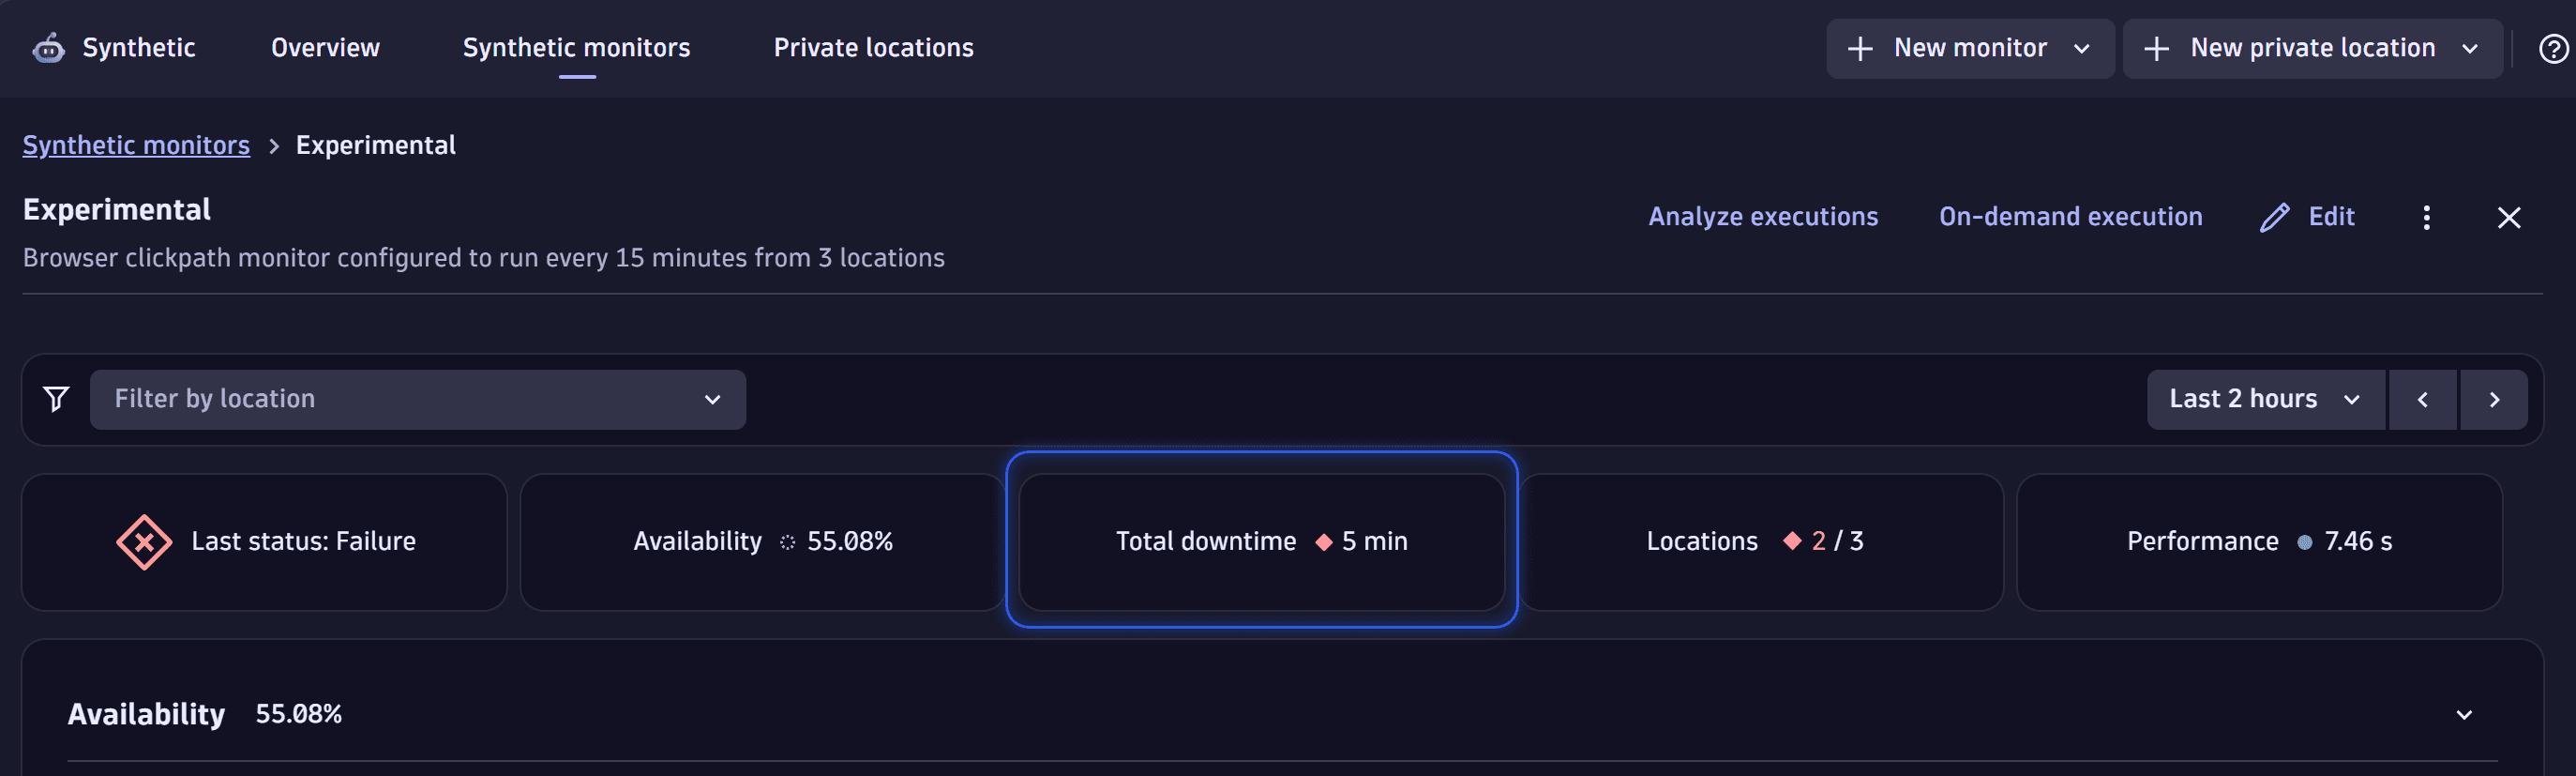
The top panel shows overall monitor availability and performance for the selected timeframe.
Use the filter bar at the top of the page to filter browser monitor executions by one or more locations.
Under the filter bar, you can see tiles for important information:
- Outage/Available/No data—the monitor availability status at the moment of the last executed test.
- Active issues—the number of issues being observed at the moment.
- Affected locations—the number of locations where outages happened in a specific timeframe.
- Availability—the monitors availability rate in percent in a specific timeframe.
- Total downtime—the total outage time for all locations in a specific timeframe.
- Duration—the average response time for all locations in a specific timeframe.
In the upper-right corner of the page, you can access Analyze executions, On-demand execution, and more browser monitor settings:
- Edit
- for more options ( Disable and Delete)
Availability
The Availability card displays the monitor's availability for the selected timeframe, either aggregated for all locations or for each location separately. It contains information about all availability problems related to the given monitor, maintenance windows, and unfinished executions. The problems are displayed as bar-shaped notifications over the availability chart. They provide the problem details and mark the period when the problem occurred.
Also, if the monitor is down (unavailable) at one or more locations, the outage (downtime) duration and affected locations are displayed in the metric visualizations above the Availability card.
A monitor can be down at one or all locations. Several downtimes may occur in a given timeframe. Their durations are summarized to calculate the total outage (downtime) duration. Overlapping downtimes are not counted.
Availability calculation
Availability metrics are calculated by dividing the number of successful executions ("up") by the total number of executions
-
Determine the number of up executions in the timeframe.
This is the total number of executions in the timeframe, minus the number of failed ("down") executions in the timeframe.
-
Determine availability.
Divide the number of up executions by the total number of executions, and then multiply by 100 to get a percentage.
Example
Suppose we have 5 down executions in a 35-minute timeframe.
- Total executions =
35. - Down executions =
5. - Up executions =
35-5 = 30. - Availability =
(30/35) \* 100 = 0.8571 \* 100=85.71 percent.
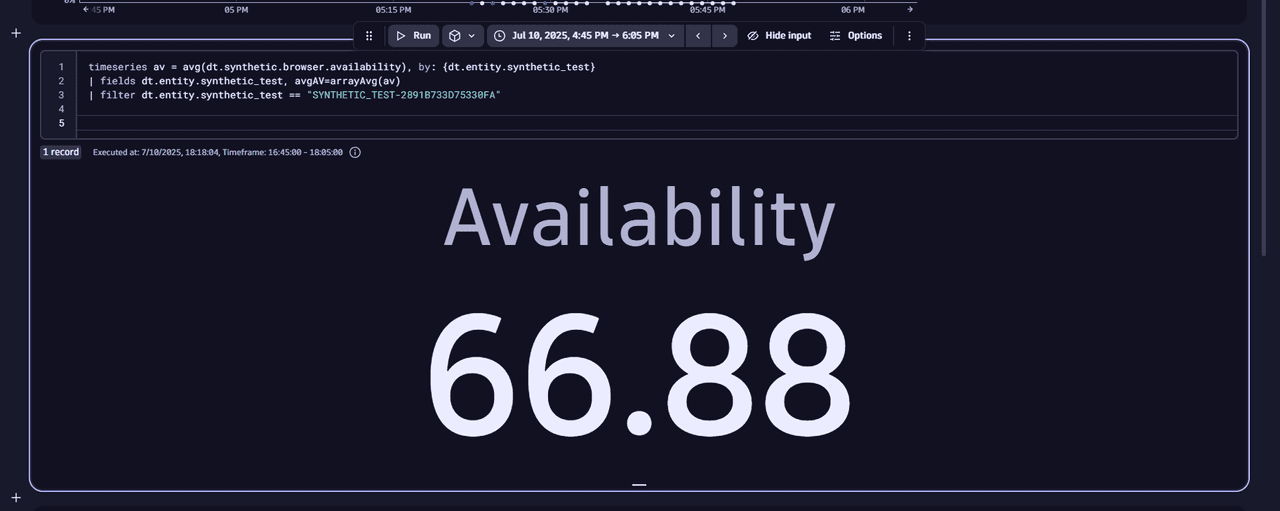
Exclude maintenance period executions from metrics calculations
You can set up a maintenance window so test executions are not suppressed during maintenance periods. Then, if outages happen during the maintenance period, down executions are included in the metrics calculations.
In the example below, the availability is less than 100% because the down executions are included in the metric calculation by default.
timeseries av = avg(dt.synthetic.browser.availability), by: {dt.entity.synthetic_test}| fields dt.entity.synthetic_test, avgAV=arrayAvg(av)| filter dt.entity.synthetic_test == "SYNTHETIC_TEST-2891B733D75330FA"
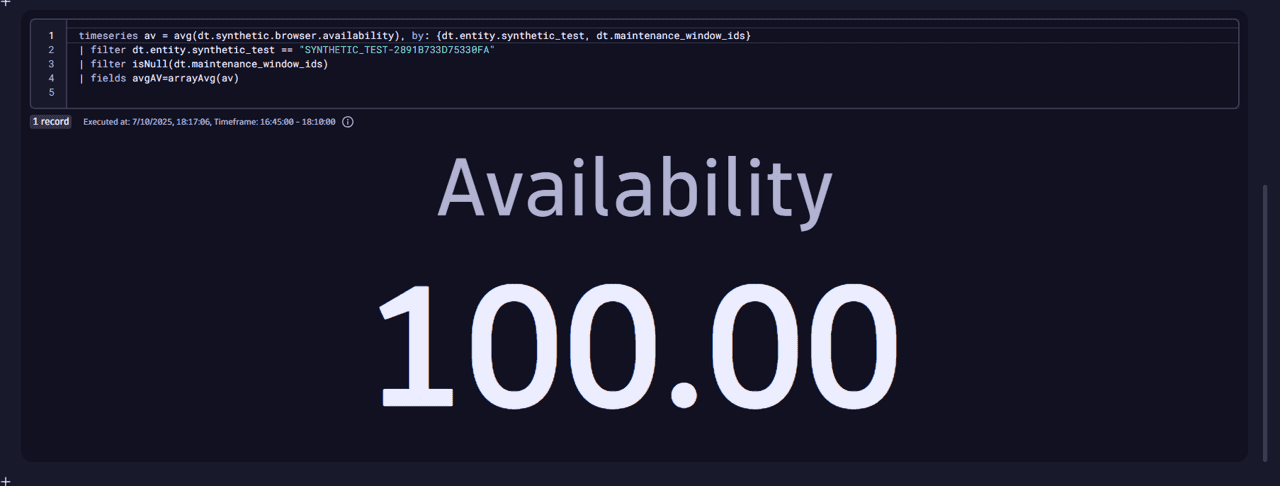
To exclude the maintenance period executions from the metric calculation
- Add the
dt.maintenance_window_idsdimension to the query. - Filter the executions that are not covered by the maintenance window with
isNull(dt.maintenance_window_ids).
In the example below, we observed down executions during the maintenance period. However, they were not included in the calculation metric because we used the dt.maintenance_window_ids dimension along with the isNull(dt.maintenance_window_ids) filter condition.
timeseries av = avg(dt.synthetic.browser.availability), by: {dt.entity.synthetic_test, dt.maintenance_window_ids}| filter dt.entity.synthetic_test == "SYNTHETIC_TEST-2891B733D75330FA"| filter isNull(dt.maintenance_window_ids)| fields avgAV=arrayAvg(av)
Interpolation
The approach described above requires all executions to happen at the same rate. However, in a real-world environment this is not always the case as the monitor execution frequency may change or additional on-demand executions may be triggered.
To make the calculation more accurate, the interpolation mechanism is introduced: the total monitoring time is divided into minute-level data points. All data points count as executions, although they don't necessarily coincide with actual executions.
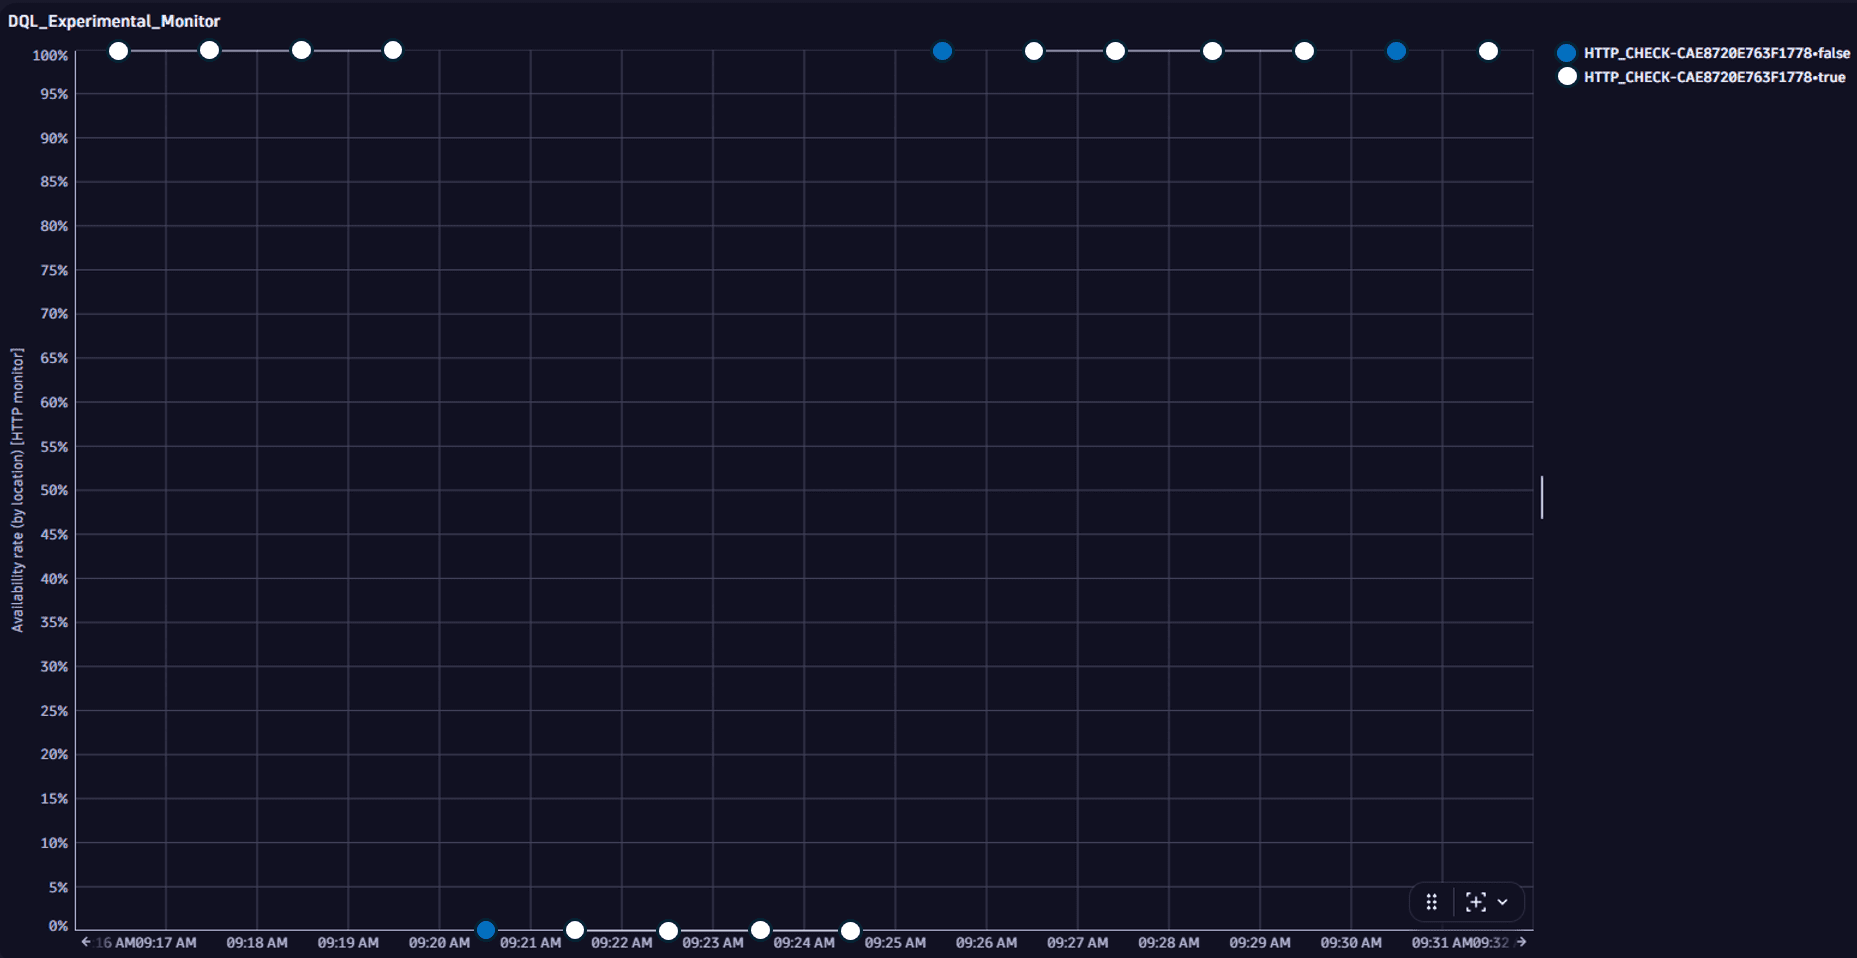
To see interpolated data points, add the interpolated dimension to the query.
timeseries avg(dt.synthetic.browser.availability), by:{dt.entity.synthetic_test, interpolated}| filter dt.entity.synthetic_test == "SYNTHETIC_TEST-7E0A1CF206C4A1C5"
The result below shows the blue data points that coincide with actual executions, and the white data points which don't.
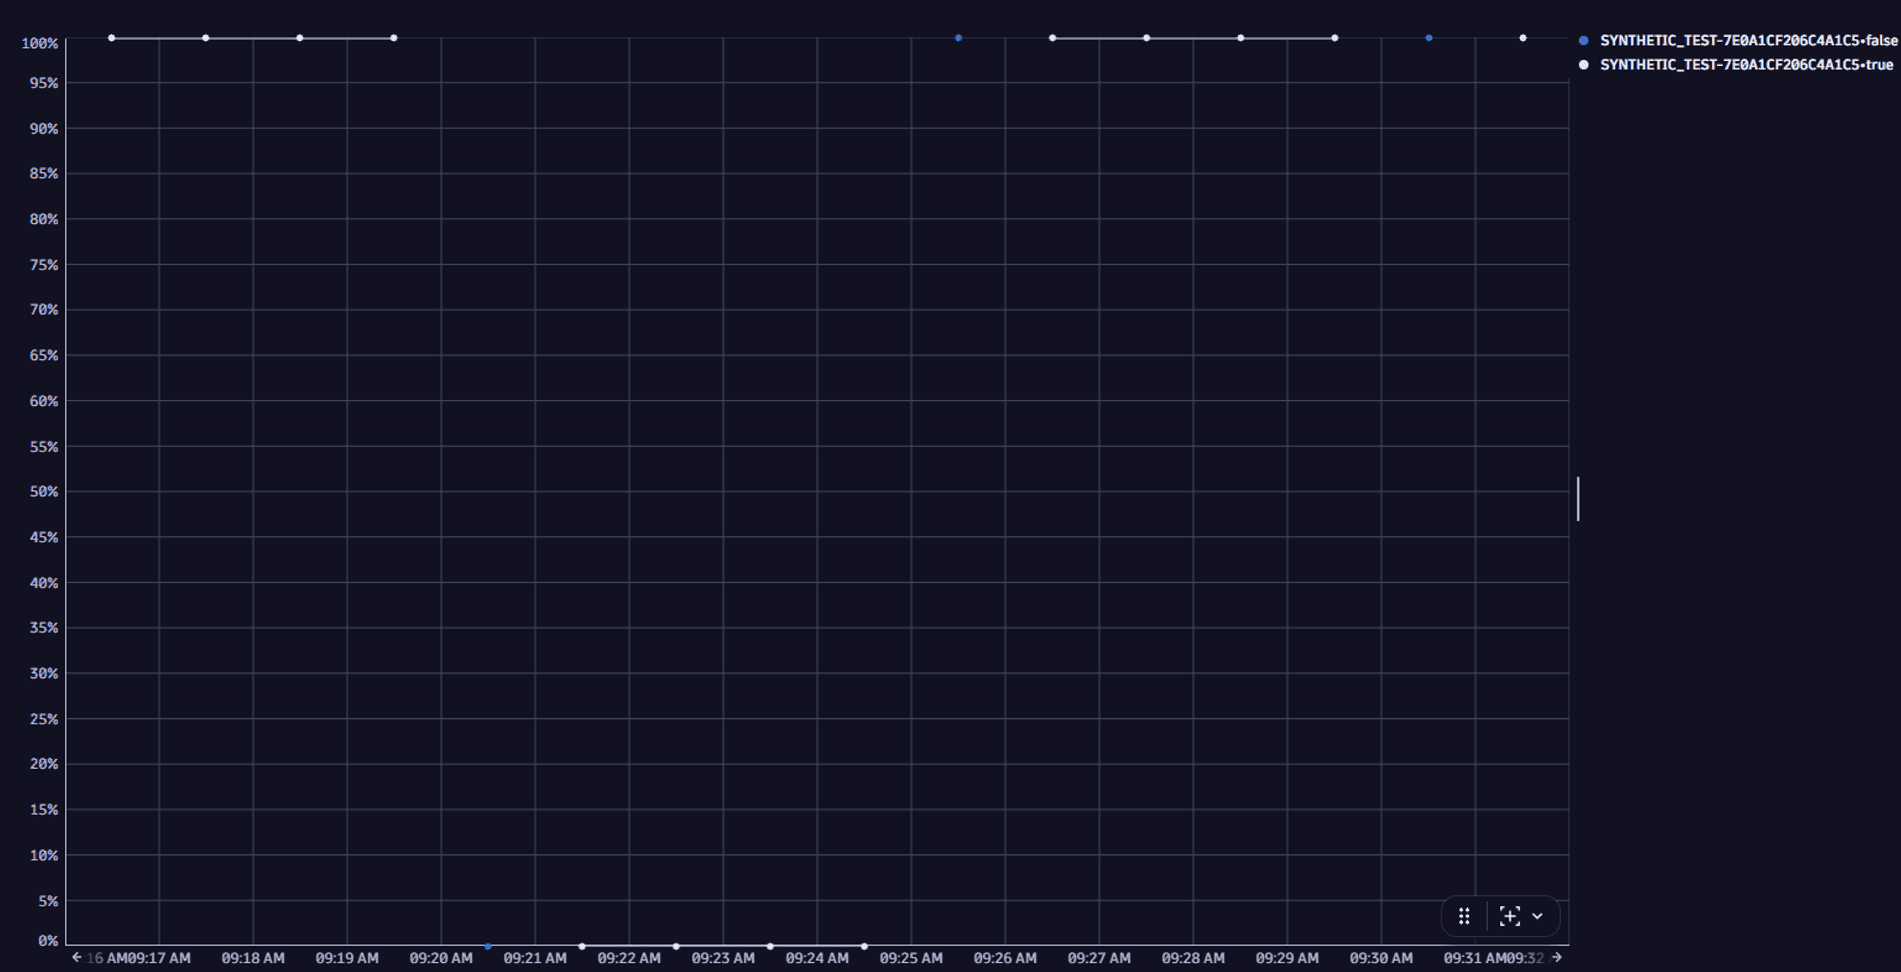
Let's imagine a monitor is set to execute tests every five minutes. So, every fifth data point (blue) coincides with an actual execution. All data points following the first down execution and preceding the first up execution count as "down". Thus, when calculating the availability metrics, the number of down executions is calculated as follows:
Down executions = the first actual down execution + all following "down" data points.
Total downtime calculation
The total monitoring time is divided into minute-level data points. All data points count as executions, although they don't necessarily coincide with actual executions.
In the following example, the blue data points coincide with actual executions, and the white data points don't.
For example, if a monitor is set to execute tests every five minutes, every fifth data point (blue) coincides with an actual execution. All data points following the first failed ("down") execution and preceding the first successful ("up") execution count as "down." Thus, the total downtime is calculated as follows:
Total downtime = the first actual down execution + all following down data points.
Notifications over availability chart
Also, the Availability card displays notifications over the availability chart. The notifications show details of a maintenance window, outages, and not executed or finished tests. A notification is displayed as a bar above the timeframe when a maintenance window was applied, an outage occurred, or some tests were not executed or finished. Hover over the bar to see the details:
-
Browser monitor local outage—the outage happened in one or more locations from which the monitor executed the tests.
-
Browser monitor global outage—the outage happened in all locations from which the monitor executed the tests.
Local and global outage - view problem detailsTo see the details of the problem
-
Select the bar to pin the Browser monitor local outage or Browser monitor global outage tooltip.
-
Hover over the tooltip.
-
Select View problem details.
-
Select one of the available options:
- Problems to see the problem details in Latest Dynatrace
- Problems Classic to see the problem details in Dynatrace Classic
-
-
Maintenance window—a maintenance window was on in the timeframe.
How to see the maintenance window, and what happens if the monitor execution is on/offTo see the maintenance window
-
Select the bar to pin the Maintenance window tooltip.
-
Hover over the Maintenance window tooltip.
-
Select View maintenance window settings.
-
Select Settings Classic.
- When the Disable synthetic monitor execution option is on in the maintenance window, the scheduled automatic tests are suppressed during the maintenance period so there are no tests results for this period. Only on-demand tests are not suppressed.
- When the Disable synthetic monitor execution option is off in the maintenance window, the tests are executed during the maintenance period, but, due to maintenance, the test results may differ from those observed under the normal conditions.
-
Not executed or finished tests
If some tests were not executed or finished due to improper monitor configurations or some issues at Dynatrace side, you can see a reason behind it:
-
No result—the execution started but the results were not delivered. Reach out to the Dynatrace support team.
-
No capability—you're trying to execute monitors that aren't supported by a location (for example, NAM ICMP monitors - from a location with inactive ICMP).
-
Discarded, not executed—the probable cause is the overloaded private location. Check the capacity metrics. If there are no issues with the metrics, contact the Dynatrace support team.
Performance
The Performance card displays:
- The average duration of each step across all locations (Step performance tab).
- The total duration of all steps for each location (Split by location tab).
It helps identify slow steps or regional performance issues.
Display problems in Performance section
- Red bar above the chart indicates an ongoing problem.
- Grey bar above the chart indicates a closed problem.
Only performance problems are marked in this section.
If the monitor violates a performance threshold, whether for the total duration of all steps or for the duration of an individual step, a solid red line appears above the performance graph for the problem duration. Select the solid red bar to display a link to the problem overview page.
- Hover over the problem bar to see an ongoing/closed problem details in the form of a tooltip.
- Select the problem bar and hover over the tooltip to display more options.
- Select View problem details to open the problem details in Problems
 .
.
Problems
The Problems card shows performance (threshold violation) and availability (local or global outage) problems.
There are three main problem types for browser monitors:
- Global outage (availability).
- Local outage (availability).
- Performance threshold violation (performance problem for sum of all steps or individual steps).
Performance problems may combine threshold violations at the monitor as well as step levels.
The problems section lists all problems in the selected timeframe, both open and closed. On top of that, you can:
- See the details of a problem in the form of a table with a start date and duration.
- Expand each problem to see affected entities and alerting profiles.
Problems, along with their constituent events give you a full picture of the number and scope of your monitor's issues.
Synthetic steps and actions
The Synthetic steps and actions card shows details for each browser step the monitor is set to perform. It can be a page loading, click on some button or any other control, etc. For each step, you can see such details as:
- Action type—for example, Click.
- Avg. duration—average response time for a certain timeframe, for example, for the last hour.
- Screenshot—the screenshot taken during the step execution.
Select the expand icon for a step to see the response time of individual executions in a specific timeframe (for example, the last hour). It allows you to evaluate the overall step performance. The expand icon is unavailable and can't be selected if there is no performance data for the step.
Events
The Events card shows all events that compose problems. Events for active as well as resolved problems show up in the list and timeline.
Hover over a time slot in the event timeline to see the type and number of events generated at that interval. Select a time slot to view a tooltip with the events that took place in it.
Select an event type to see the list of events. An event is created per location where, for example, your monitor violates step- or monitor-level performance thresholds. Select an individual event to see details.
Errors
The Errors card displays errors found in the selected timeframe.
On the card, you can:
- See the details of an error in the form of a table with the step and number of occurrences.
- Select Analyze errors .
Frontends
The Frontends card displays the frontends to which the monitor is assigned.
Locations
The Locations card shows the status of the last monitor execution for each location. The status is displayed with colors:
- Green—the location was available during the last monitor execution.
- Red—an outage was detected during the last monitor execution.
- Gray—there is no data about executions for this location.
Properties and tags
This informational card shows the number of steps, the number and list of locations, frequency of monitor execution, and any applied tags.
Select Edit to edit or apply additional tags.
Analyze executions
When using a browser monitor, you can analyze individual monitor executions in detail.
Analyze executions without new browser monitor experience
Not applicable to new Dynatrace environments created after January 26, 2026.
If the new browser monitor experience is not activated, you can analyze executions on the Multidimensional analysis page in  Synthetic Classic.
-
Select Analyze executions at the top of the monitor's details page.
You are directed to the Multidimensional analysis page in Dynatrace Classic.
-
In the Detailed analysis timeframe section, select an execution to pin its tooltip.
-
Hover over the tooltip and select View execution.
Analyze executions with new browser monitor experience
DPS License
If the new browser monitor experience is activated, you can analyze executions in Latest Dynatrace.
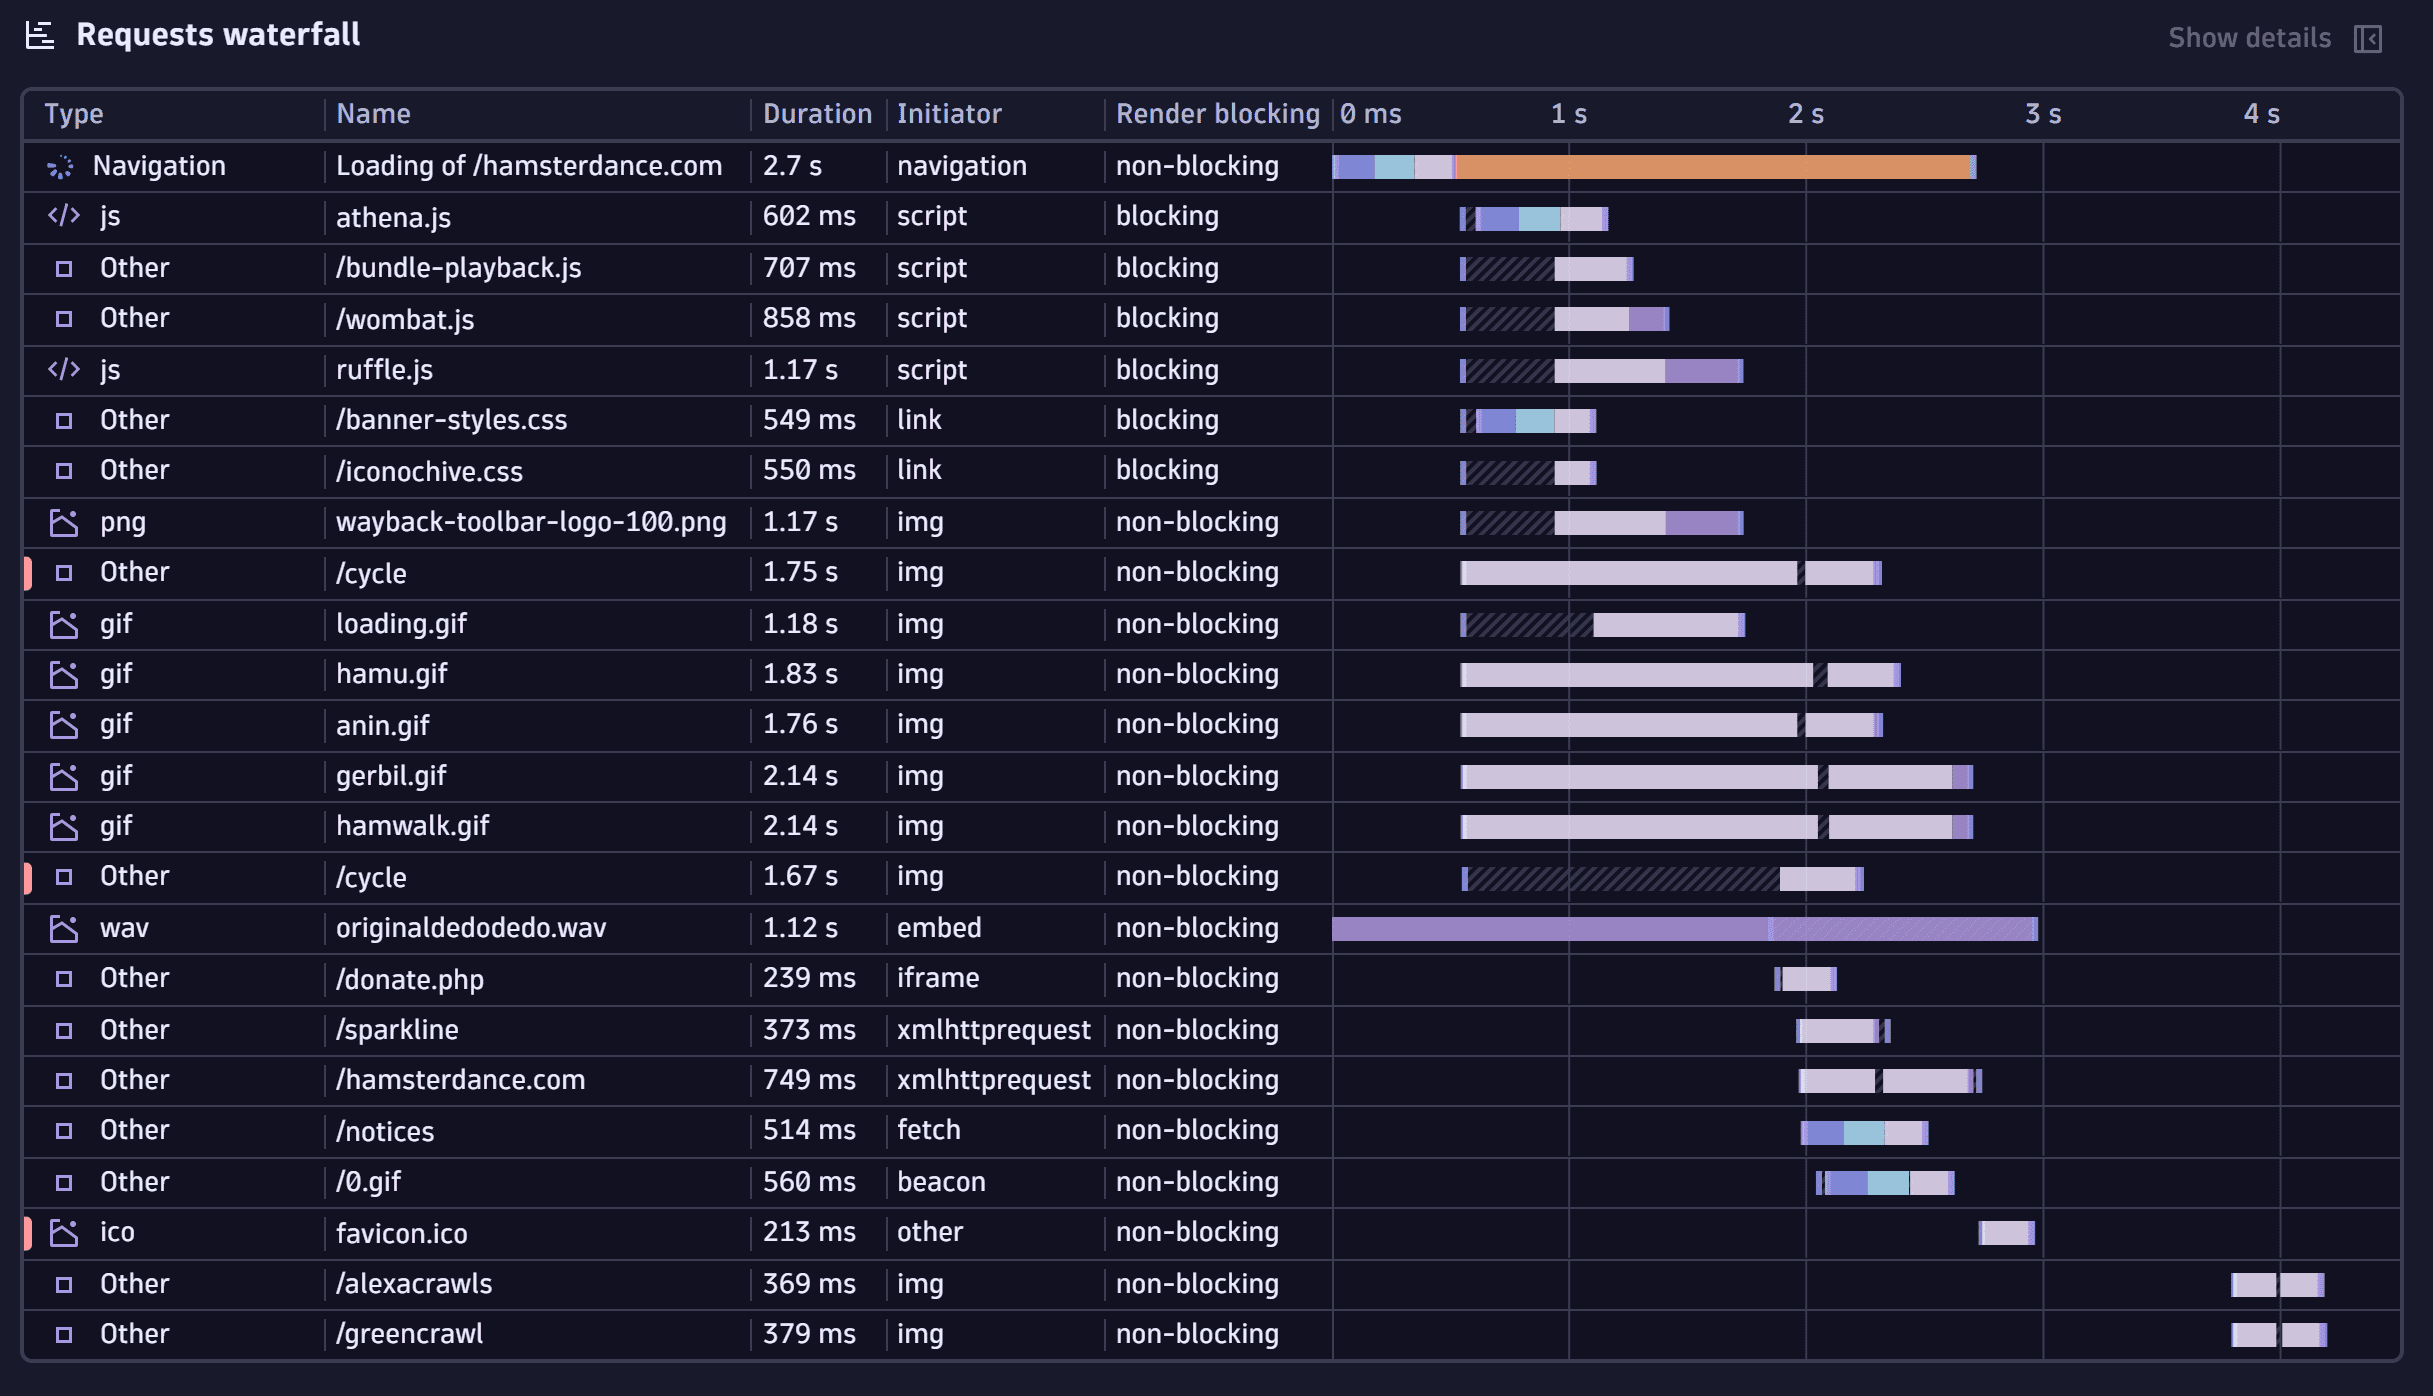
During the monitor execution, one or more pages can be loaded. A set of components (resources) is loaded together with a page. In the Requests waterfall chart, you can see detailed information about each resource loaded with the page during the monitor execution. The details include:
- Resource type, for example, script, image, font, data.
- Resource name.
- Resource load duration in ms.
- Resource initiator, for example, fetch, script, link. For details, see Resource initiator.
- Render blocking status.
- Resource load start and end time.
The Requests waterfall chart can help you detect and isolate specific resources in specific executions that compromise overall performance. Also, it can help you analyze reasons behind the monitor failures.
To analyze monitor executions via the Requests waterfall chart
-
Select Analyze executions in the upper-right of the monitor details page.
-
Find the needed execution in the Executions table. Each row of the table is an execution record. You can use a filter to narrow down the list of executions. You can filter by location or timeframe.
If automatic retry on error is switched on, the monitor performs a second execution attempt in case the first attempt fails. In the Executions table, the second attempt is displayed by default, and a icon appears in the execution record—select to see the first attempt as well.
-
Select the execution.
The Pages table with the execution details appears. In the Steps row, you can see all steps performed during the monitor execution. The timeframe when a step was performed is highlighted with a blue bar displayed in the row. Hover over the bar for the step details, such as the step duration, step type, and the UI element the step is performed to. You can filter a specific step. In this case, only the bar associated with the filtered step remains blue. All other bars turn gray.
Under the Steps row, the pages loaded during the monitor execution are displayed.
During the monitor execution, pages can be opened in separate browser windows or tabs. In this case, a record for each window appears in the table with the icon next to the record. Select the icon to see the pages loaded in that window.
Under the Steps and window (if applicable) row, each consecutive row of the table is a loaded page record. The timeframe when the page was loaded is highlighted with a blue bar displayed in the record.
-
For the needed page, select the page record in the table.
The Requests waterfall chart displays all resources that were loaded with the page during the execution of:
- The monitor step when the page was loaded.
- All subsequent monitor steps when the browser monitor interacted with the page (for example, clicks, keystrokes).
You can select a resource to see its performance details. The resources loaded with errors have a red mark displayed in the Type column.
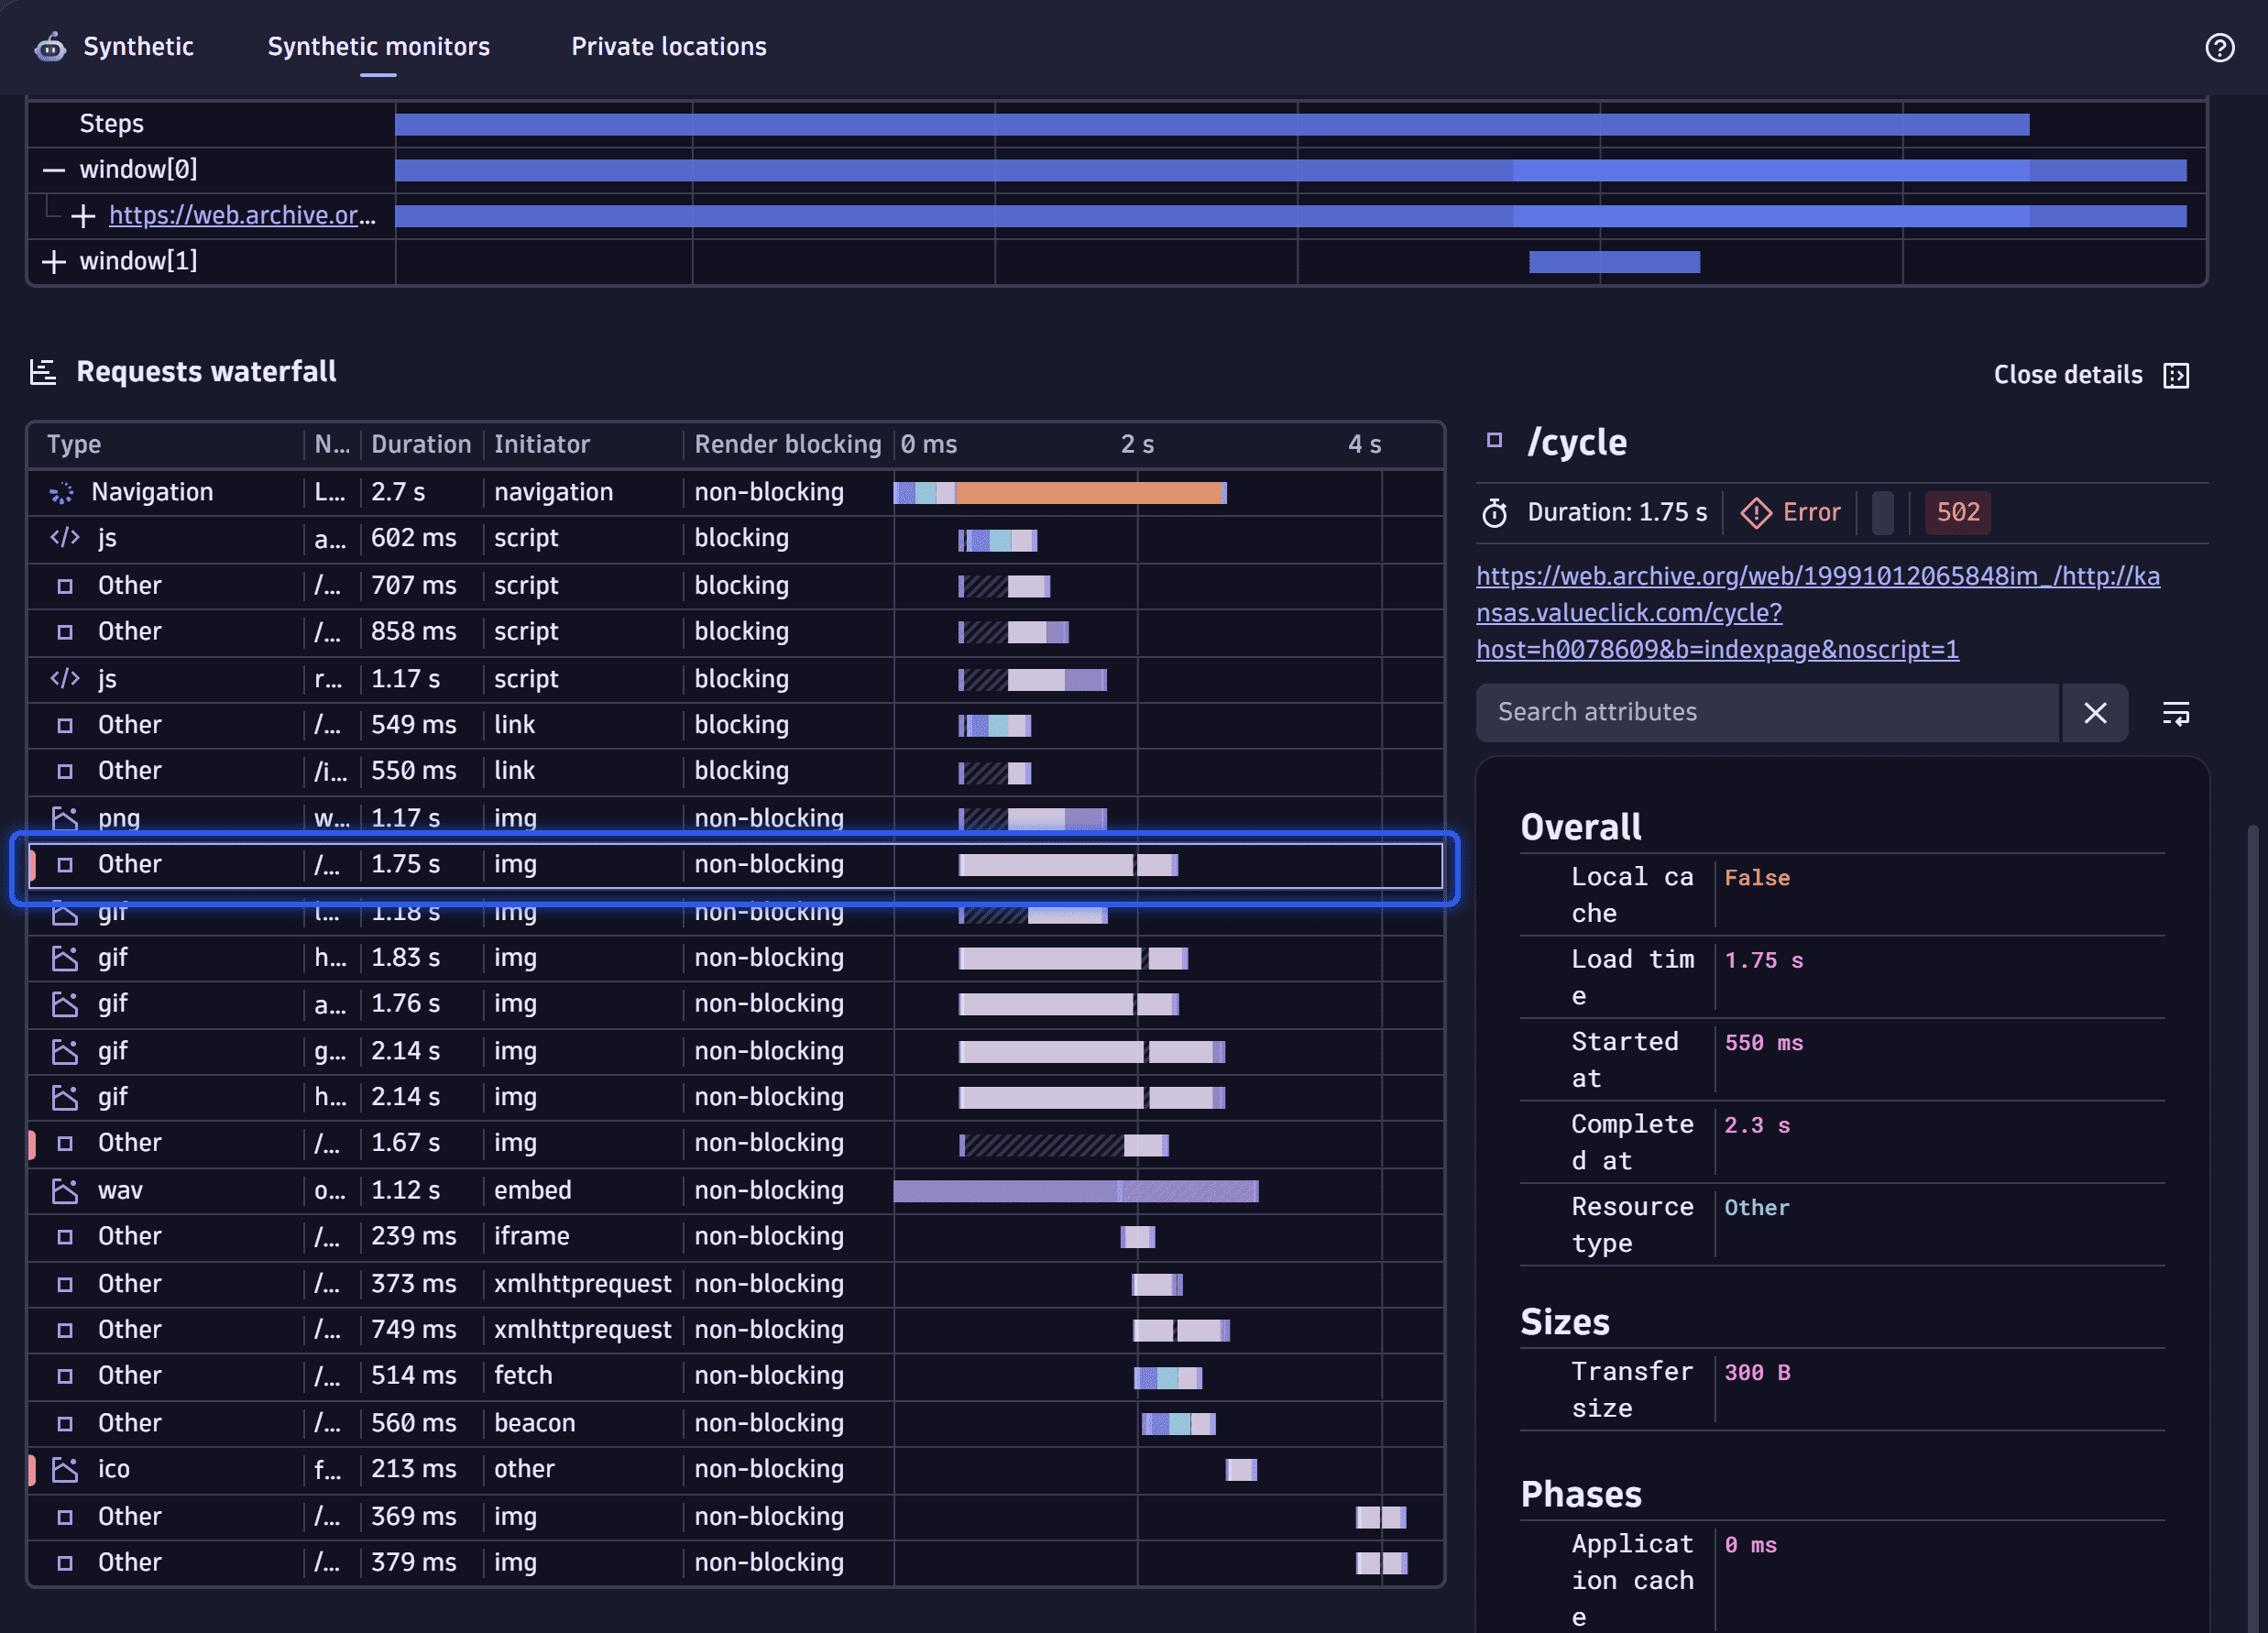 Request waterfall - resources with errors
Resource initiator
The resource initiator is a web platform feature that initiated the resource load. When you know what was the resource initiator, you can, for example, detect the XHR actions—their initiators are usually xmlhttprequest and fetch.
The resource initiator doesn't represent a type of fetched content. For example, a .css file can be fetched with a <link> element—in this case, link is specified as the resource initiator.
| Initiator | Request initiated by |
|---|---|
|
|
|
|
|
|
| CSS |
| 103 Early Hint response |
|
|
|
|
| Loading a |
| A favicon; non-standard and only reported by Safari |
|
|
|
|
|
|
|
|
|
|
| A navigation request |
|
|
|
|
|
|
|
|
|
|
|
|
| XMLHttpRequest |