Snowflake integration
- Latest Dynatrace
- How-to guide
- Published Jun 24, 2026
Connect your Snowflake account to Dynatrace to monitor warehouse health, query performance, credit consumption, security posture, and data quality directly inside Dynatrace alongside your applications and infrastructure.
Prerequisites
- A Dynatrace SaaS environment powered by Grail.
- A Snowflake account with
ACCOUNTADMINaccess for the one-time initial setup. - Optional If you want Dynatrace to manage the deployment for you, you also need to configure EdgeConnect.
Connect your Snowflake account
-
Go to
 Data Observability app.
 -
Select New connection, then select Snowflake.
Choose your deployment model
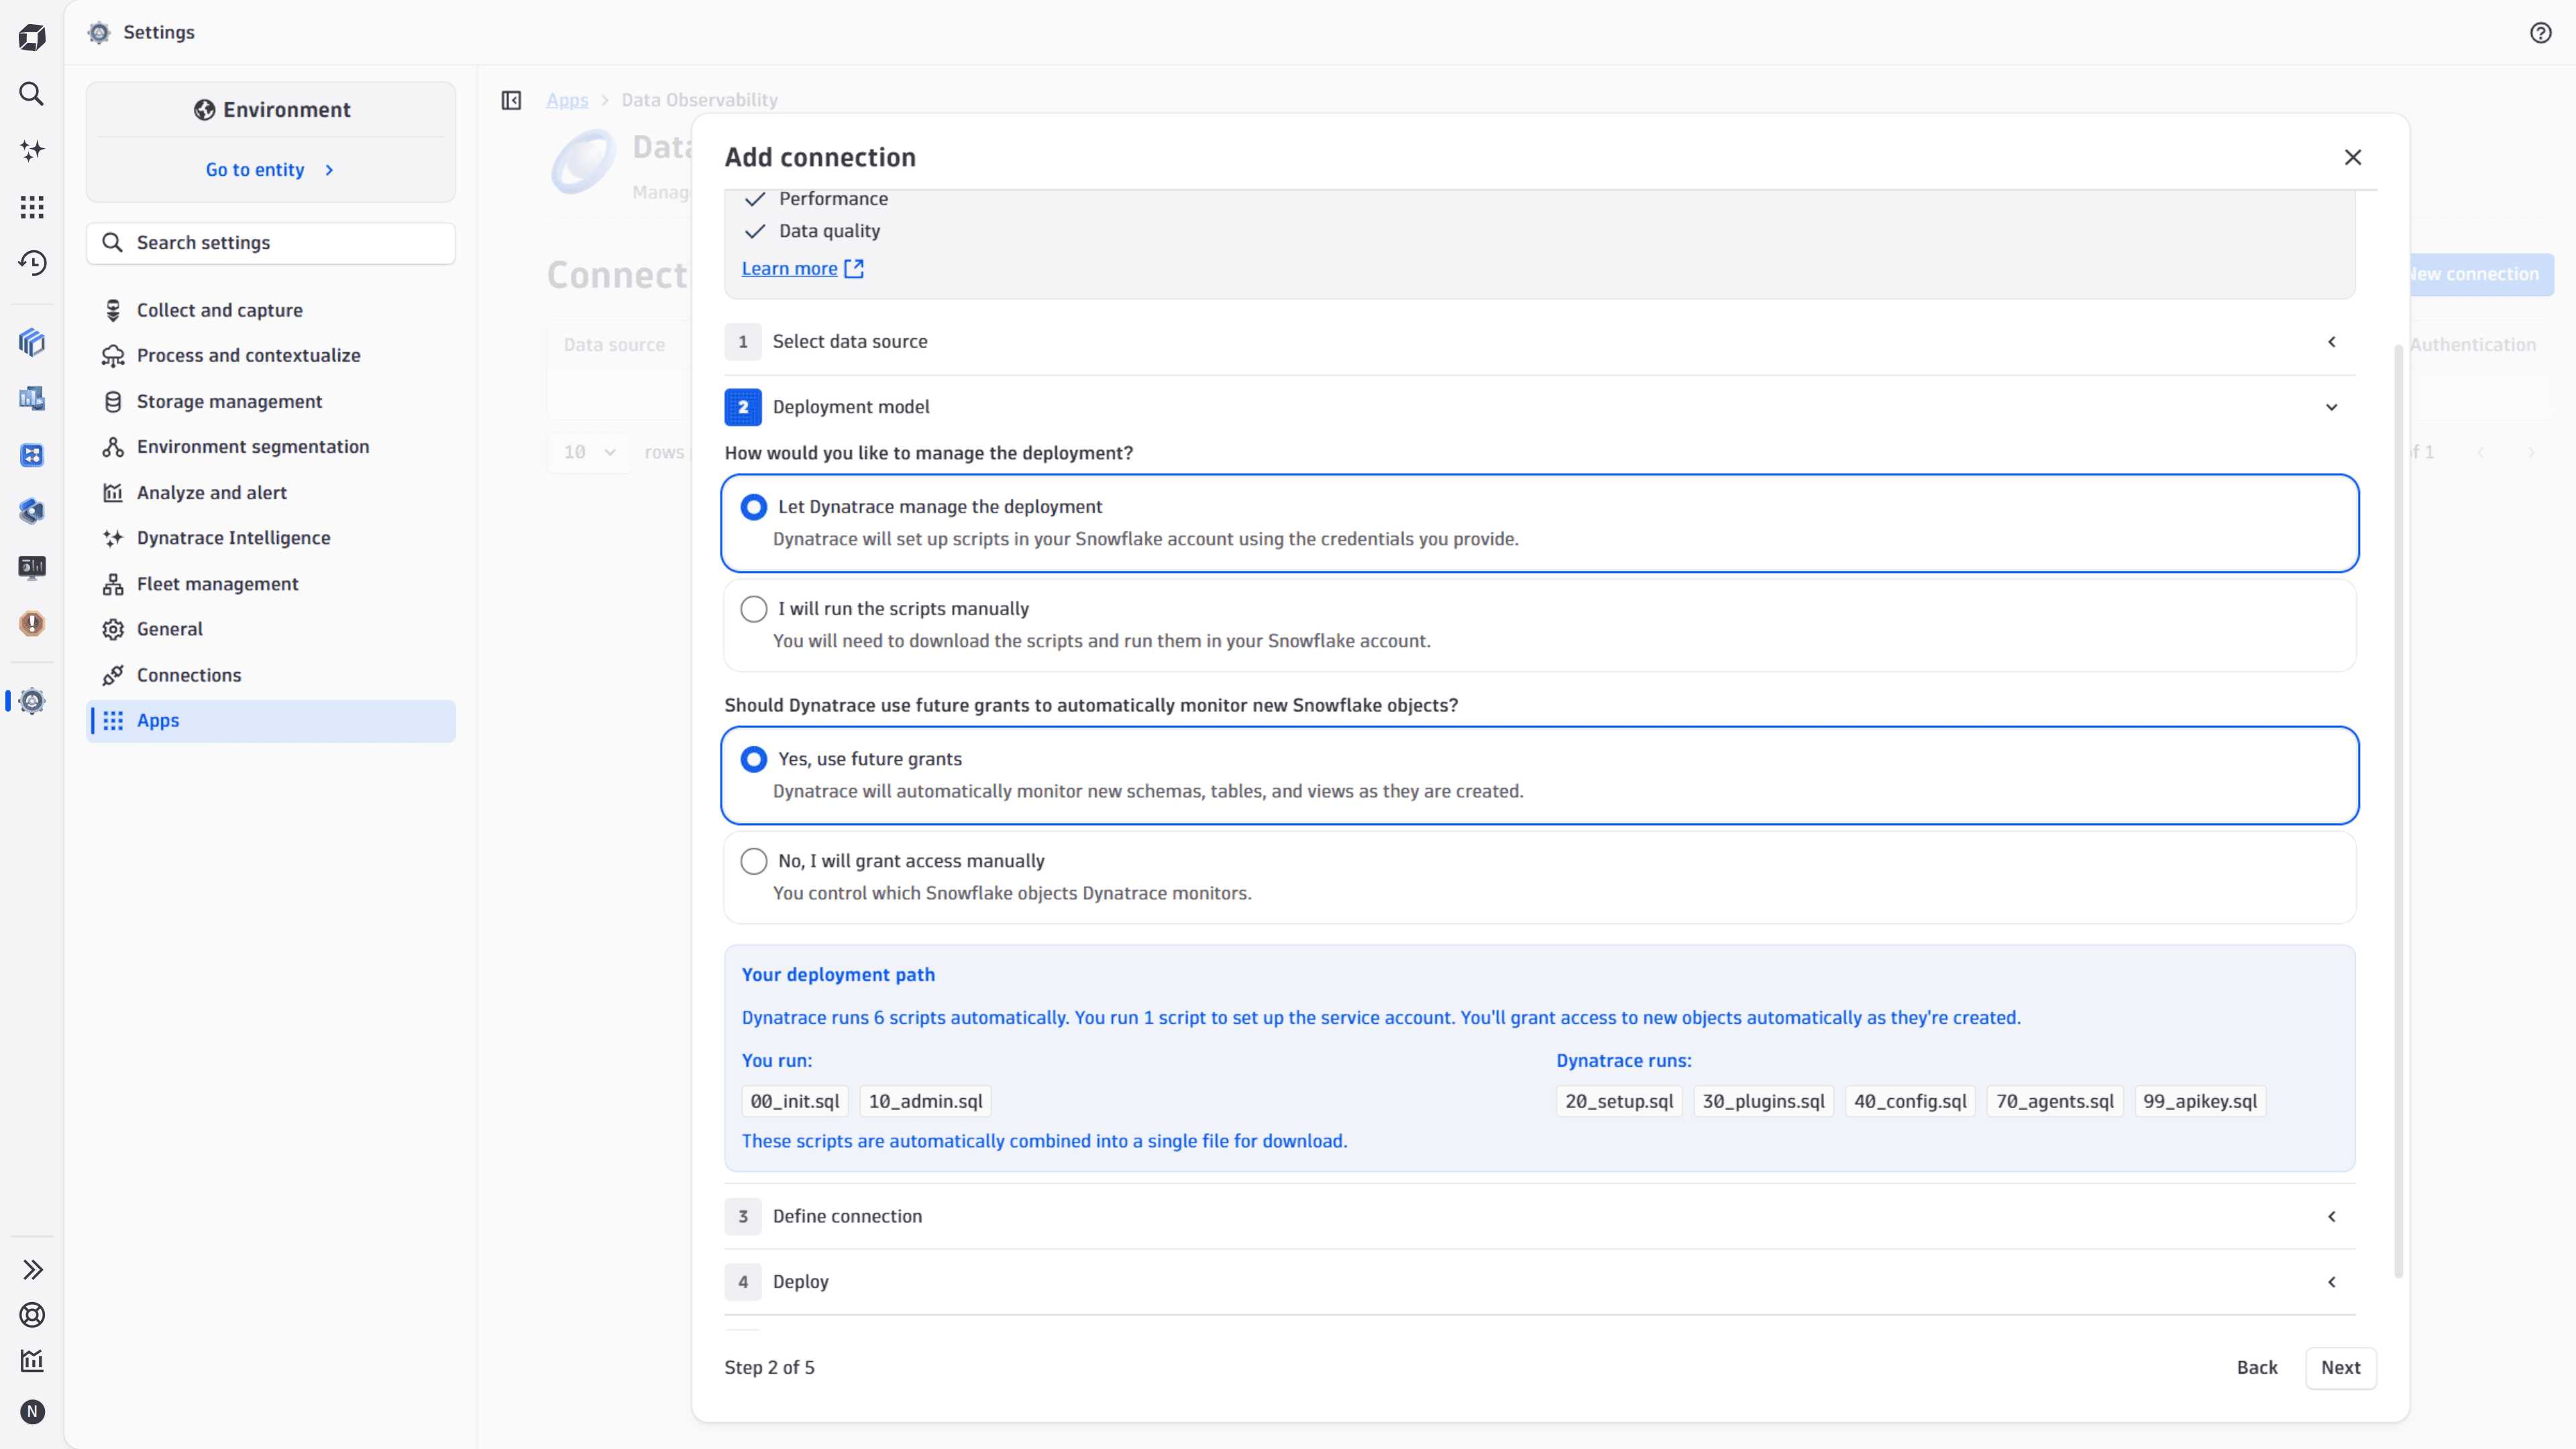
In Deployment model
-
In the How would you like to manage the deployment? section, choose how you want to manage the deployment:
- Let Dynatrace manage the deployment—Dynatrace sets up the required scripts in your Snowflake account using the credentials you provide.
- I will run the scripts manually—download the scripts and run them in your Snowflake account yourself.
-
In the Should Dynatrace use future grants to automatically monitor new Snowflake objects? section, choose whether Dynatrace should use future grants for automatic monitoring of the new Snowflake objects, or whether you prefer to grant access manually:
- Yes, use future grants—Dynatrace will use future grants to automatically monitor new Snowflake objects, such as new schemas, tables, and views, as they are created.
- No, I will grant access manually—you control which grants should be used and which Snowflake objects Dynatrace monitors.
Once you setup the deployment model, the wizard summarizes your deployment path:
- Which scripts you run and which are run by Dynatrace.
- Whether you grant Dynatrace access to new object manually or automatically.
Review the summary before proceeding to the next step.
Define your connection
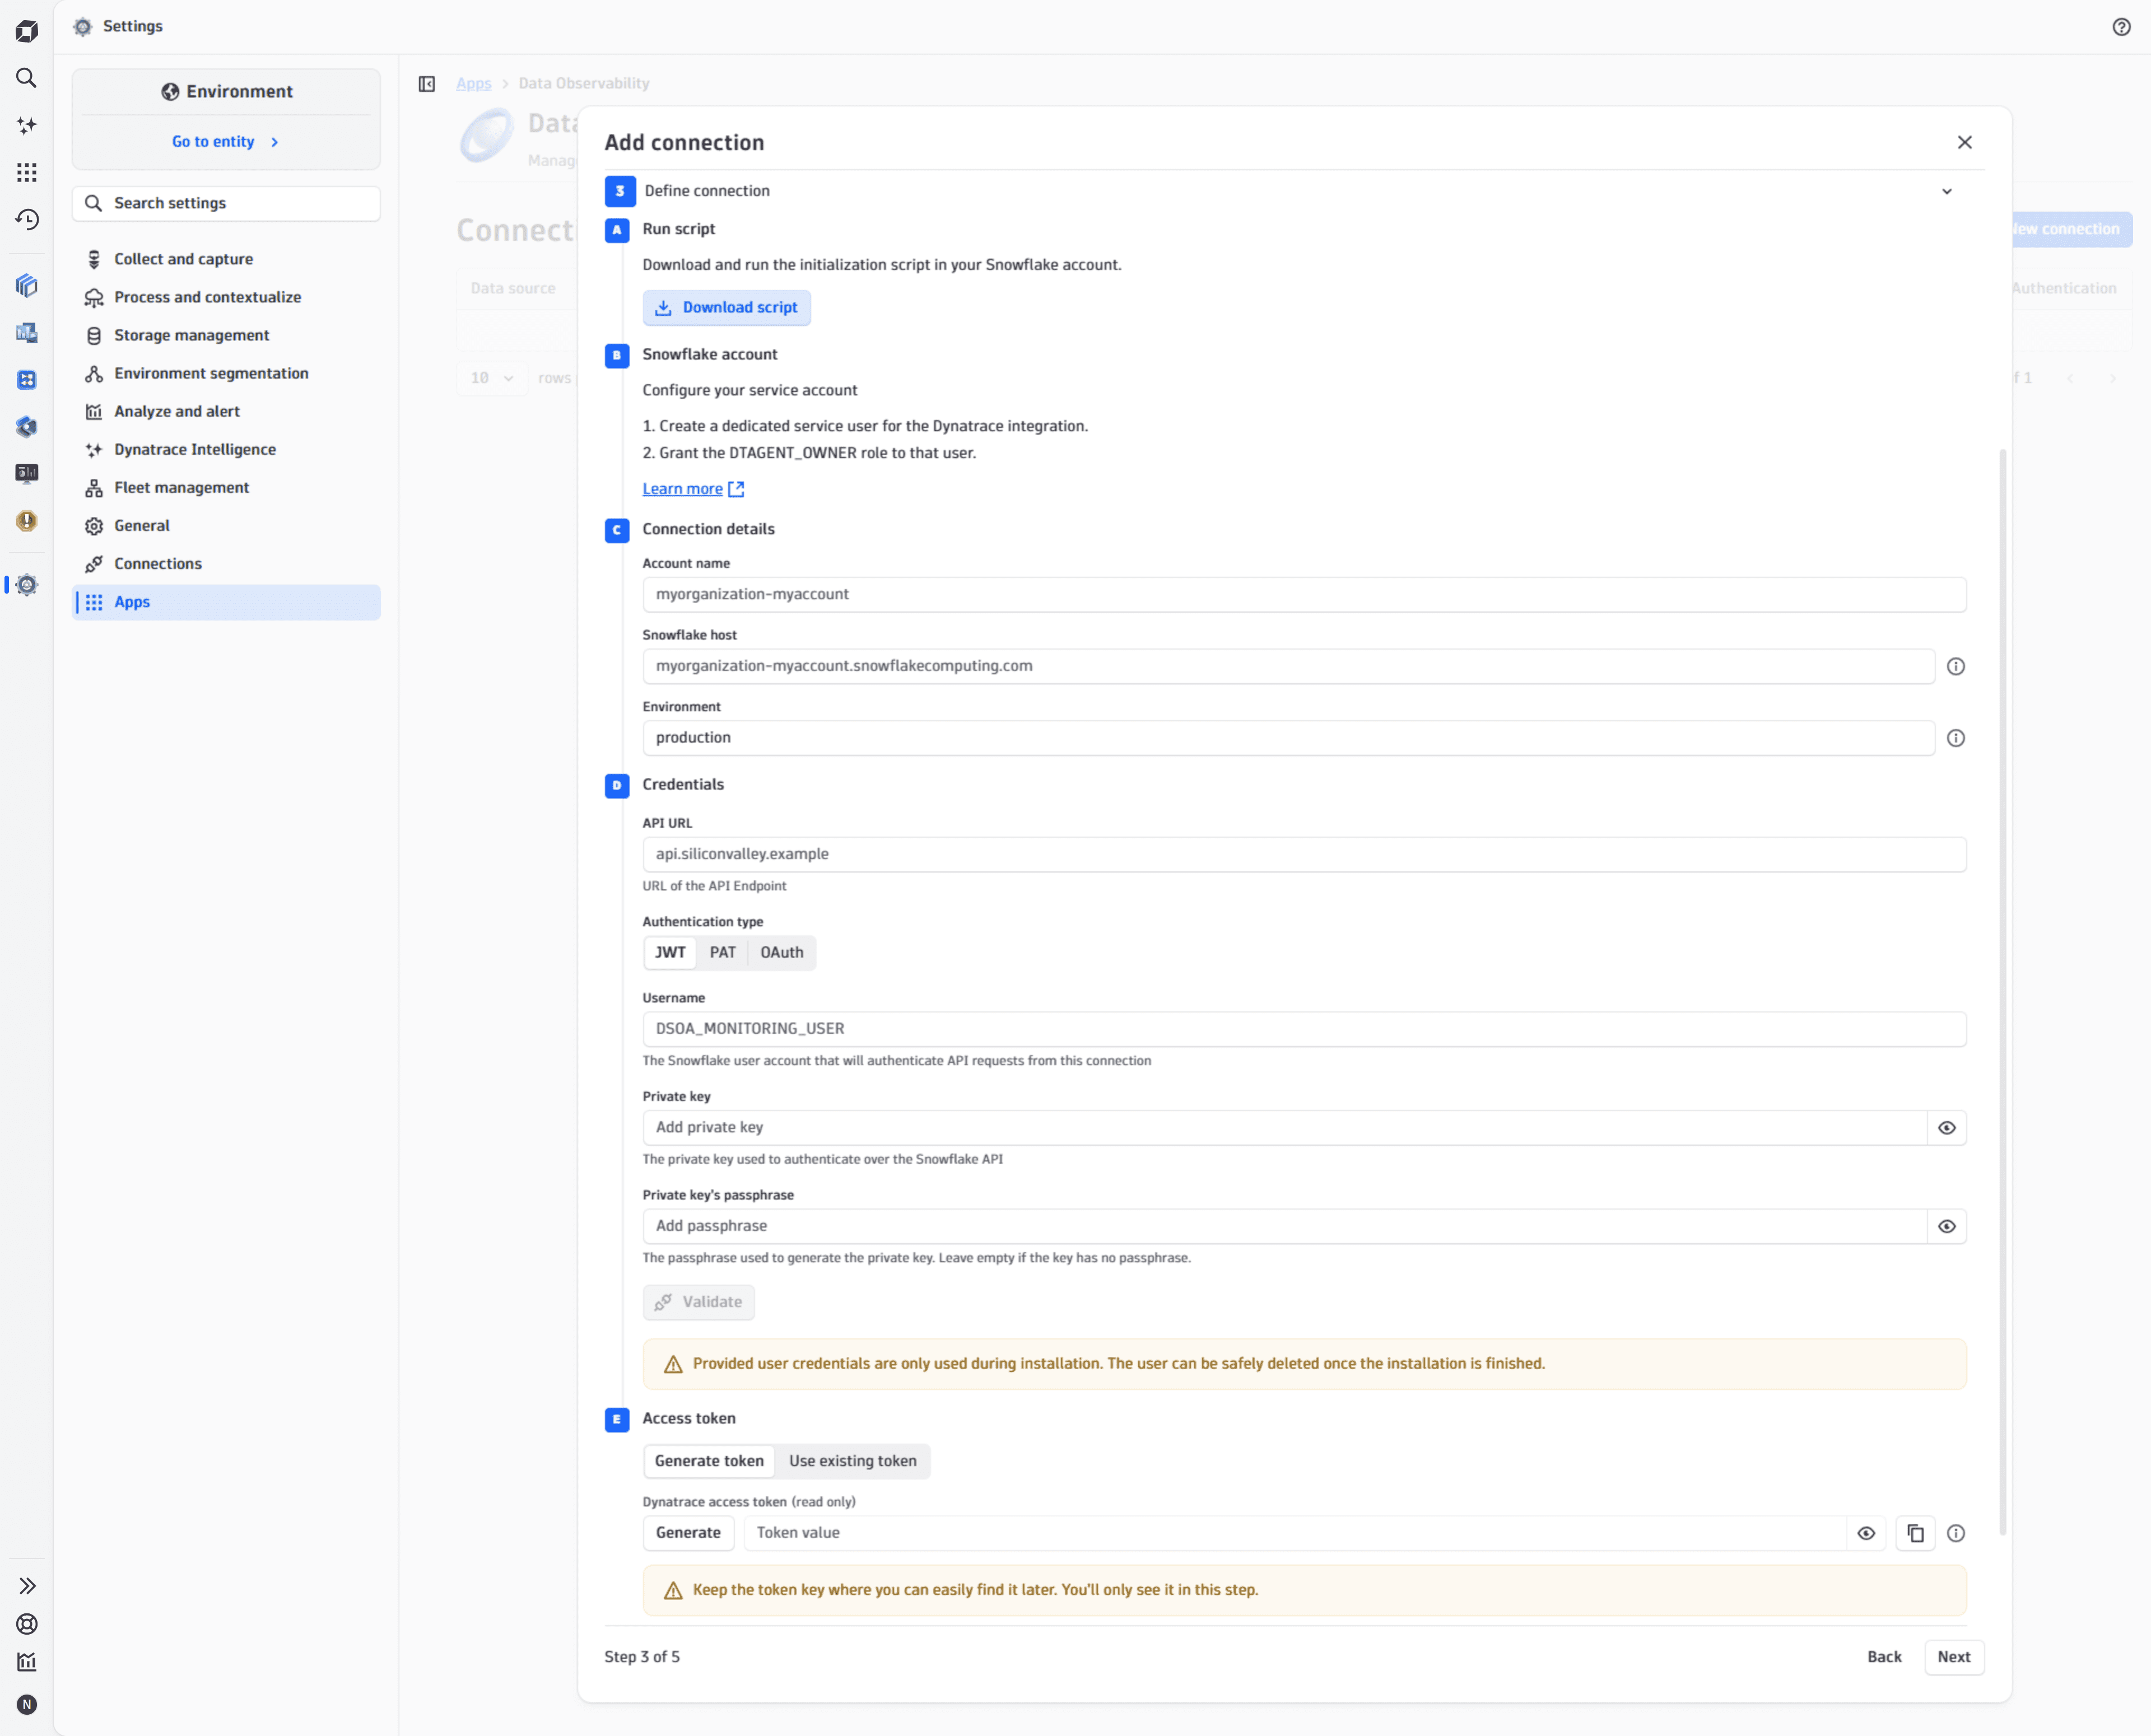
In Define connection, configure your connection and fill out the fields depending on your deployment model setup.
Deployment managed by Dynatrace
-
In Run script, download and run the initialization script in your Snowflake account.
-
In Snowflake account, configure your service account. To do so
- Create a dedicated service user for the Dynatrace integration.
- Grant the
DTAGENT_OWNERrole to that user.
-
In Connection details, provide:
- Snowflake Account name. For example,
myorganization-myaccount. - Snowflake host. For example,
myorganization-myaccount.snowflakecomputing.com. - Environment label. For example,
production.
- Snowflake Account name. For example,
-
Configure your Credentials:
-
Provide API URL. For example,
api.myorgapi.com. -
Select your Authentication type: JWT, PAT, or OAuth.
-
Provide the Username of the Snowflake account that will authenticate API requests from this connection.
-
Provide the Private key for the Snowflake account that is used to authenticate over the Snowflake API.
-
Optional Provide the Private key's passphrase. The passphrase is used to generate the private key. You can leave it empty if the key has no passphrase.
-
Select Validate to validate your credentials.
The credentials provided during this step are used only during installation. You can safely remove them once the setup is complete.
-
-
Access token: Generate a Dynatrace access token or use an existing one. Store the token value — it is only shown at this step.
Deployment managed by the user
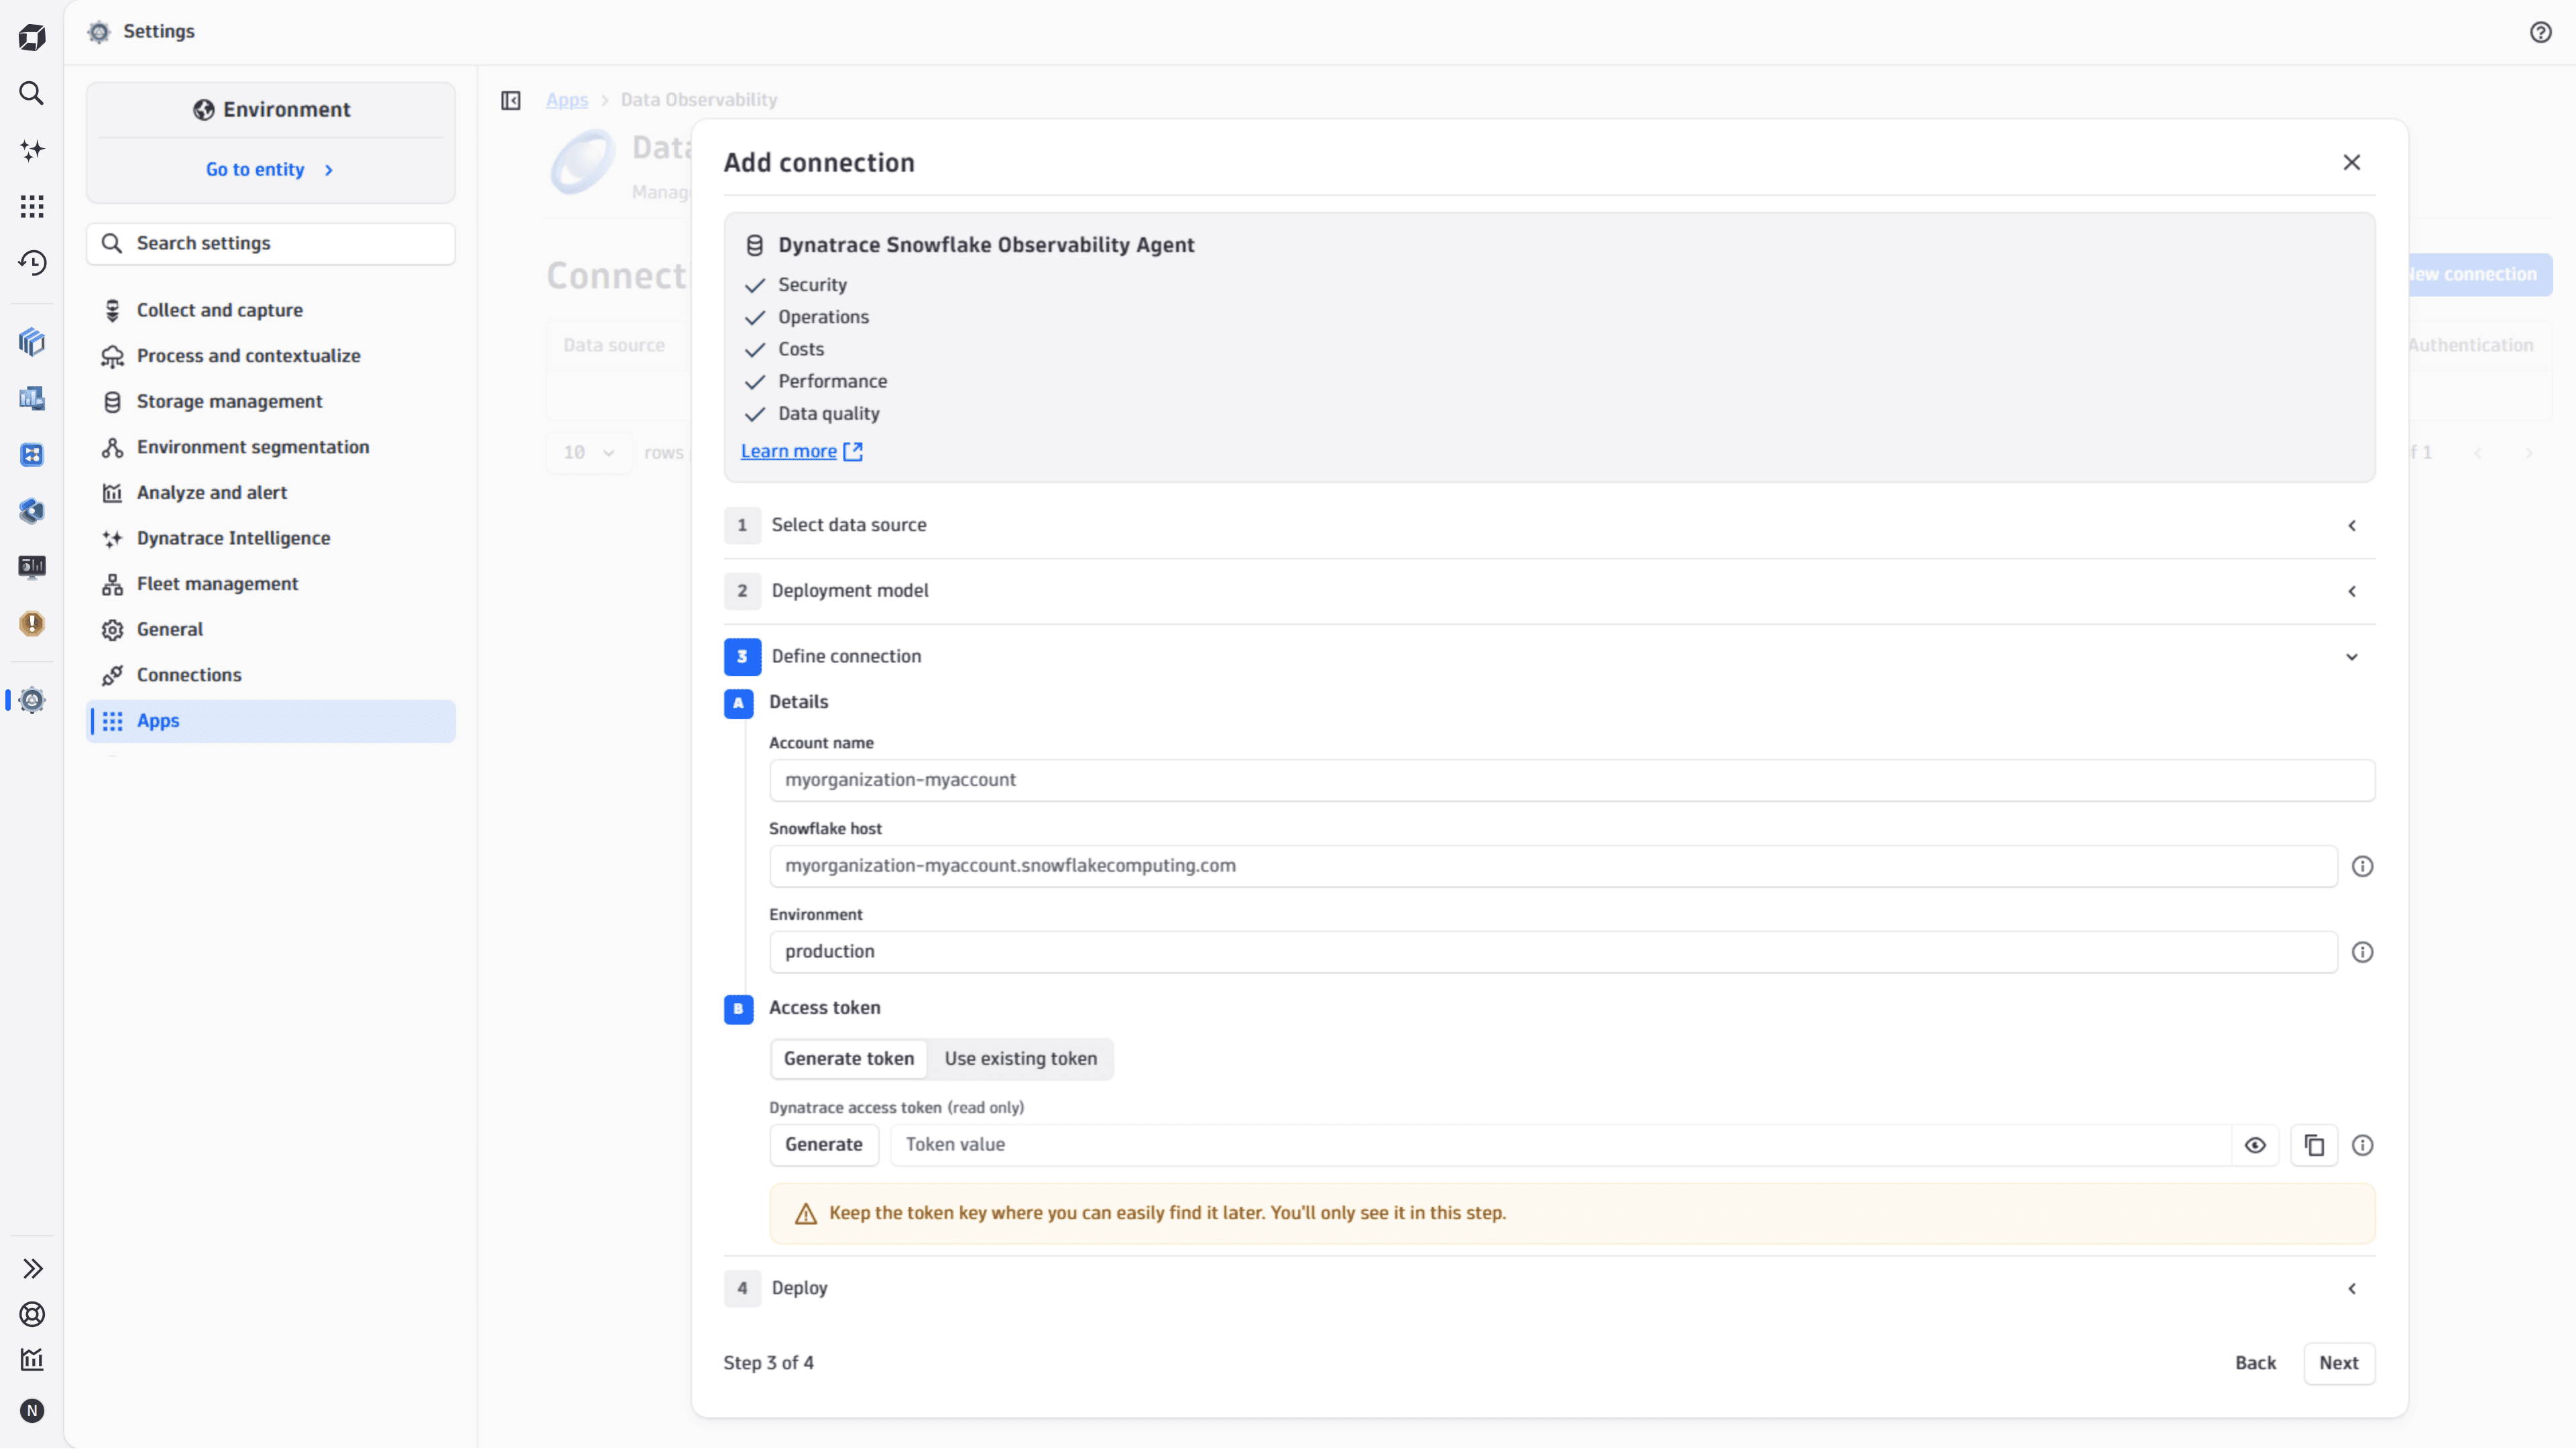
- In Details, provide:
- Snowflake Account name. For example,
myorganization-myaccount. - Snowflake host. For example,
myorganization-myaccount.snowflakecomputing.com. - Environment label. For example,
production.
- Snowflake Account name. For example,
- In Access token, generate a Dynatrace access token or use an existing one. Store the token value—it's only shown during this step.
Deploy your connection and verify the deployment
- In Deploy, select Run scripts. Dynatrace deploys the required scripts to your Snowflake account. Deployment can take up to 30 minutes.
-
In Verify deployment, wait for the connection check to complete. This process can take up to two minutes. Once the Snowflake Observability Agent is confirmed as connected, the first metrics appear within a few minutes. You can leave the wizard and check the connection status later in Settings > Apps > Data Observability connections.
The Verify deployment step is visible only if you chose to run scripts via Dynatrace during the Deployment model step.
Result
Your Snowflake account appears as an active connection in the Connections view. Fourteen dashboards across security, costs, performance, quality, and operations are created automatically and are populated once the first telemetry batch is received—typically within two hours.