Always-on app profiling
- Latest Dynatrace
- Tutorial
- 3-min read
- Published Feb 01, 2024
Excessive memory allocations or leaks can harm your organization’s clusters and lead to crashes or unresponsive services. To avoid this, it’s essential to monitor your KPIs for memory allocation and object churn as measures of the performance and health of a system.
Introduction
Dynatrace provides in-depth memory allocation monitoring, which allows fine-grained allocation analysis and can even point to the root cause of a problem.
While memory allocation analysis can show wasteful or inefficient code, it can also reveal different problems.
Dynatrace Application Observability provides you with the following building blocks that can help you pinpointing issues with your memory allocation.
This use case illustrates how we at Dynatrace use our own memory analysis capabilities to perform root cause analysis within a Dynatrace Cluster.
Scenario
You can start your investigation in the Technology overview to get a comprehensive overview of the currently running processes within your environment. During this stage, you should scan for any noticeable imbalances or anomalies.
Depending on the identified issues, you can then use the following tools
- Memory allocation profiling to study memory usage patterns
- Method hotspots to pinpoint resource-intensive methods
- CPU Profiling to analyze resource-intensive code.
Prerequisites
You need to have OneAgent in Full Stack Monitoring mode deployed in your infrastructure.
CPU Profiling
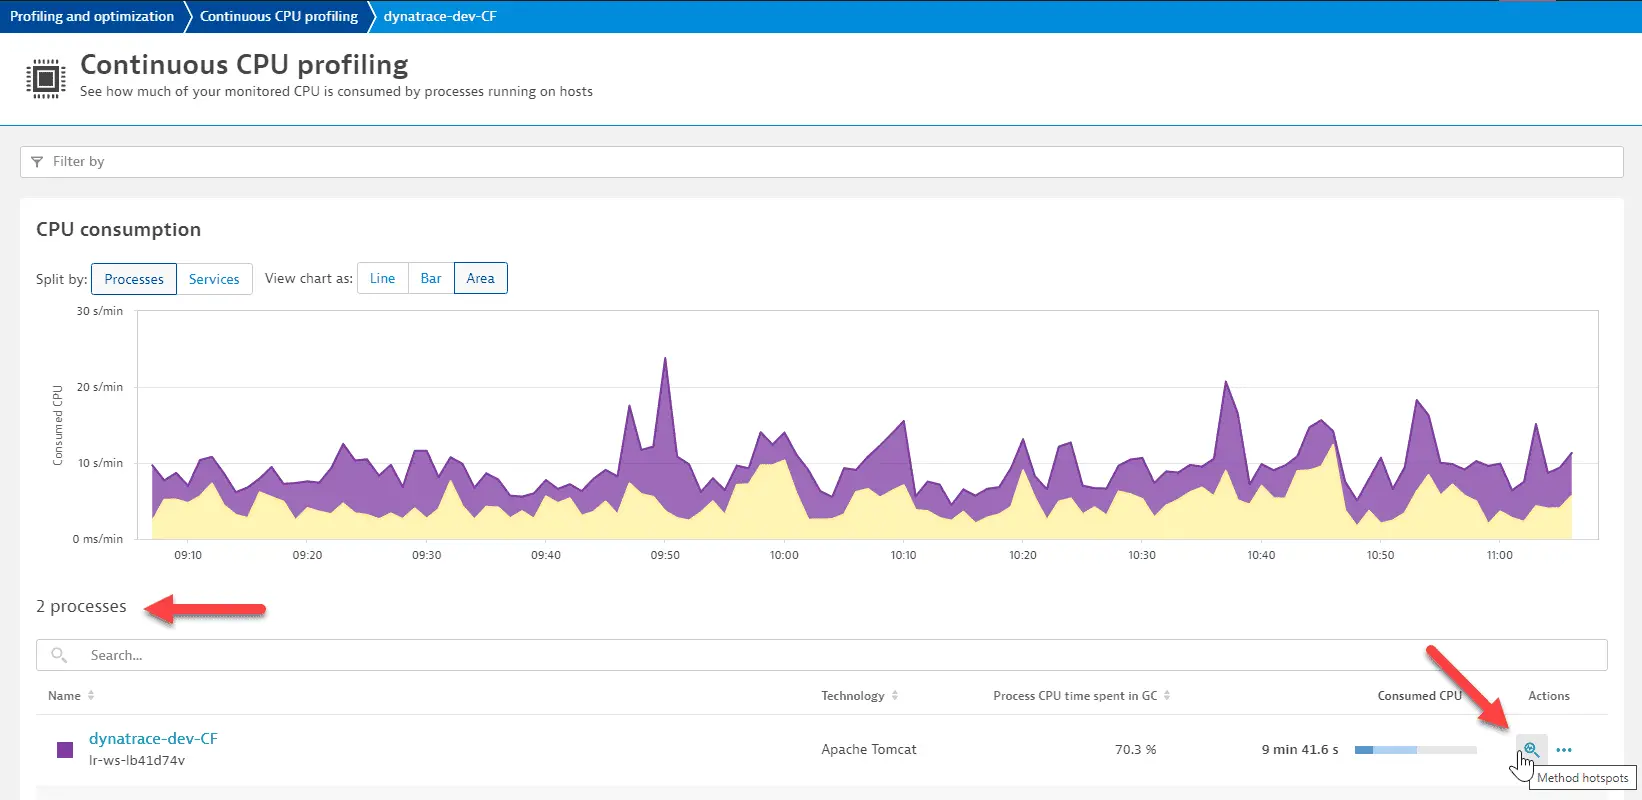
CPU profiling offers a granular view into how the application utilizes the CPU. By capturing the runtime of each function and method, it reveals which specific parts of the code consume the most CPU time. This feature maps the active call sequences during a specific time frame, helping engineers discern which code paths are most active or resource intensive.
Method hotspots
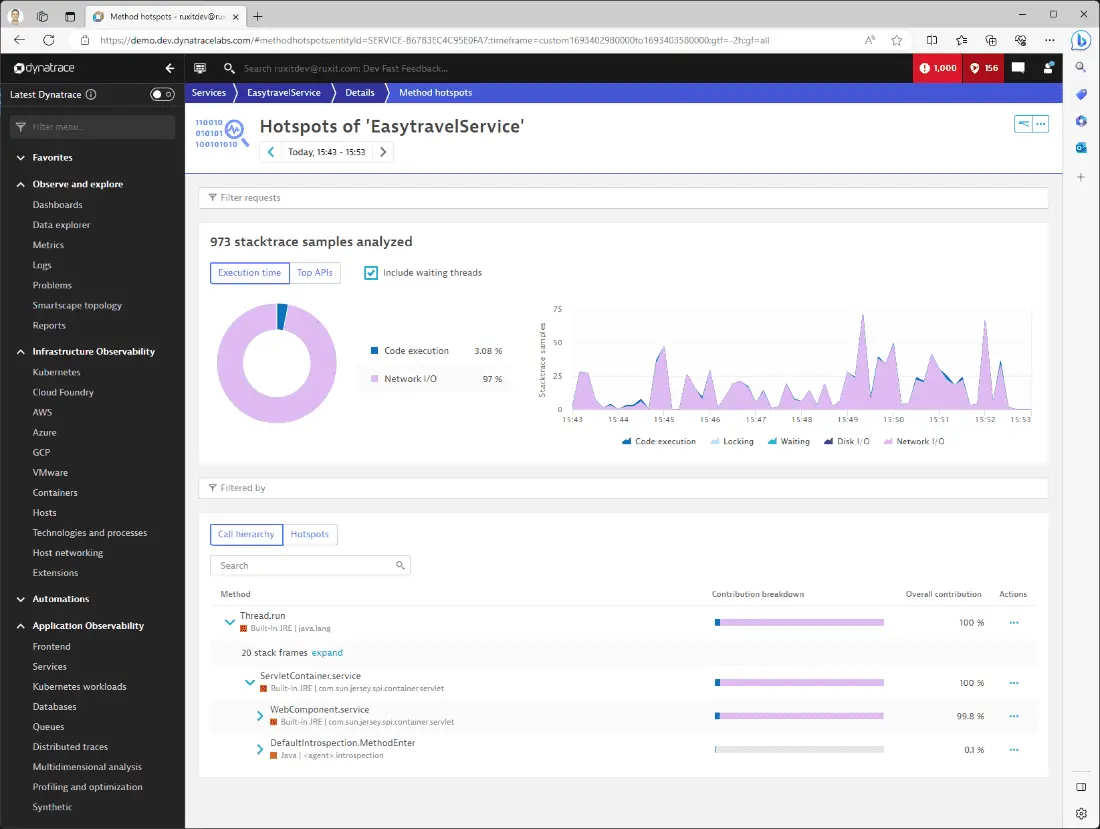
Method hotspots pinpoint the exact sections of the code where the most execution time is spent. It reveals the frequency of calls and the average time spent on each method. Through this, the efficiency of individual methods can be evaluated and potential areas of optimization within the codebase can be identified.
Memory profiling
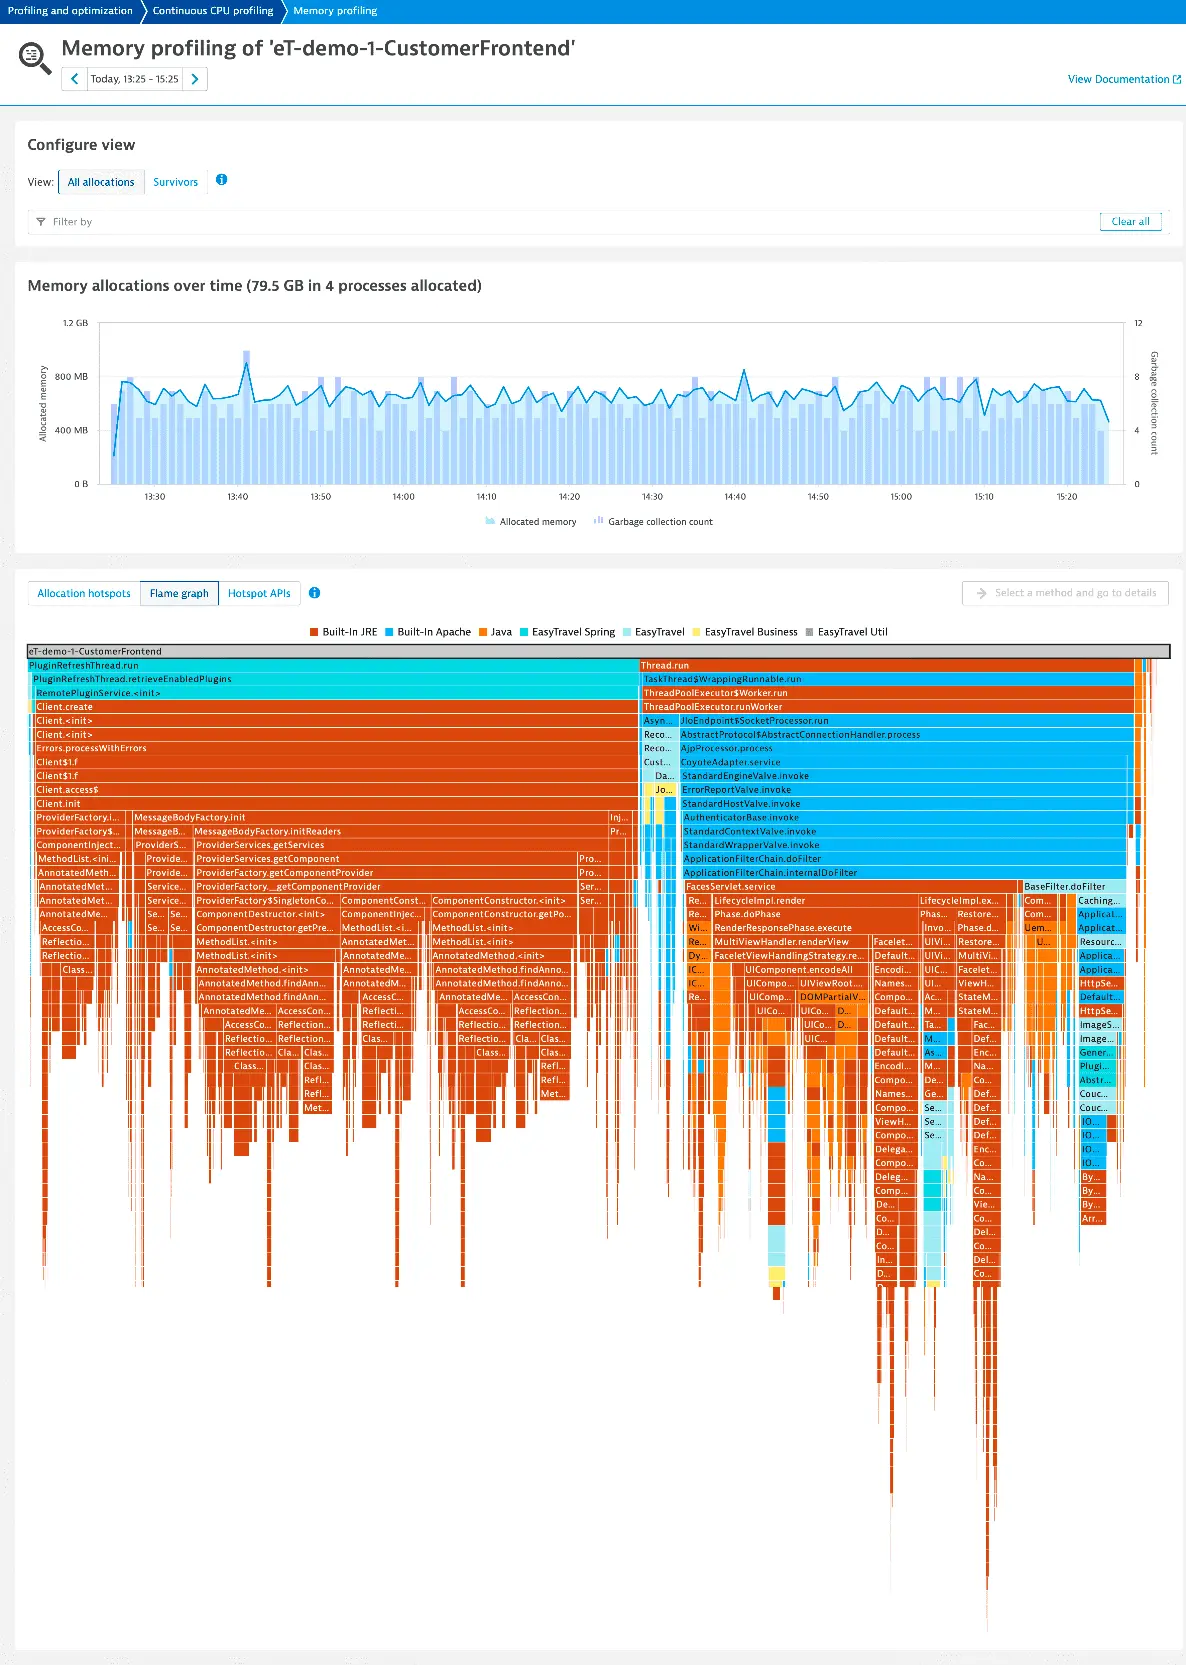
The Memory profiling feature allows you to get an overview of the memory consumption of your application and lets you analyze potential hotspots. You can see the most significant contributors at first glance and can drill further into the details of each memory allocation. The flame graph view allows for a visual overview of all allocations, as it also groups areas of allocation (APIs) by color.
Continuous thread analysis
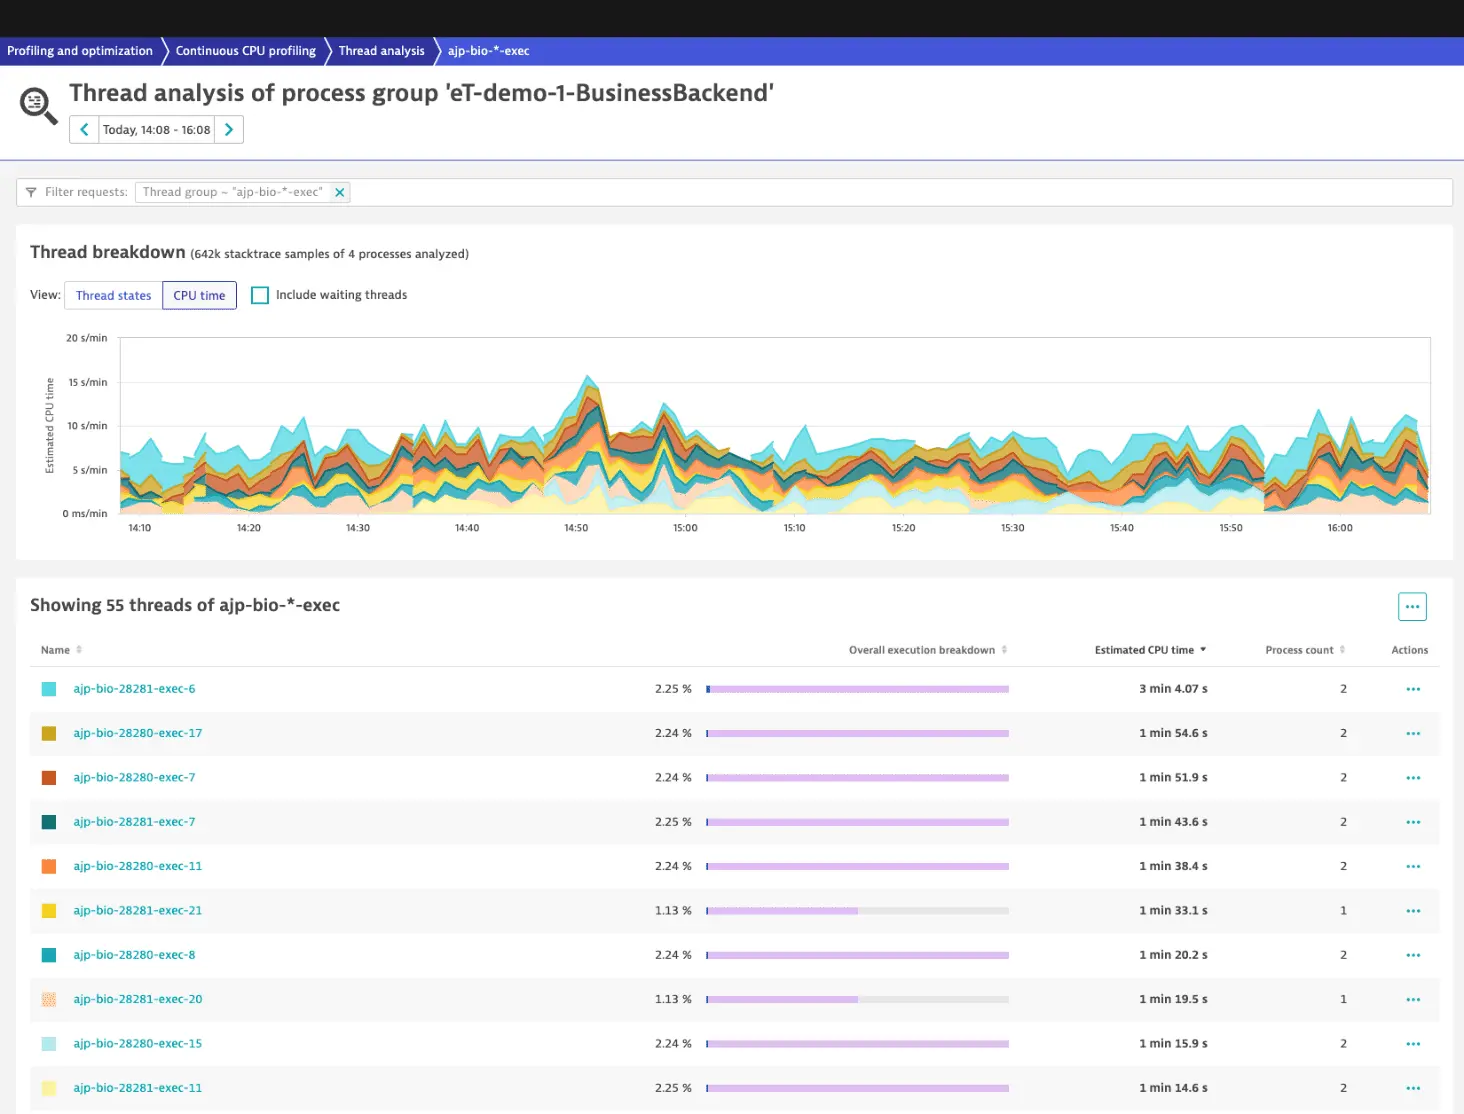
Continuous thread analysis provides an ongoing examination of thread activity. It visualizes thread states and interactions over time, helping engineers trace the lifecycle of each thread. This analysis is invaluable for spotting issues like deadlocks or prolonged wait states in real-time, as it provides insights into thread behaviors and patterns within the application.
Conclusion
With the approach described in this article, you get the following benefits
Analyzing directly in production
These tools allow the analysis of potential performance problems directly in a production environment without any significant overhead. This capability isn't readily available with many alternative methods.
Always on 24/7
Because the OneAgent captures all data required for these capabilities at all times, there is no need for any activation during a potential incident.
Cost Efficiency
Leveraging these tools averts the immediate need to scale up the cluster, resulting in substantial cost savings. In addition, by proactively addressing potential issues, the frequency of customer complaints and subsequent support tickets is reduced.
Handling Massive Loads
The tools cater to scenarios where replicating the high volume of load on a local machine for debugging purposes is impractical, if not impossible.
Further reading
Related topics
 Services