Explore service topology with Service Map
- Latest Dynatrace
- How-to guide
- 6-min read
- Early Access
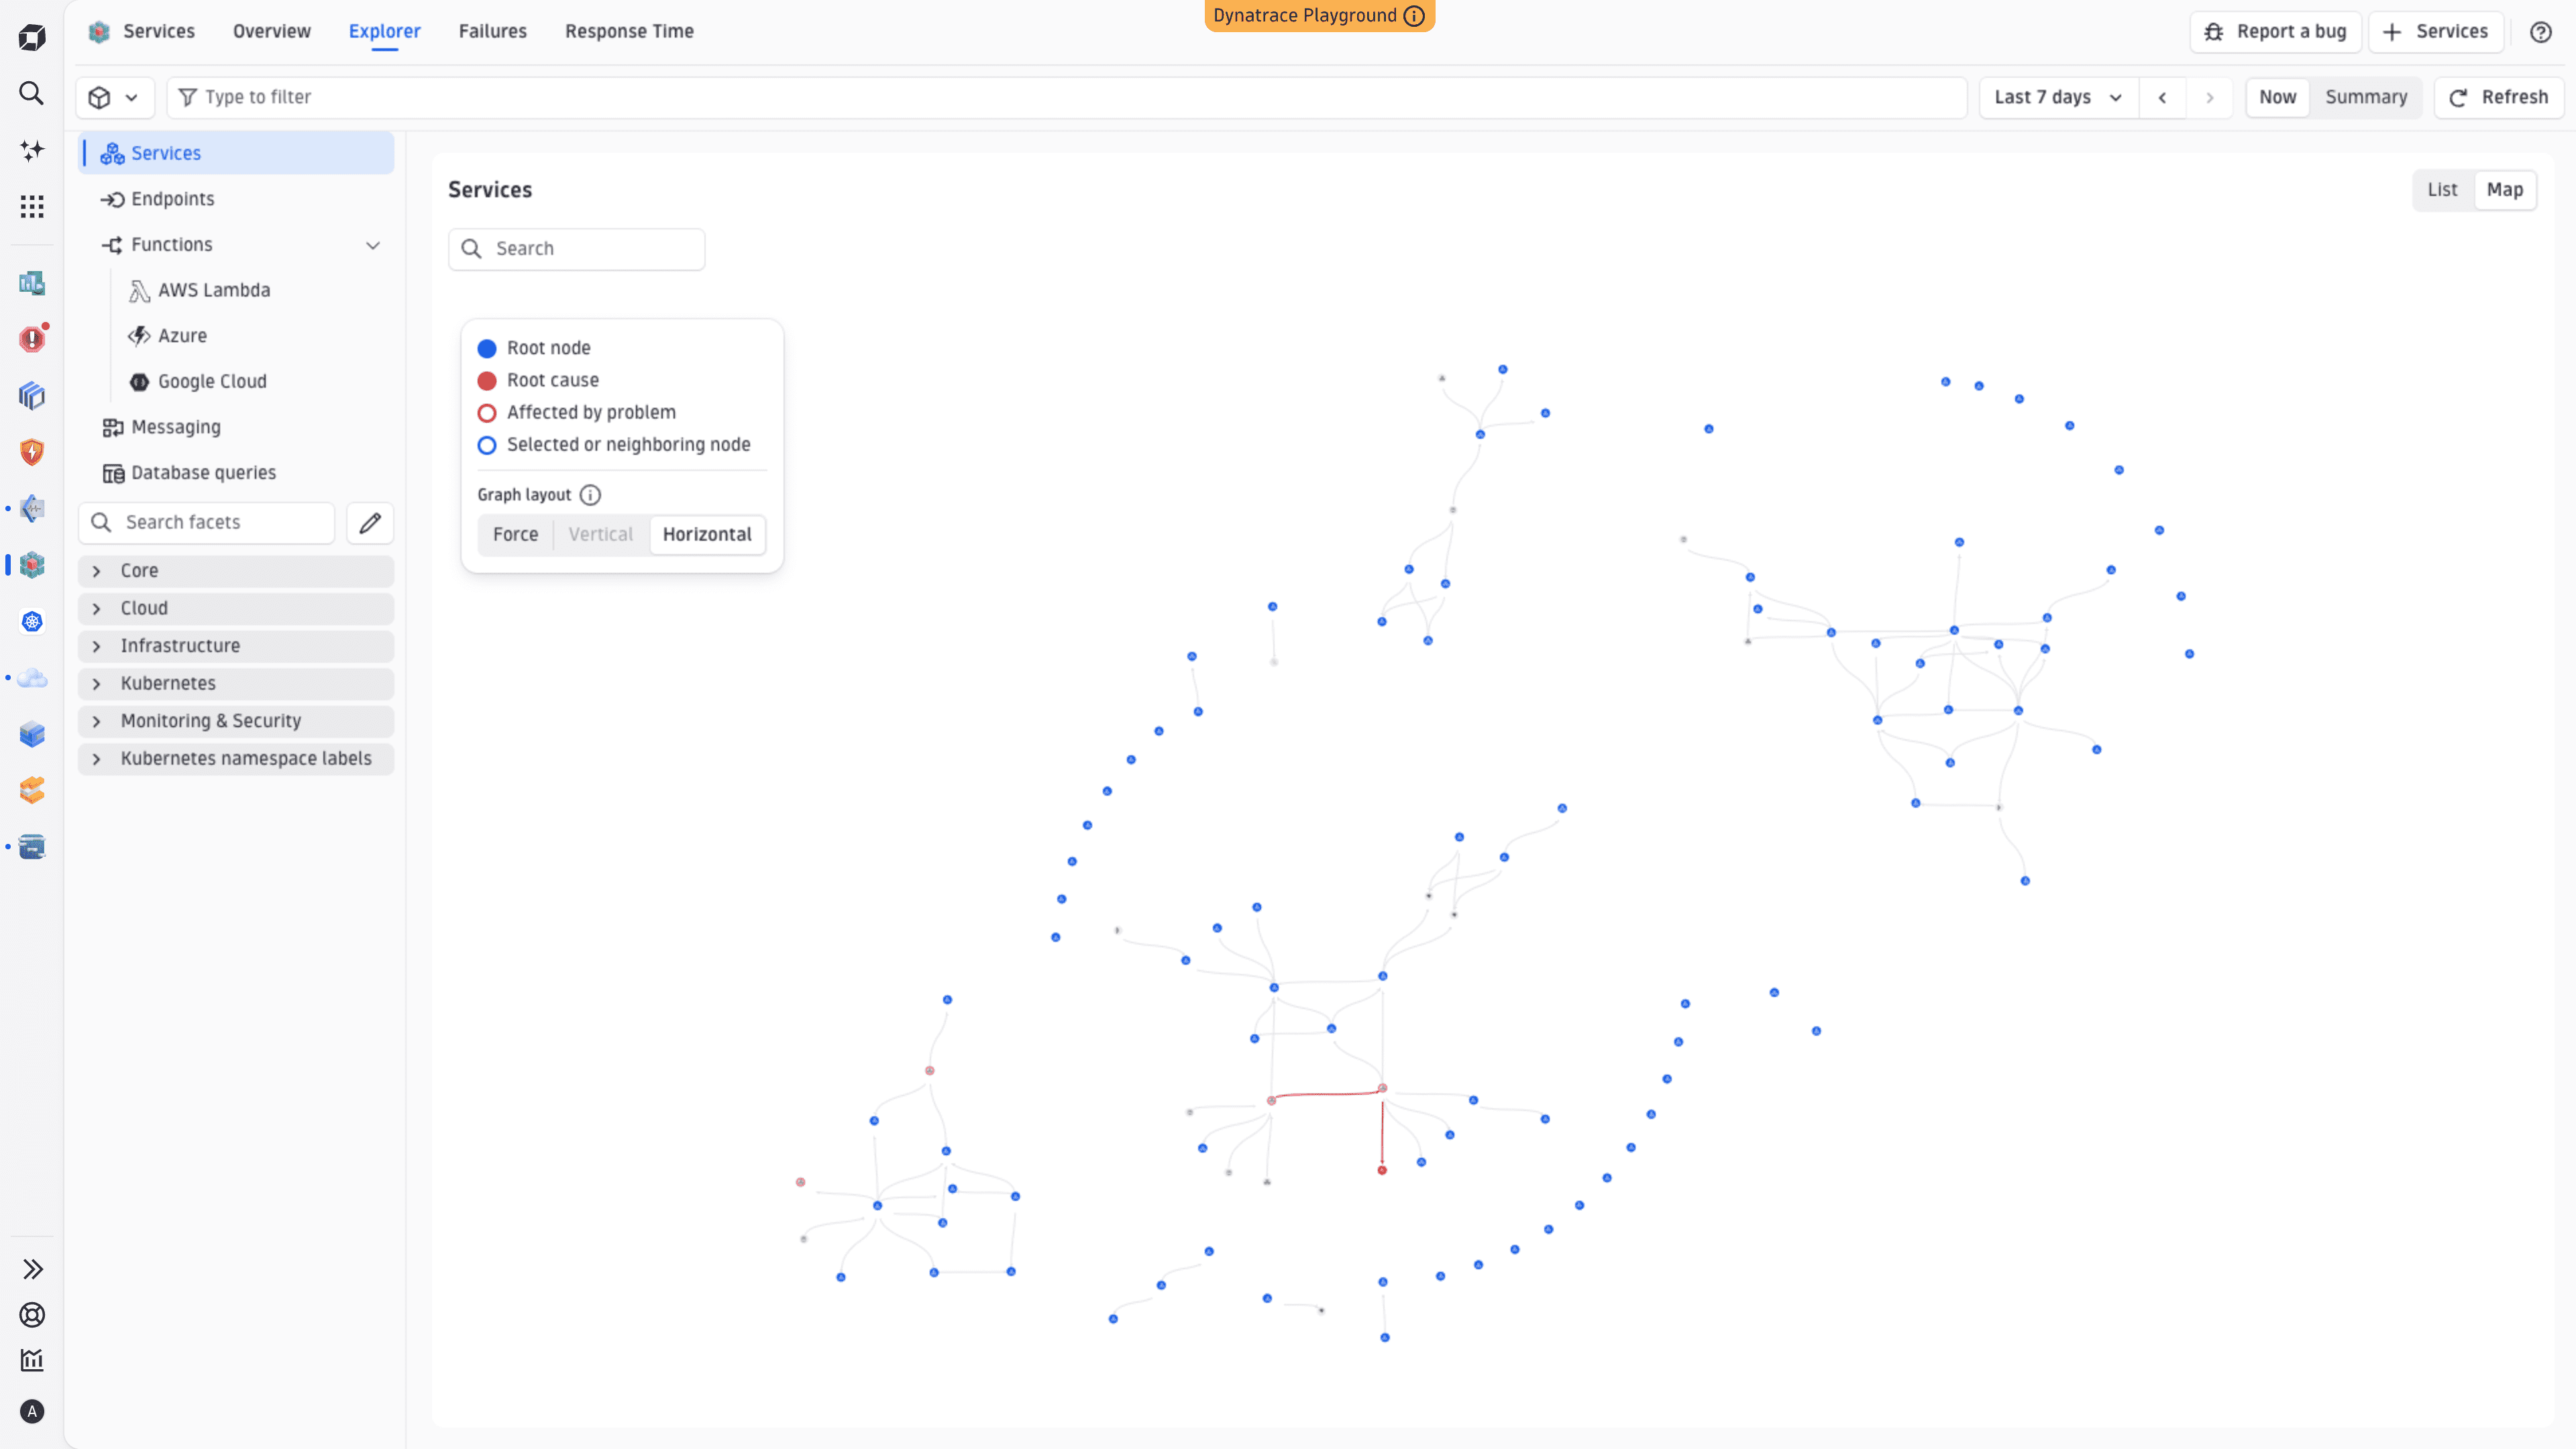
The Service Map brings a single‑screen, interactive topology into  Services. It automatically discovers runtime connections for your services—upstream and downstream services, database queries, and messaging flows—and overlays live health and performance data so that you can navigate from a high-level view to root cause analysis without switching context. The Service Map answers two immediate questions when a service behaves unexpectedly: who is calling this service, and what is this service calling?
Dynatrace discovers this service topology automatically from Smartscape and metrics, so no manual configuration or maintenance is required. The Service Map is designed for SREs, developers, and platform engineers who need fast, contextual insight into service dependencies and health.
The Service Map is part of the new Explorer (Early Access) experience. Switch to this new experience from Services to use this feature. For details, see New Explorer view.
Key capabilities
The Service Map offers the following capabilities:
- Interactive service topology that shows:
- Horizontal call relationships: Upstream callers (what calls your service) and downstream dependencies (what your service calls), including transitive hops.
- Database dependencies and messaging flows.
- Frontend relationships to browser or mobile clients.
- Zoomable, pannable map for exploring both small and large topologies.
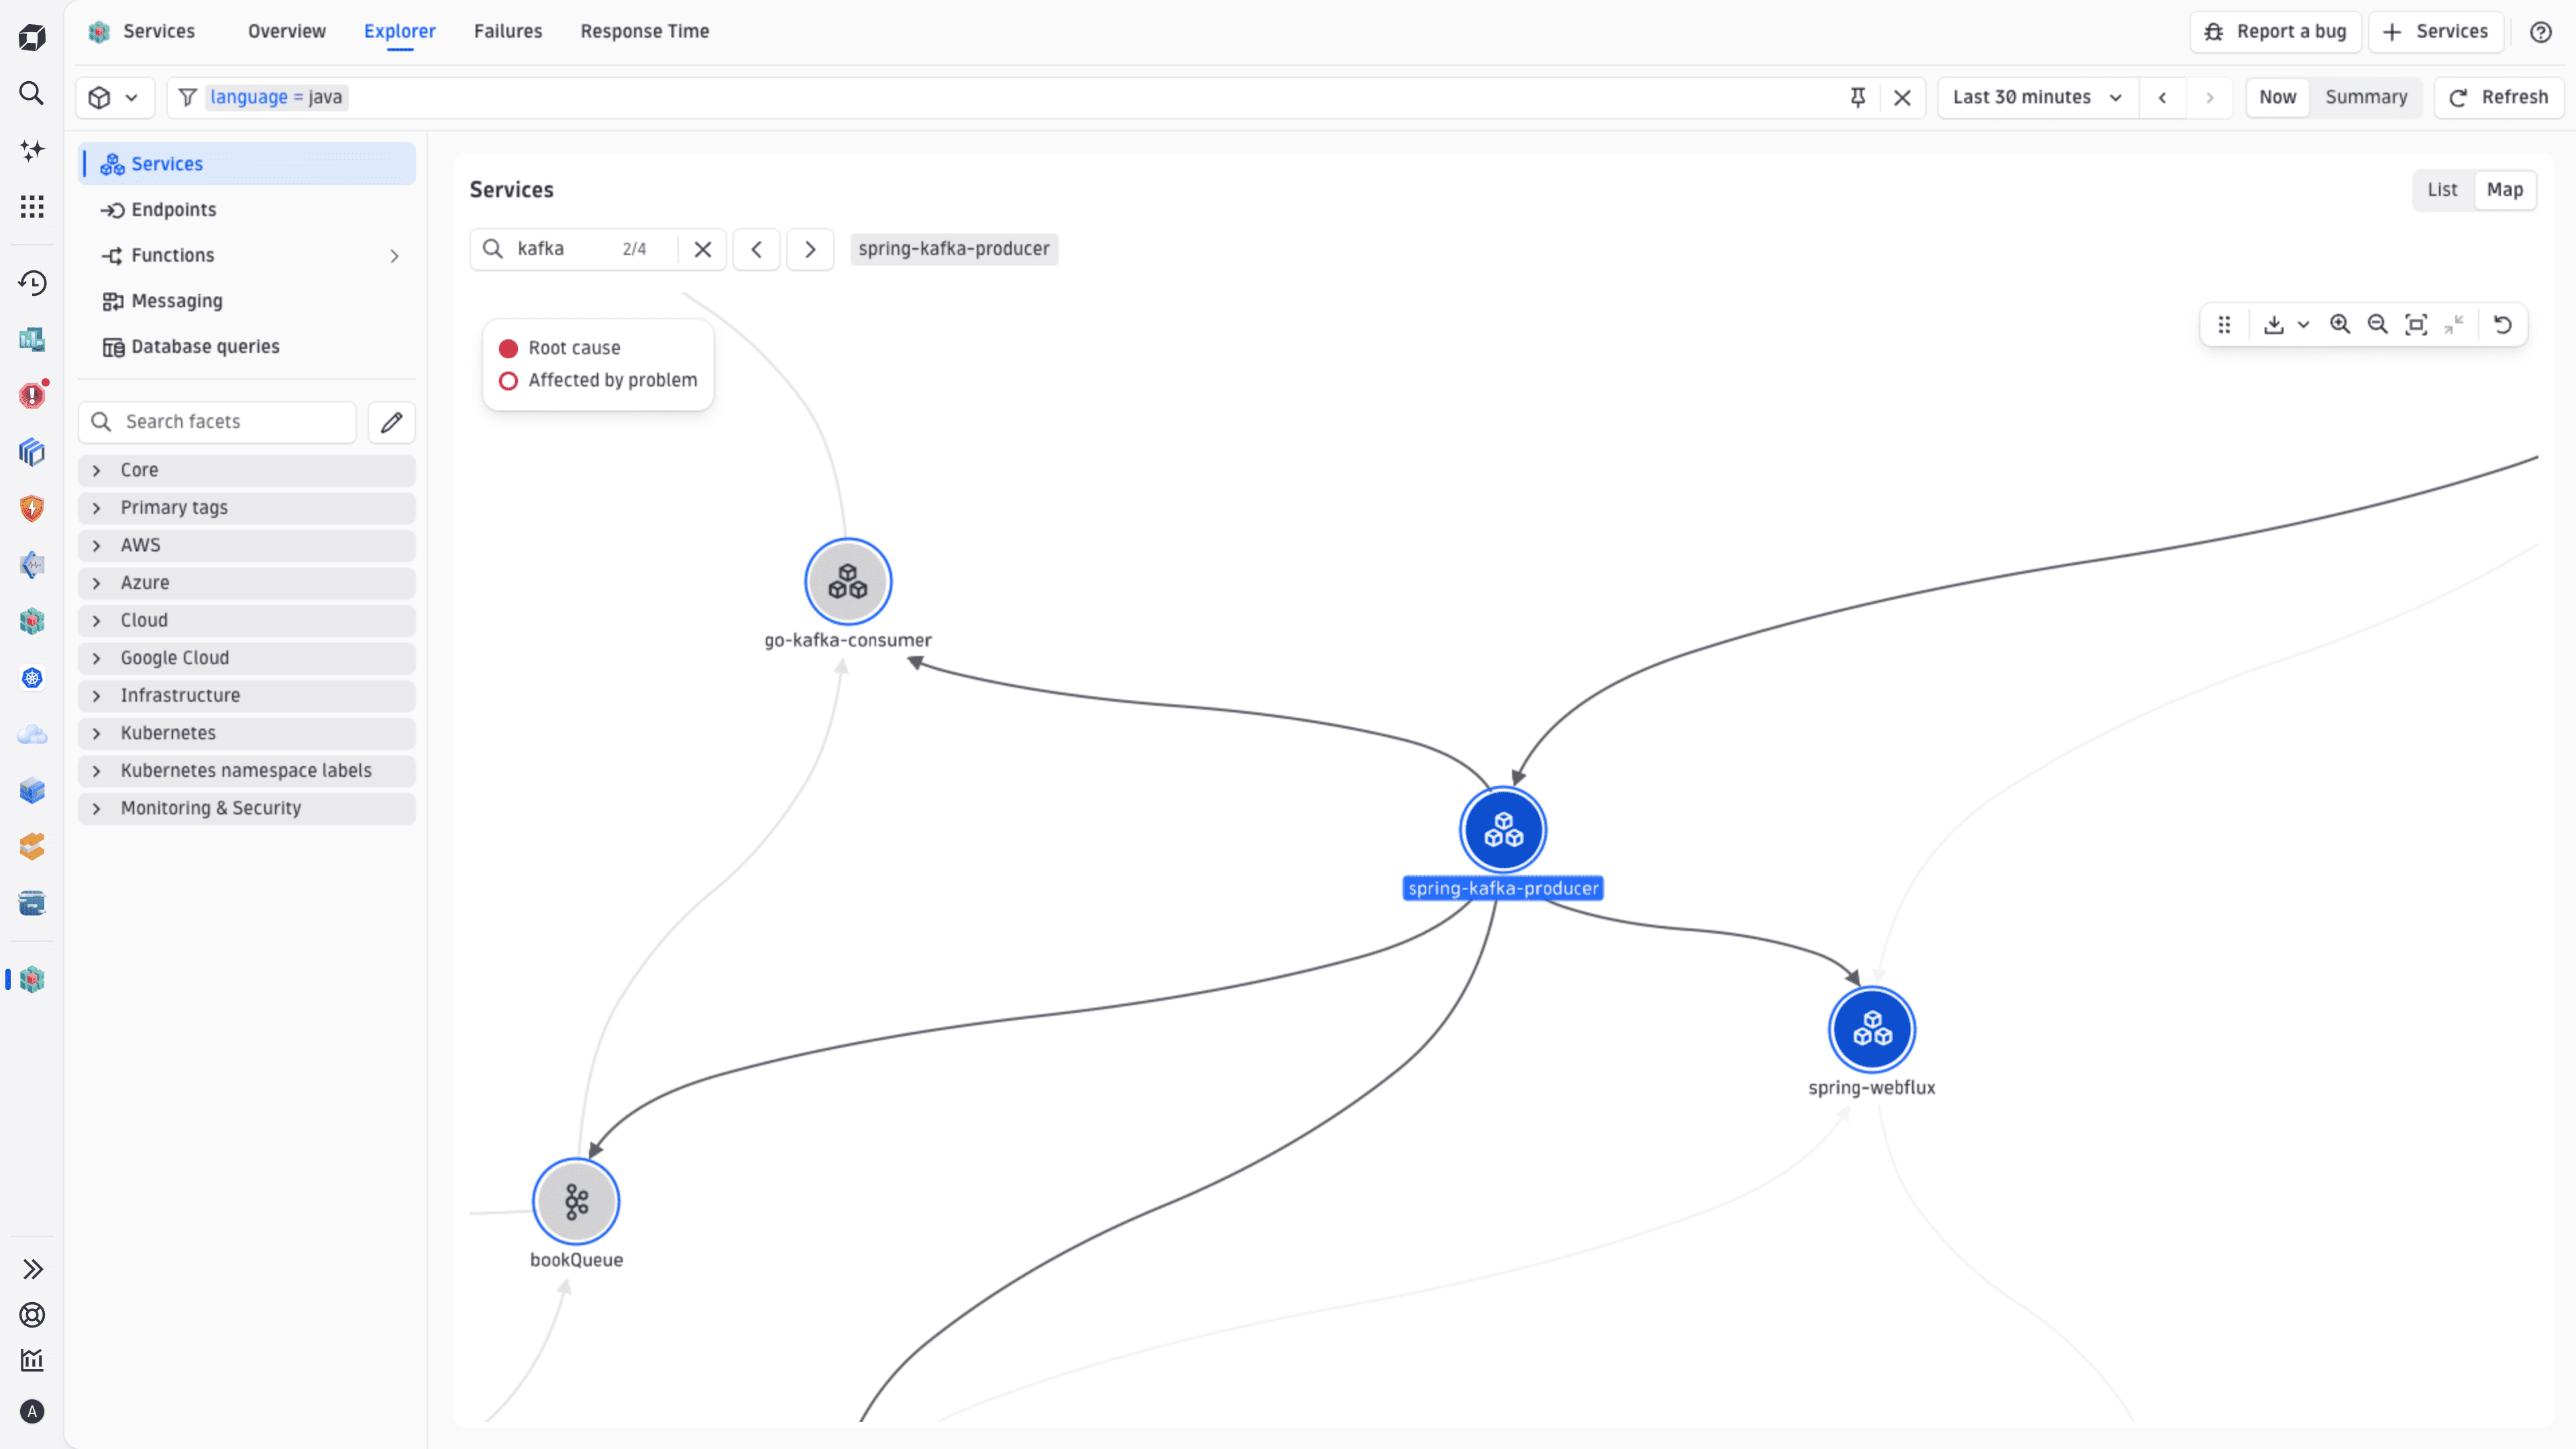
- Inline search and filters to find and scope services in large environments.
- Performance and health indicators on each node.
- Drill-downs from the map into individual analysis views.
- Distinct nodes and icons for services, databases, and queues to make data‑tier dependencies obvious.
- List/Map toggle so that you can switch between a filtered services list and the topology map while preserving context.
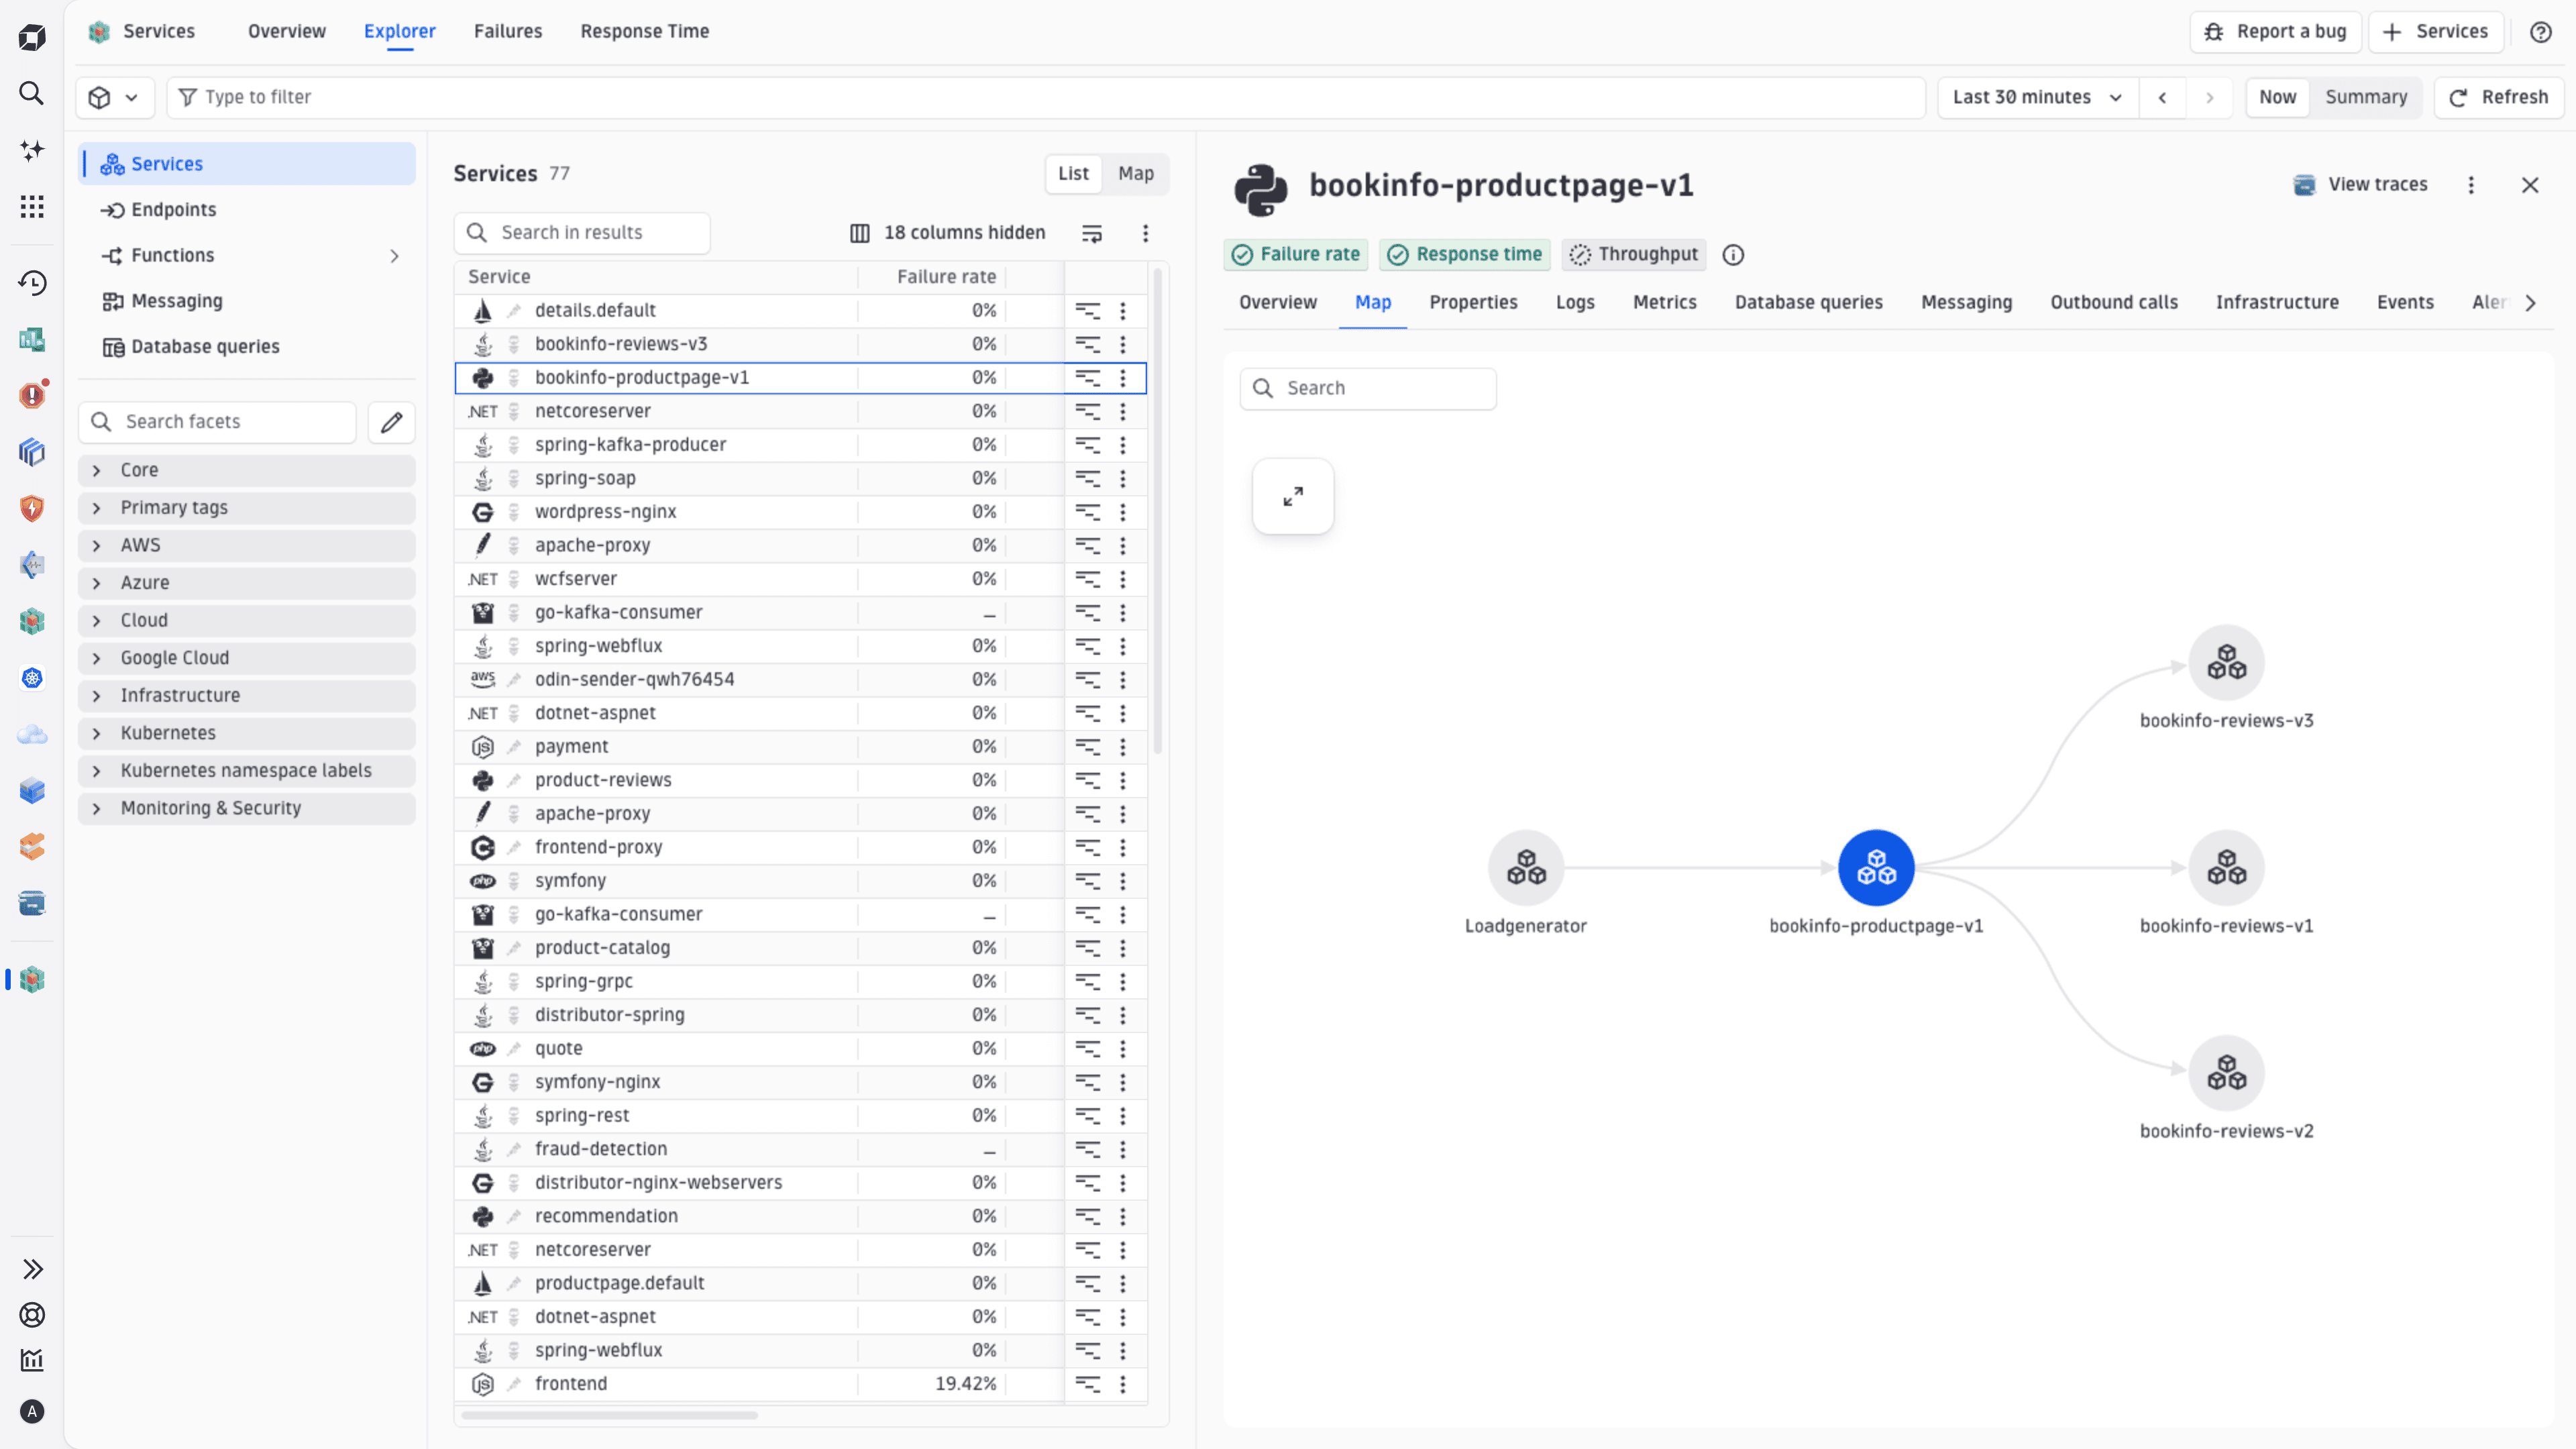
- Detailed dependency view in the details panel of a specific service.
Prerequisites
- Access to Services in your Dynatrace environment.
- Services instrumented with OneAgent or OpenTelemetry.
Access and navigate a service map
The Service Map is available in the Explorer (Early Access) view in Services.
Access a service map
To open a service map for all services
- Go to Services > Explorer (Early Access).
- Select Map in the view toggle located in the upper-right corner above the service list.
To open a service map for a specific service
- Go to Services > Explorer (Early Access).
- Find and select the required service from the service list. The service details panel opens.
- Go to the Map tab on the service details panel.
Explore a service map
Once you open a service map, you can:
- Zoom in and out to navigate and explore large topologies.
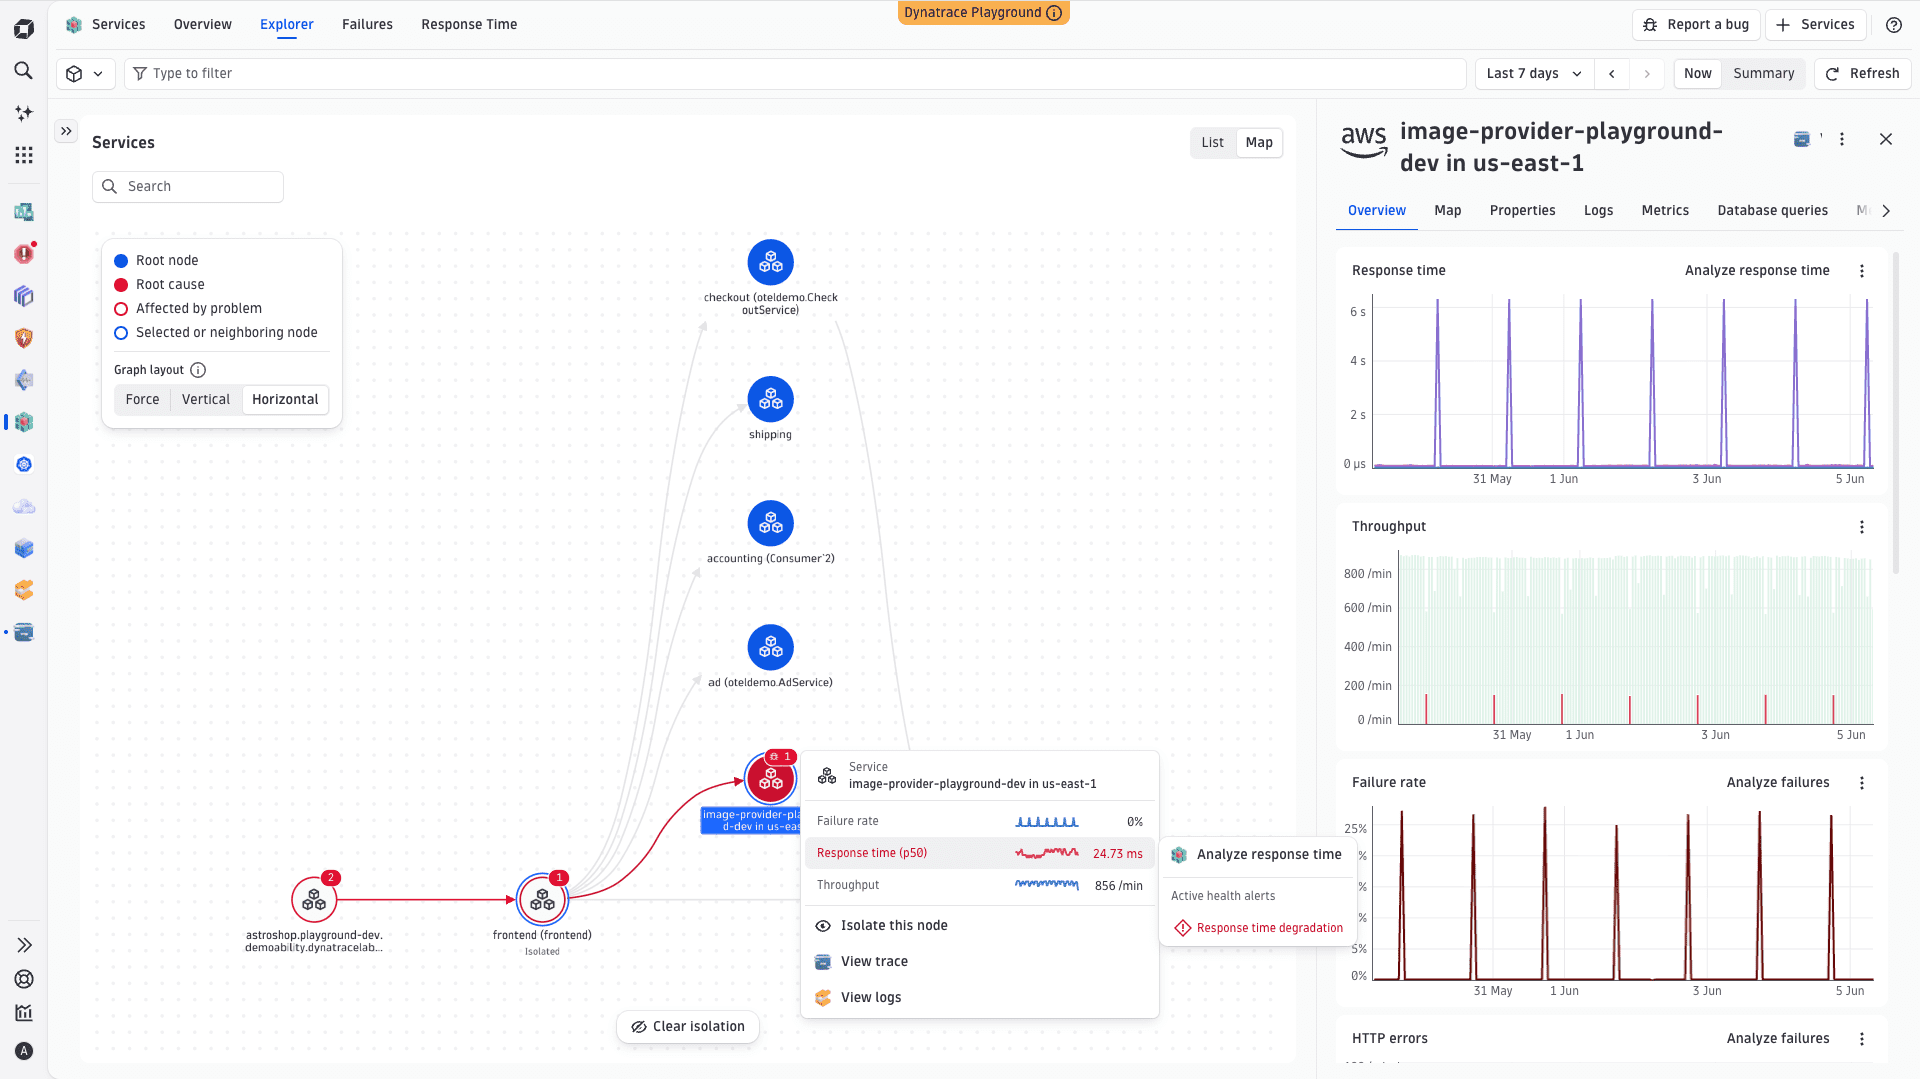
- Hover over a node to check the node details.
- Select a node to focus on the node details and perform additional actions, for example, analyze service performance or drill down to logs or traces.
- Use the search field in the upper-left corner of the service map as well as the filter field and facets in Services to find services by name, ID, tag, namespace, or other common attributes.
- Pay attention to the node colors, as different colors indicate root causes and nodes affected by a problem.
- Check the numbers displayed on some nodes, which indicate the number of active health alerts.
- Download a full or current map view as PNG.
Check node details
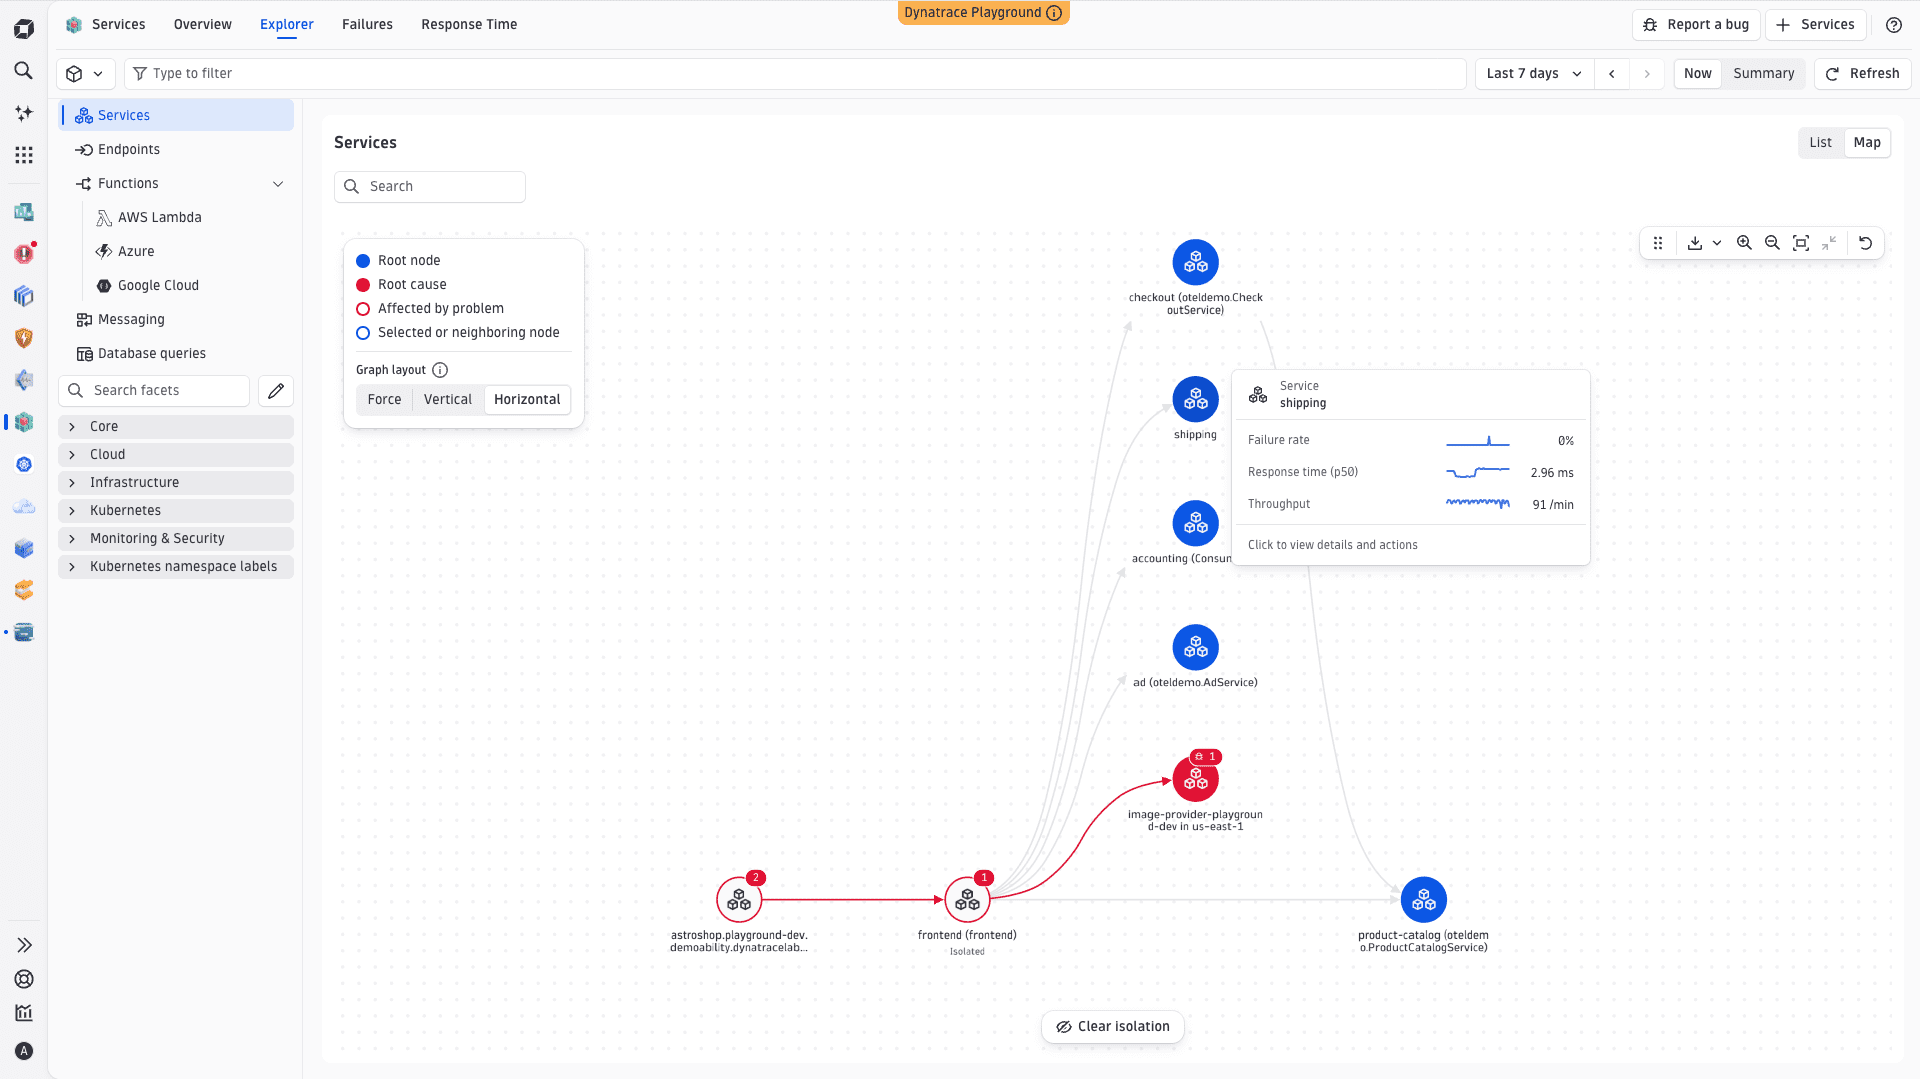
On the service map, hover over a node to see the node details. The following metadata is displayed:
- Service, Database, Queue, or Frontend node
- Node name
- Related metrics
- Active health alerts
- Additional details depending on the node type
Nodes and related metrics
The following nodes and their associated metrics are available.
| Node | Metrics |
|---|---|
Service |
|
Database |
|
Queue |
|
Frontend |
|
The available metrics depend on how the node was discovered. Smartscape-based nodes provide full performance insights, while metric-based nodes with no corresponding Smartscape entity show limited data.
Drill down to traces, logs, and more
The service map integrates with existing drill‑down workflows, so you can navigate from a service map node to  Distributed Tracing or
  Logs, while preserving the node context. For example, when you perform an action on a service node, the service is pre-selected in the filter field, while the timeframe remains unchanged.
On the service map, select a node to view node details and actions. The following actions are available:
-
Failure rate > Analyze failures: Go to the Failures tab to identify what's causing request failures and compare failure trends over time.
-
Response time (p50) > Analyze response time: Go to the Response Time tab to understand latency patterns and spot performance regressions.
-
View trace: Go to Distributed Tracing to investigate individual requests end-to-end.
-
View logs: Go to Logs to see log events emitted during service execution.
-
Domain apps: Navigate to relevant apps for non-service nodes.
 Experience Vitals for frontend nodes
 Databases for databases monitored via extensions
 Clouds for databases monitored via cloud monitoring
Opening
Databases or Clouds is only available for database nodes backed by a Smartscape node. Database nodes derived from metrics without a corresponding Smartscape entity don't support this action. For details, see Database monitoring methods.
Limitations
The Service Map has the following known limitations:
- In large environments, the density of a service map can be high. Use filters and facets to scope the view to relevant services.
- Some cloud‑managed entity visualizations and advanced database and queue analysis are available in dedicated apps (for example, Databases and Clouds). The service map provides navigation to those apps but not the full depth of specialized analysis.
Next steps
The Service Map is one of the features in the Explorer (Early Access) view in Services. For deeper investigation, also explore Failure Analysis and Response Time Analysis on their dedicated tabs in the same app.
 Services