Analyze exceptions in Distributed Tracing app
- Latest Dynatrace
- How-to guide
- 4-min read
Exception analysis in  Distributed Tracing provides a comprehensive view of exceptions occurring along your traces, helping you identify, analyze, and resolve issues faster. It offers visual trends, advanced filtering, aggregated stack traces, and contextual logs with insights into requests containing exceptions, including sub-traces.
Prerequisites
- DPS license
- SaaS environment with the latest Dynatrace platform
What is exception analysis?
An exception is an error or unexpected condition that occurs during code execution. Exceptions may result from programming errors, invalid inputs, resource issues, or external service failures.
Exceptions are captured during a span either by OneAgent or via OpenTelemetry. Exception analysis leverages the semantics defined in the Semantic Dictionary, which are based on OpenTelemetry semantic conventions.
Exception analysis helps you detect, investigate, and resolve exceptions more effectively. It introduces a user-focused interface with advanced capabilities for both reactive and proactive troubleshooting. This feature is designed for SREs, developers, and DevOps teams who need insights into exception patterns and their impact on services.
Exception analysis includes the following capabilities.
- Advanced filtering: Use Dynatrace filters to narrow down exceptions by attributes such as service, endpoint, failures, timeframe, segments, and facets.
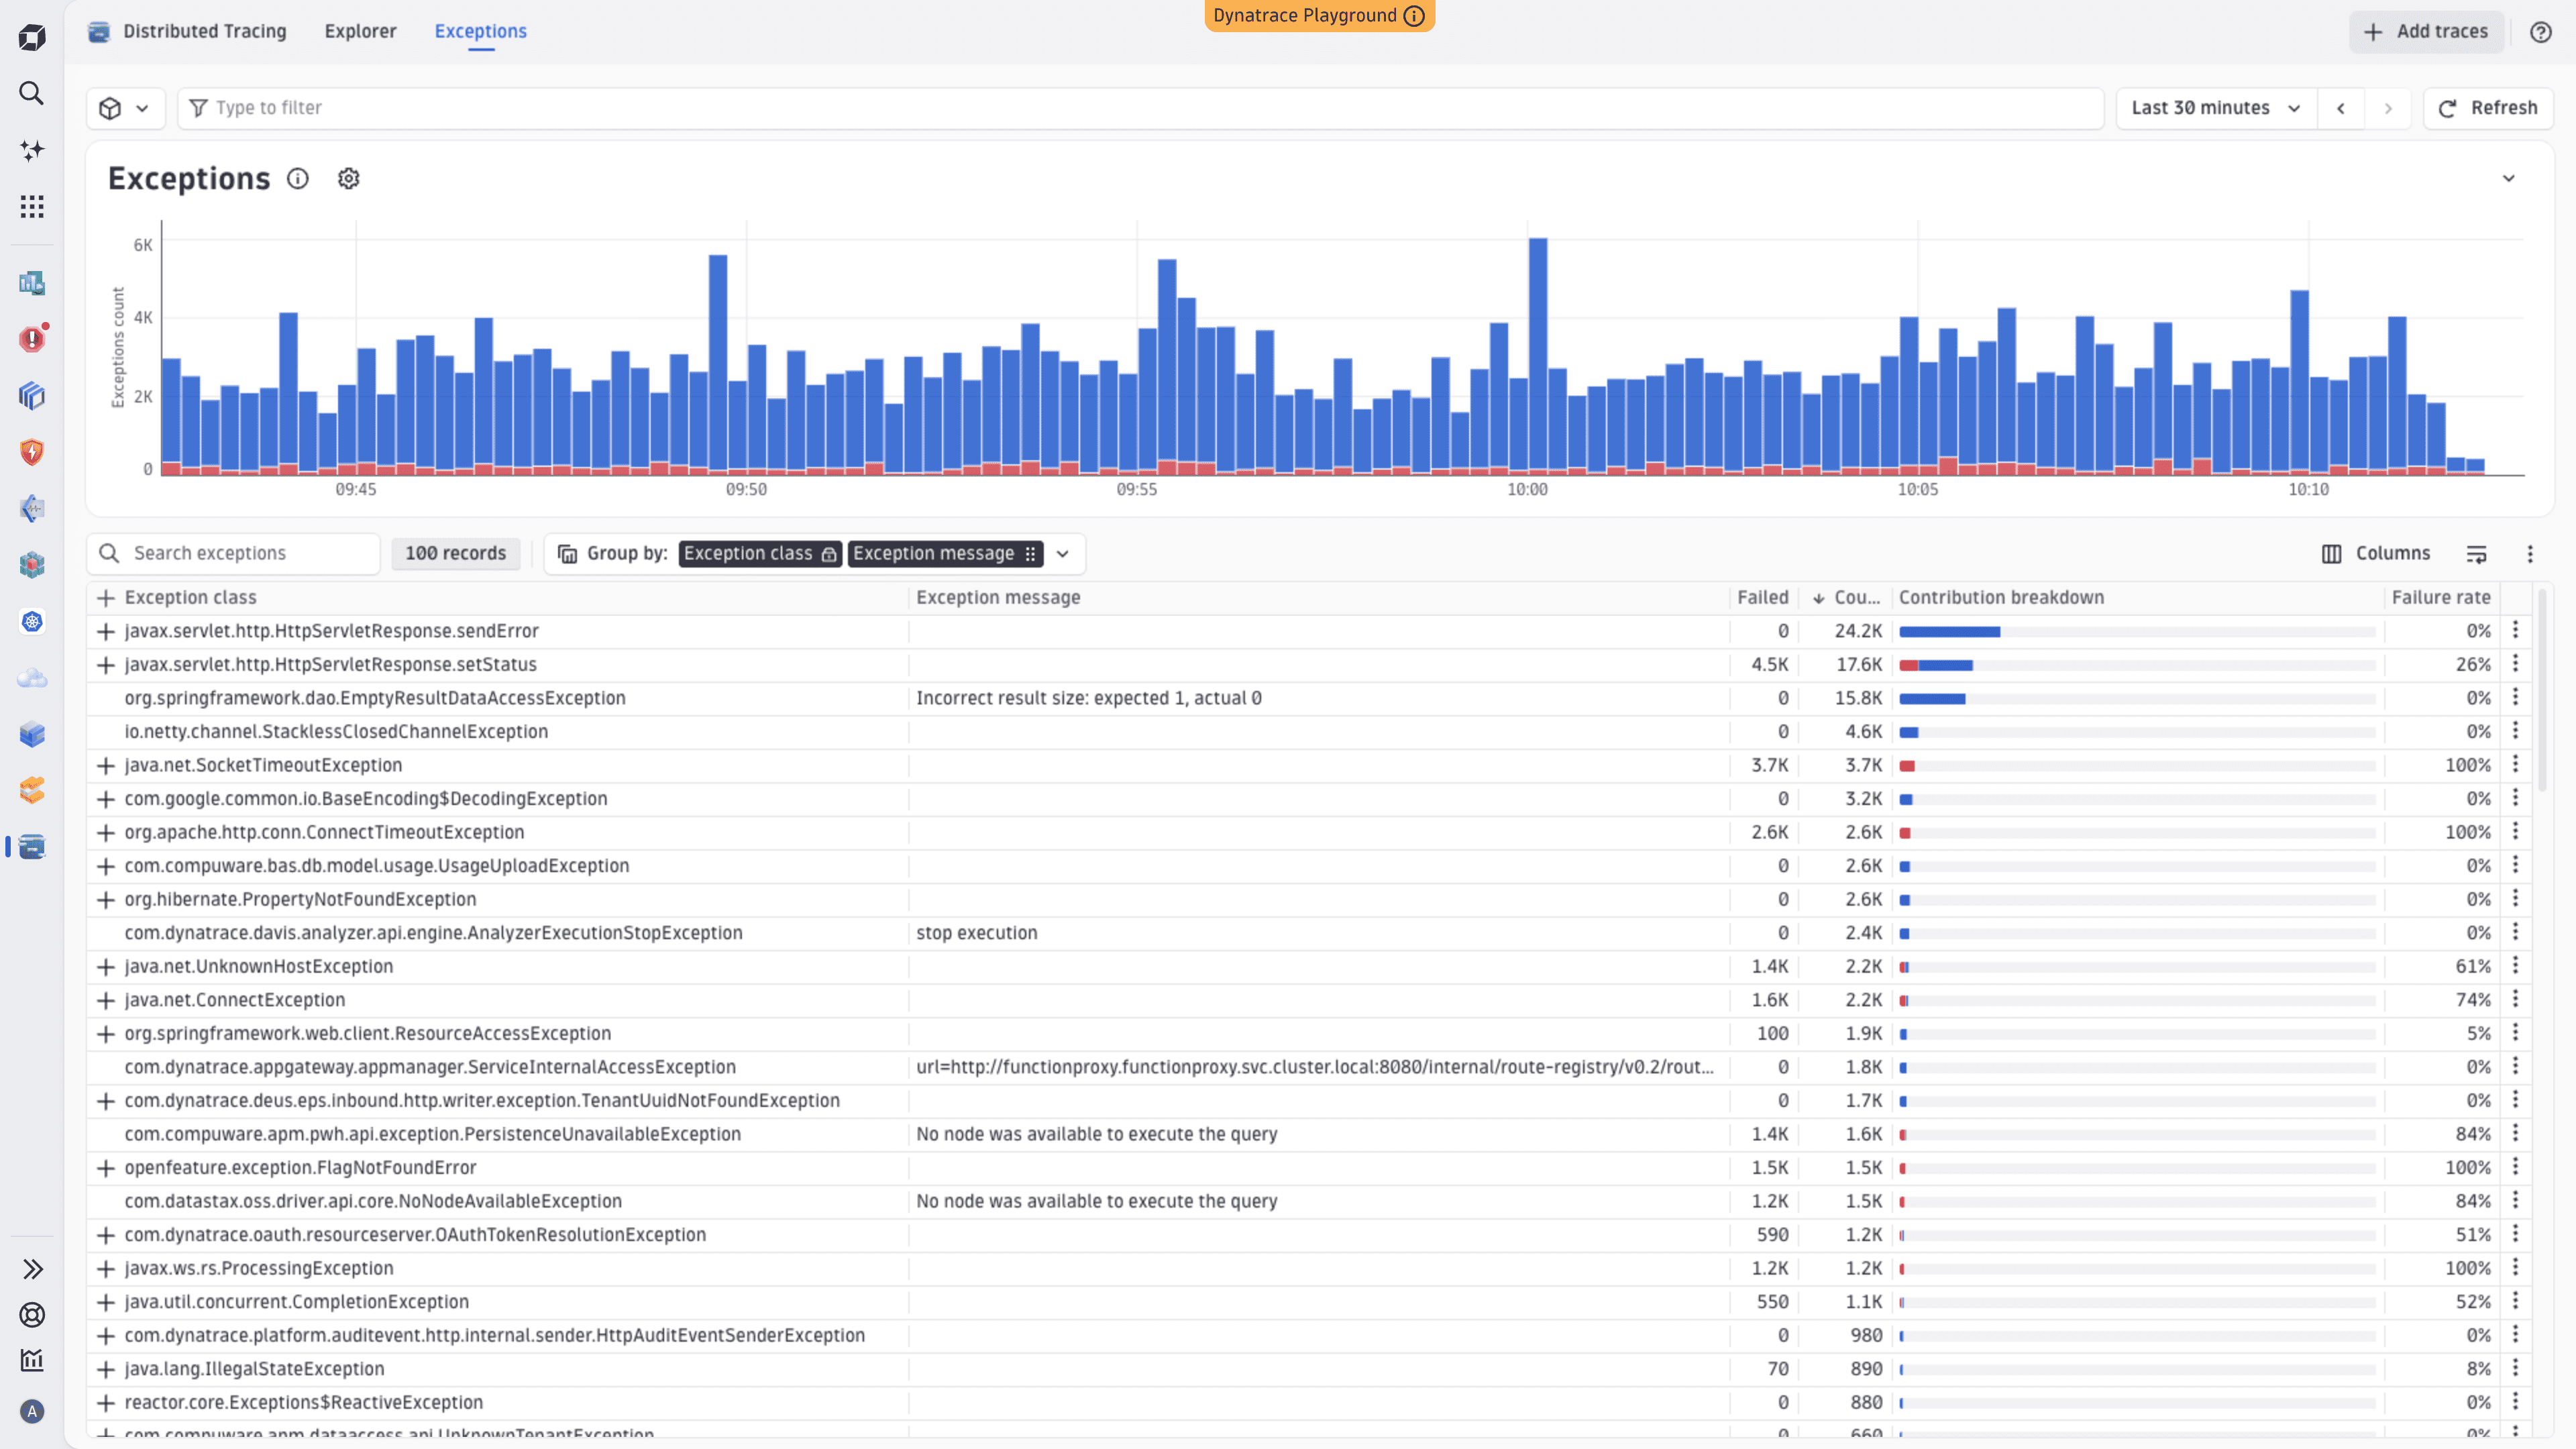
- Exception trend chart: Visualize exception trends over time. Failing exceptions are highlighted in red so that you can spot failure impact at a glance.
- Exceptions table: View a detailed list of exceptions, including their type, frequency, and impact. Select an exception to highlight its trend in the chart.
- Aggregated stack traces: Explore aggregated stack traces for each exception to identify common code paths and pinpoint root causes. The Contribution breakdown column shows the failure status for each entry via a Failed label and a color-coded bar (red for failed, blue for successful, gray for remaining).
- Related logs: View logs related to each exception to correlate log events with exception occurrences.
- Requests containing exceptions: Analyze requests that contained the selected exception, either directly or within a sub-trace, to understand how exceptions affect specific transactions.
Access and navigate exceptions
Exception analysis is designed to support both contextual and exploratory workflows.
Explore exceptions
To explore Exceptions directly
- Go to Distributed Tracing.
- Go to the Exceptions tab.
Analyze exceptions in context
To analyze exceptions in context
- Go to
 Services.
 - Turn on Analyze details.
- Select the Exceptions tab.
Troubleshoot service exceptions
To start troubleshooting service exceptions
-
Go to
Distributed Tracing > Exceptions. -
Apply filters for service, endpoint, and timeframe.
-
Select an exception from the table to highlight its trend in the chart and see additional details for further analysis in the exception details panel.
-
From the exception details panel, go to the required tab.
- Stack traces to see the aggregated stack traces for the selected exception. These stack traces are grouped to show common execution paths with their contribution, making it easier to understand what they have in common and where they deviate from each other. You can also use the Contribution breakdown column to see how many occurrences in each stack trace resulted in failures.
- Logs to examine logs happening on these spans containing the exception.
- Requests tab to see endpoints impacted by exceptions.
Next steps
After identifying exceptions, use Failure Analysis to correlate them with failed requests and explore failure trends across services. To act on AI-detected problems, go to  Problems.
Join the conversation
We'd love to hear your feedback and questions about the Exceptions analysis experience. Visit the Feedback Channel in the Dynatrace Community.
Distributed Tracing