Identify upstream callers with Backtrace
- Latest Dynatrace
- How-to guide
- 4-min read
- Published Sep 23, 2026
When you observe an issue in your infrastructure, such as a slow database query, an outbound call with elevated errors, or a failing endpoint, the natural question is "what entity calls this?" The Backtrace feature answers that question for services, endpoints, database statements, and outbound calls.
Using a specific query or URL as a filter, Dynatrace walks backward through distributed trace data to reconstruct the full upstream call chain, revealing which services drive the observed behavior and how much traffic each contributes. The result is a ranked, aggregated backtrace tree showing all upstream callers, all the way back to the originating entry points.
The Backtrace feature is available in  Services. Opening a backtrace from
  Distributed Tracing is coming soon.
Prerequisites
- Backend instrumented with OneAgent or OpenTelemetry.
- Access to Services.
Apart from that, no special configuration is required. Dynatrace can analyze any service, database statement, or outbound call captured in Grail span data by OneAgent or OpenTelemetry instrumentation.
Key terms
The following terms describe the key concepts of the Backtrace feature.
- Backtrace
The set of spans matching the current filter. These are the starting points for upstream traversal.
- Matching service
A service that contains spans matching the filter. Appears as a root node in the backtrace tree.
- Upstream caller
A service that called a matching service (or another upstream caller). Appears as expandable children in the backtrace tree.
- Backtrace tree
The aggregated tree structure showing the call chain from matching services back through their callers, level by level.
Access backtraces from Services
The Backtrace view is available from two entry points in Services:
- Database queries section that shows all database statements run by a service.
- Outbound calls tab that shows outbound HTTP/gRPC calls made by a service.
Regardless of the entry point, the Backtrace view title includes the filter label (for example, Backtrace for: SELECT * FROM orders), providing context for your analysis.
The Backtrace view is available in both the Explorer view and the new Explorer (Early Access) view. It's shown only when span data is available for the entry.
View backtraces from "Database queries" section
To view backtraces from the Database queries section in Services
- Go to Services > Explorer.
- Navigate to the Database queries view.
-
To see all queries executed across your services, select Database queries in the sidebar panel on the left.
-
To see queries made by a particular service, select the required service, and go to the Outbound calls tab from the service details panel.
-
Perform one of the actions depending on what filter you want to apply to the backtrace.
-
To view a backtrace filtered to a query text across all services, select (Action menu) >
View backtrace in the query cell (Query column).The Backtrace view that opens answers the following question: across the entire environment, what entities run this query?
-
To view a backtrace filtered to a query text scoped to the current service, select (Action menu) >
View backtrace in the row (the last column where you see icons).
-
The Backtrace view that opens answers the following question: what entities call this service with this query?
View backtraces from "Outbound calls" tab
To view backtraces from the Outbound calls tab in Services
-
Go to
Services > Explorer. -
Select the required service.
-
From the service details panel, go to the Outbound calls tab.
-
Perform one of the actions depending on what filter you want to apply to the backtrace.
- To view a backtrace filtered to a call URL/attribute across all services, select (Action menu) > View backtrace in the URL cell (Outgoing URL column).
- To view a backtrace filtered to a call URL/attribute scoped to the current service, select (Action menu) > View backtrace in the row (the last column where you see icons).
- To view a backtrace filtered to a call URL/attribute across all services, select (Action menu) >
Explore the backtrace tree
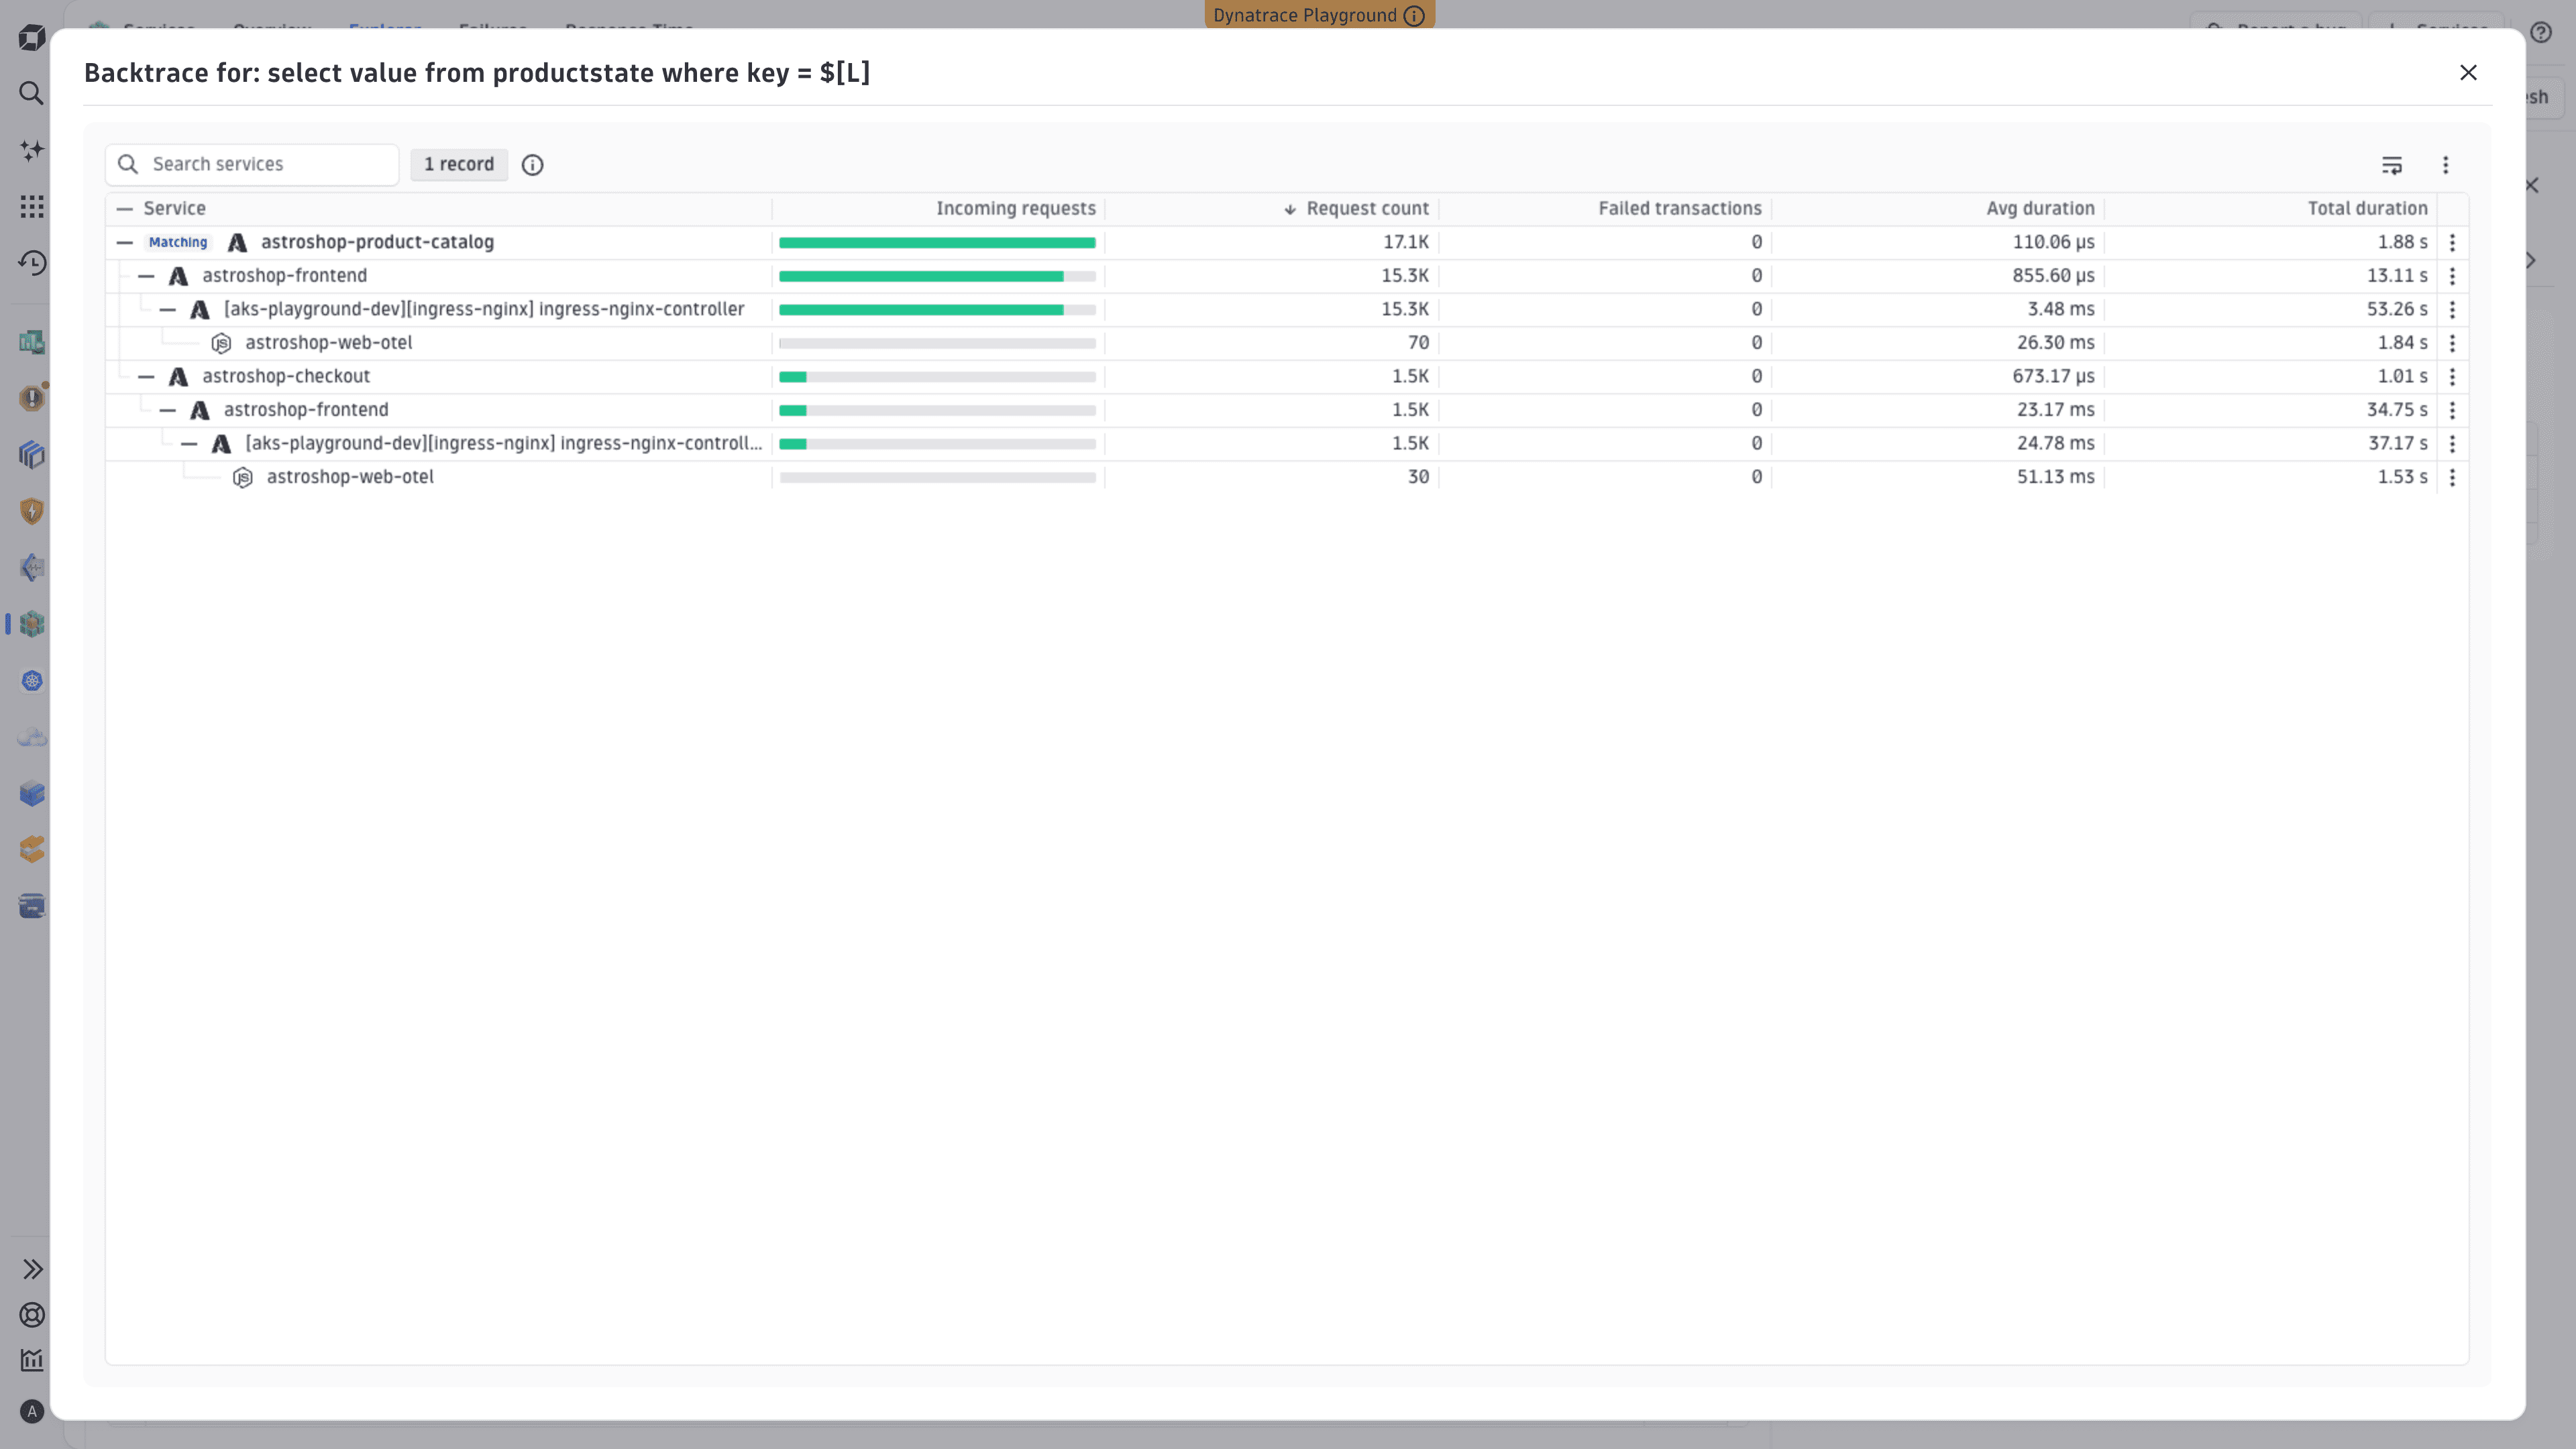
The Backtrace view displays an upstream call tree showing the services that drive the observed behavior. The backtrace tree is sorted by request count (highest first), so the busiest matching service appears at the top.
Each root node in the backtrace tree is a service whose spans match your filter. Root nodes are marked with a Matching label. A record count badge shows how many matching services were found and how many traces were analyzed. To see how many traces were analyzed and which sampling ratio was used, select the query info chip next to the search field.
View upstream callers
Expand a root node to reveal the services that called it, and expand those services to view their own upstream callers, all the way back to the originating entry points.
Find services
Use the search bar (labeled Search services) to filter visible service names within the backtrace tree.
Assess traffic volume and health at each tree level
For each entry in the backtrace tree, the following information is available, presented as a table. Use this information to evaluate traffic volume and health at each backtrace tree level.
- Service: Service name with the tree expansion control. A root service shows a Matching badge.
- Incoming requests: Stacked bar that gives an at-a-glance view of both volume and health: width reflects the service's share of total traffic across all root services, while green represents successful requests and red represents the failed ones.
- Request count: Estimated number of requests for this service at this tree position, adjusted to account for sampling.
- Failed transactions: Count of failed spans for this service at this tree position.
- Avg duration: Average span duration at this tree position.
- Total duration: Sum of span durations at this tree position.
Drill down to service details and analysis views
Each row in the backtrace tree has a context menu with actions for deeper investigation in Services.
To navigate from the backtrace tree to service details or analysis views
-
In the required row, select (Action menu), and then choose one of the options.
- View service to check the detailed information for a specific service.
- Analyze failures to view failure rates and error types for a specific service. Use this option to pivot directly into the Failure Analysis view for any upstream service.
- Analyze response time to see latency patterns for a service in depth. Use the Response Time Analysis view to connect an upstream caller to its own response time data.
Backtrace analysis examples
Use the Backtrace view to investigate performance problems and understand which services are responsible for the load or failures you observe.
Investigate a slow or failing database query
Issue: You've noticed a specific SQL statement that spikes in duration or errors.
Solution: In the Database queries view in Services, select View backtrace in the query row to see which services call that query, ranked by volume. The backtrace tree reveals the exact callers and how much traffic each contributes, without manually cross-referencing traces.
Issue: You don't know which services across your environment run a particular SQL statement.
Solution: In the Database queries view in Services, select View backtrace in the query text cell (not the row) to open the Backtrace view without a service scope. The backtrace tree shows every service across the environment that runs the query, along with their traffic volumes and upstream origins.
Trace the origin of elevated outbound call volume
Issue: You've noticed that a service makes unexpectedly high volumes of outbound HTTP calls.
Solution: In Services, on the Outbound calls tab for that service, find the URL with unexpectedly high volume. Select View backtrace in the row to see which upstream services trigger those calls and in what proportion.
Timeframe and data volume
The Backtrace feature analyzes a representative sample of traces matching your filter, limited to the most recent 24 hours of your selected timeframe. If your selected timeframe is longer than 24 hours, Dynatrace automatically uses the most recent 24-hour slice, and the query info chip shows the Trace sampling limited to the most recent 24 hours of your selected timeframe. message.
If the backtrace tree shows the No upstream callers found for the current filter and timeframe. message, widen the timeframe in the app, and open the Backtrace view again.
By default, Dynatrace excludes spans with incomplete upstream chains, meaning any span where a parent span is absent somewhere in the chain. This exclusion keeps request counts consistent: at every level of the backtrace tree, a parent's count equals the sum of its children's counts.
Next steps
Once you've identified which upstream services drive load or failures, use the row action menu in the backtrace tree to go deeper: analyze failures, analyze response time, and inspect the individual traces behind an upstream path in Distributed Tracing.
 ServicesDistributed Tracing