Runtime metrics migration guide
Latest Dynatrace
This guide provides insights into migrating runtime metrics to Grail. Typically, a Grail metric is equivalent to a Metrics Classic metric. In some cases, however, there's no one-to-one relation:
- Divergent: multiple Grail metrics represent a single Metrics Classic metric to provide additional technology-specific insight.
- Convergent: a single Grail metric represents multiple Metrics Classic metrics of a similar scope.
- Unsupported: no Grail metric is planned to represent the Metrics Classic metric.
Divergent metrics
When multiple Grail metric keys provide support for a single Metrics Classic metric, not all values can be converted to the respective new metric keys. For example, the following example queries return equivalent results.
Example 1
-
Metrics Classic
builtin:tech.jvm.memory.gc.collectionTime:filter(and(or(in("dt.entity.process_group_instance",entitySelector("type(process_group_instance),entityName.equals(~"MyGoProcessGroup-IG-1~")"))))):auto -
DQL
timeseries collection_time = sum(dt.runtime.go.gc.collection_time),filter:in(dt.entity.process_group_instance, classicEntitySelector("type(process_group_instance), entityName.equals(\"MyGoProcessGroup-IG-1\")"))
Example 2
-
Metrics Classic
builtin:tech.jvm.memory.gc.collectionTime:filter(and(or(in("dt.entity.process_group_instance",entitySelector("type(process_group_instance),entityName.equals(~"MyGoProcessGroup-IG-1~")"))))):auto -
DQL
timeseries collection_time = sum(dt.runtime.go.gc.collection_time),filter:in(dt.entity.process_group_instance, classicEntitySelector("type(process_group_instance), entityName.equals(\"MyGoProcessGroup-IG-1\")"))
Example 3
-
Metrics Classic
builtin:tech.jvm.memory.gc.collectionTime:filter(and(or(in("dt.entity.process_group_instance",entitySelector("type(process_group_instance),entityName.equals(~"MyGoProcessGroup-IG-1~")"))))):auto -
DQL
timeseries collection_time = sum(dt.runtime.go.gc.collection_time),filter:in(dt.entity.process_group_instance, classicEntitySelector("type(process_group_instance), entityName.equals(\"MyGoProcessGroup-IG-1\")"))
Java Node.js .NET Go
The following Metrics Classic metrics for memory pool and garbage collection are JVM-based. Because Grail metrics are technology-specific, there's no direct relation between Metrics Classic and Grail metrics. You need to choose a technology-dedicated metric in Grail.
| Metric key (Grail) | Metric key (Classic) |
|---|---|
| dt.runtime.jvm.gc.total_collection_time dt.runtime.clr.gc.collection_time dt.runtime.go.gc.collection_time | builtin:tech.jvm.memory.gc.collectionTime |
| dt.runtime.jvm.gc.collection_time dt.runtime.nodejs.gc.collection_time | builtin:tech.jvm.memory.pool.collectionTime |
| dt.runtime.jvm.gc.suspension_time dt.runtime.clr.gc.suspension_time dt.runtime.go.gc.suspension_time dt.runtime.nodejs.gc.suspension_time | builtin:tech.jvm.memory.gc.suspensionTime |
ApacheIIS.NGINX
The following Metrics Classic metrics for web servers hold values for different technologies. Because Grail metrics are technology-specific, there's no direct relation between Classic and Grail metrics. You need to choose the Apache, IIS, or NGINX dedicated metric in Grail.
| Metric key (Grail) | Metric key (Classic) |
|---|---|
| dt.runtime.apache.connections.socket_waiting_time dt.runtime.iis.connections.socket_waiting_time | builtin:tech.webserver.connections.socketWaitingTime |
| dt.runtime.apache.requests dt.runtime.iis.requests dt.runtime.nginx.requests | builtin:tech.webserver.requests |
| dt.runtime.apache.threads.active dt.runtime.iis.threads.active | builtin:tech.webserver.threads.active |
| dt.runtime.apache.threads.idle dt.runtime.iis.threads.idle | builtin:tech.webserver.threads.idle |
| dt.runtime.apache.threads.max dt.runtime.iis.threads.max | builtin:tech.webserver.threads.max |
| dt.runtime.apache.traffic dt.runtime.iis.traffic dt.runtime.nginx.traffic | builtin:tech.webserver.traffic |
Convergent metrics
When a single Grail metric provides support for multiple Metrics Classic metrics, all values are converted. To obtain the equivalent results in Grail, use a metric dimension to filter the values. For example, the following metrics return equivalent results.
-
Metrics Classic:
builtin:tech.go.http.responses5xx -
DQL:
dt.runtime.go.http.requestsfiltered by status in the range 500–599-
via DQL queries
timeseries responses5xx = sum(dt.runtime.go.http.requests),filter:{500 <= status and status <= 599} -
via Notebooks
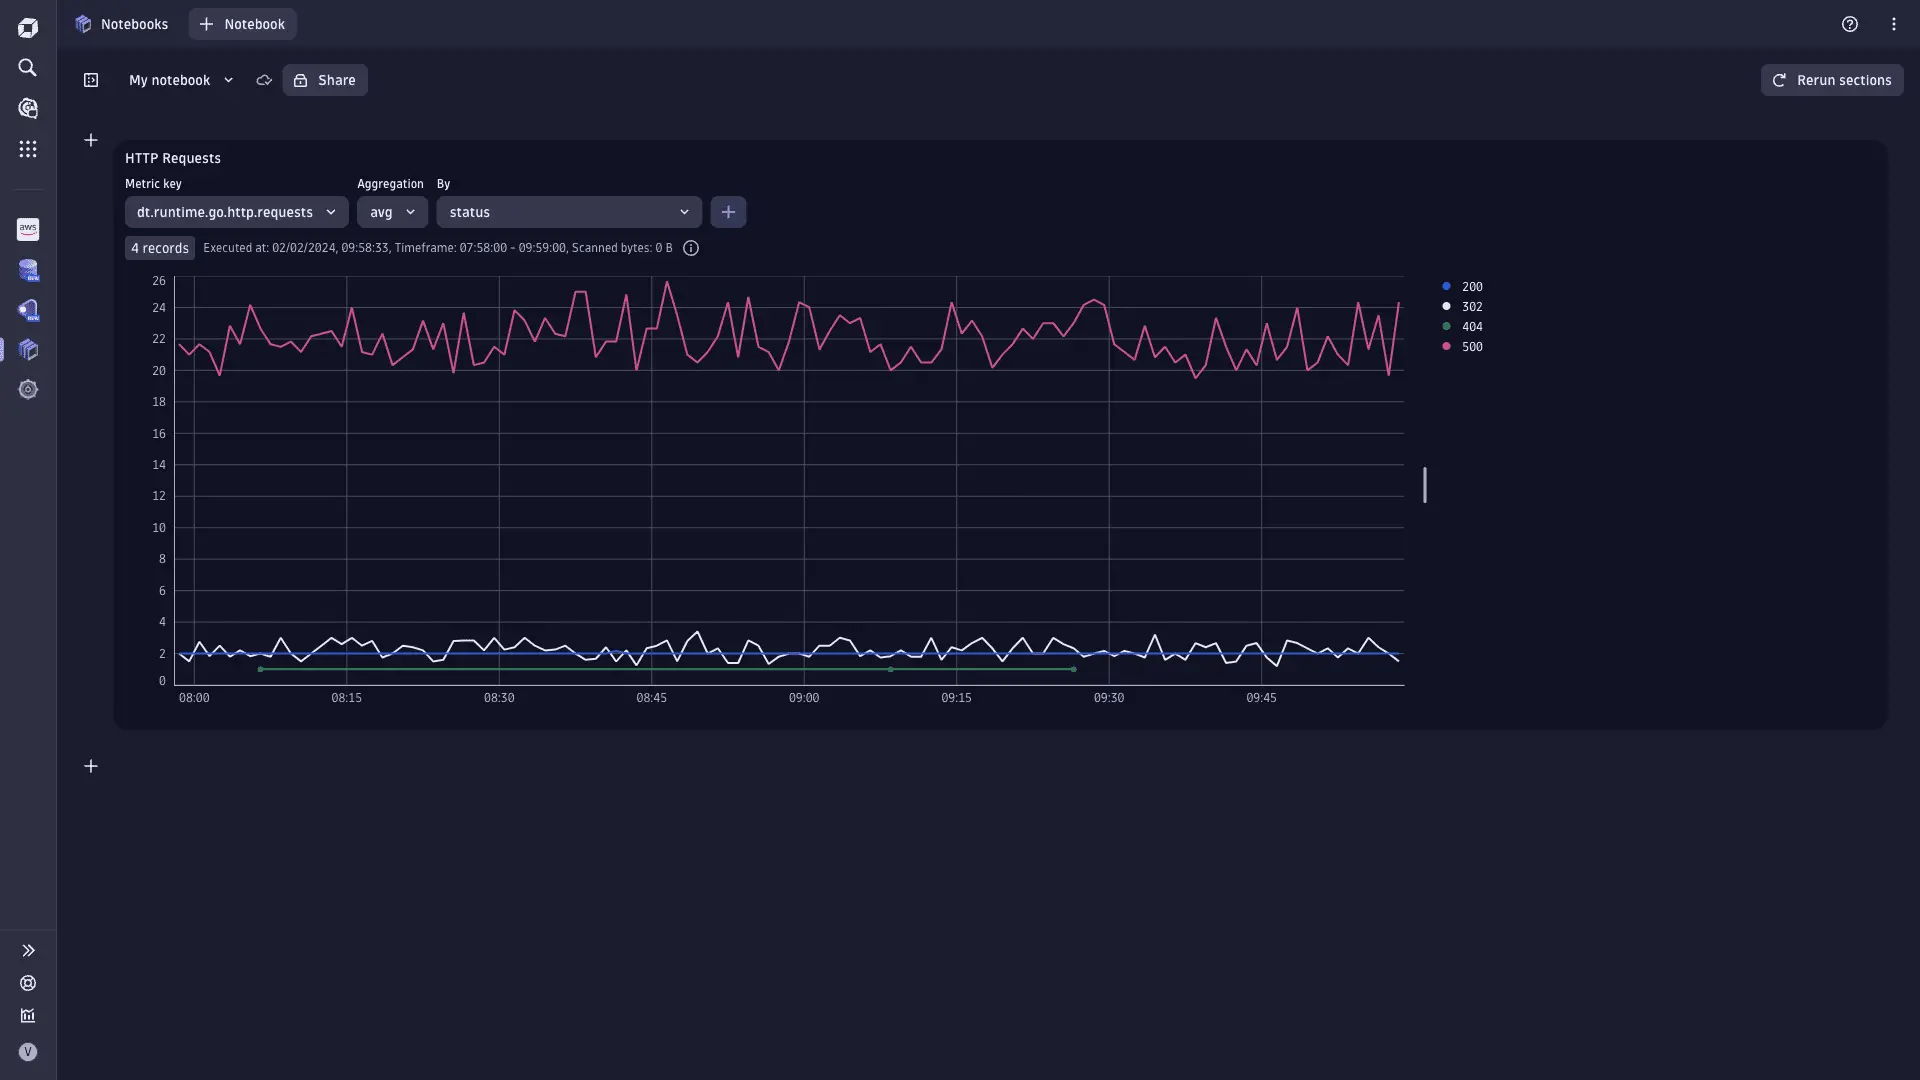
-
Go
| Metric key (Grail) | Filter by | Metric key (Classic) |
|---|---|---|
| dt.runtime.go.cf.auctioneer_lrp_auctions | status (failed or started) | builtin:cloud.cloudfoundry.auctioneer.lprFailed (filtered by process type Go) builtin:cloud.cloudfoundry.auctioneer.lprStarted (filtered by process type Go) |
| dt.runtime.go.http.requests | status (== 502 or >= 500 and <=599) | builtin:tech.go.http.badGateways builtin:tech.go.http.responses5xx builtin:tech.go.http.totalRequests |
| dt.runtime.go.memory.heap | state (idle or live) | builtin:tech.go.memory.heap.idle builtin:tech.go.memory.heap.live |
| dt.runtime.go.scheduler.goroutine_count | owner (user or system) | builtin:tech.go.scheduling.g.runningCount builtin:tech.go.scheduling.g.systemCount |
| dt.runtime.go.scheduler.worker_thread_count | state (Overall, Idling, or Spinning) | builtin:tech.go.scheduling.m.count builtin:tech.go.scheduling.m.idlingCount builtin:tech.go.scheduling.m.spinningCount |
.NET
| Metric key (Grail) | Filter by | Metric key (Classic) |
|---|---|---|
| dt.runtime.clr.gc.collection_count | generation (Generation0, Generation1, or Generation2) | builtin:tech.dotnet.gc.gen0Collections builtin:tech.dotnet.gc.gen1Collections builtin:tech.dotnet.gc.gen2Collections |
| dt.runtime.clr.memory.consumption | generation (Generation0, Generation1, Generation2, and LargeObjectHeap) | builtin:tech.dotnet.memory.gen0Consumption builtin:tech.dotnet.memory.gen1Consumption builtin:tech.dotnet.memory.gen2Consumption builtin:tech.dotnet.memory.LOHConsumption |
| dt.runtime.clr.threadpool.threads | type (activeIOCompletionThreads or activeWorkerThreads) | builtin:tech.dotnet.threadpool.ioCompletionThreads builtin:tech.dotnet.threadpool.workerThreads |
Unsupported metrics
The following Metrics Classic metrics don't have a dedicated Grail metric.
NGINX
-
builtin:tech.nginx.cache.hitRatio
timeseriesmisses = sum(dt.runtime.nginx.plus.cache.misses),hits = sum(dt.runtime.nginx.plus.cache.hits)| fieldsAdd hit_ratio = misses[] / hits[] -
builtin:tech.nginx.serverZones.active
-
builtin:tech.nginx.serverZones.inactive
Node.js
- builtin:tech.nodejs.uvLoop.count
- builtin:tech.nodejs.uvLoop.loopLatency
- builtin:tech.nodejs.uvLoop.processedLatency
- builtin:tech.nodejs.uvLoop.totalTime