Log ingestion via API
- Latest Dynatrace
- Overview
- 3-min read
When you can't install OneAgent, use the Log ingestion API to stream log records to Grail and have Dynatrace transform them into meaningful log messages.
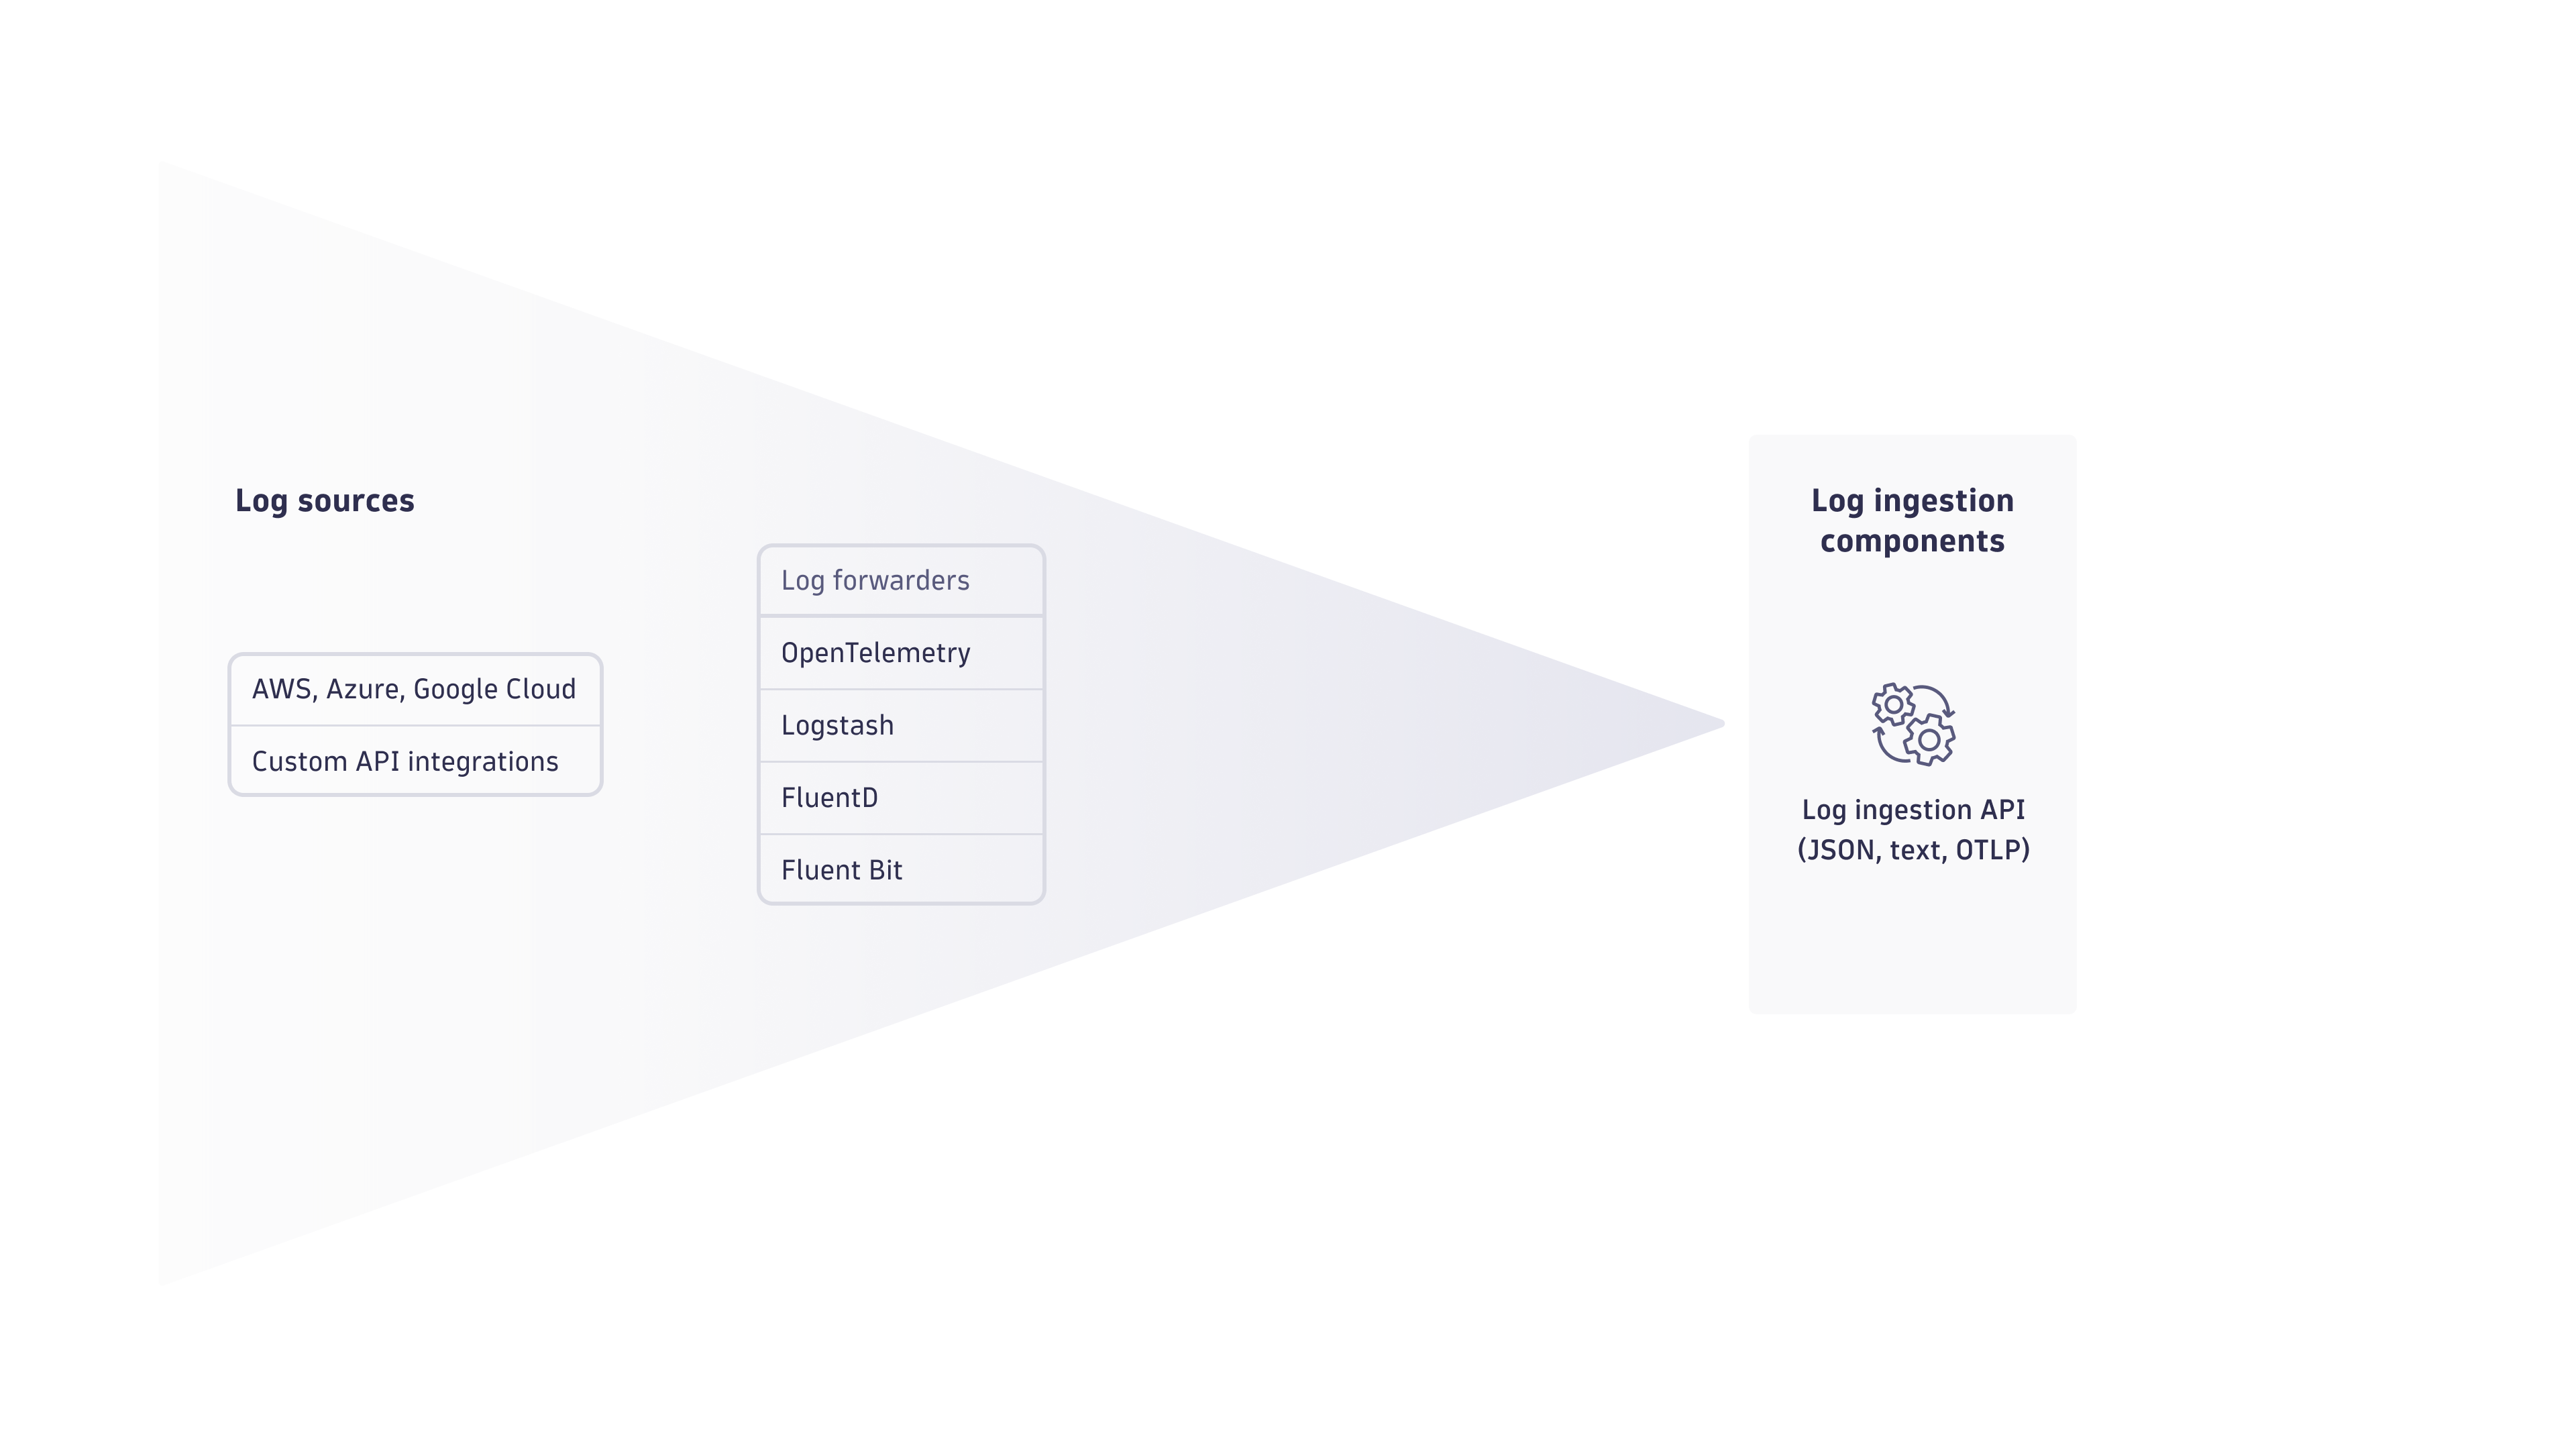
You can configure the Log ingestion API for any log shippers that integrate with the Dynatrace REST API, for example OpenTelemetry Collector, Fluent Bit, Fluentd, and Logstash.
Choose your ingestion format
Dynatrace provides two API options for log ingestion:
- Log Monitoring API v2
- OTLP API
Log Monitoring API v2
The Log Monitoring API v2 accepts logs in JSON or plain-text format (TXT). It's a straightforward REST API suited for log shippers or custom integrations that produce structured JSON or unstructured text.
Supported payload formats include text/plain, application/json, application/jsonl, and application/x-ndjson. For the full list of supported content types, see Log Monitoring API v2 - POST ingest logs.
OTLP API
The OTLP API accepts logs in OpenTelemetry Protocol (OTLP) format using OTLP/HTTP binary (protobuf) encoding. The standard approach is to use the OpenTelemetry Collector as an intermediary between your application and the Dynatrace OTLP logs API.
Endpoints
For Dynatrace SaaS, log ingestion endpoints are available directly in your environment.
If you prefer to route log data through your local network, you can expose the endpoints on an Environment ActiveGate with the Log analytics collector module enabled. Once you've set up your ActiveGate, this module is enabled by default on all ActiveGates. ActiveGate serves the endpoint, collects data, and forwards it to Dynatrace in batches.
To set up an ActiveGate, in  Hub, select ActiveGate > Set up.
- SaaS:
https://{your-environment-id}.live.dynatrace.com/api/v2/logs/ingesthttps://{your-environment-id}.live.dynatrace.com/api/v2/otlp/v1/logs
- Environment ActiveGate:
https://{your-activegate-domain}:9999/e/{your-environment-id}/api/v2/logs/ingesthttps://{your-activegate-domain}:9999/e/{your-environment-id}/api/v2/otlp/v1/logs
For Kubernetes environments, you can use Fluentd or Fluent Bit to forward logs to Dynatrace.
Examples
Log Monitoring API v2
For a full request example, see Log Monitoring API v2 - POST ingest logs.
OTLP API
To ingest logs via OTLP, use the OpenTelemetry Collector as an intermediary between your log source and Dynatrace:
- Deploy the OpenTelemetry Collector.
- Follow the Ingest logs from files with the OTel Collector guide. This includes a sample log file and a ready-to-use Collector configuration.
Retry failed requests
API clients must retry log ingestion requests that fail on retryable errors. Each API endpoint's documentation specifies which response codes are retryable. When retrying, implement an exponential backoff strategy.
Log data queue
If you're using the Environment ActiveGate endpoint, you can customize the log data queue properties by editing the custom.properties file (see Configuration properties and parameters of ActiveGate) on your ActiveGate:
[generic_ingest]#disk_queue_path=<custom_path> # defaults to temp folder#disk_queue_max_size_mb=<limit> # defaults to 300 MB
The log data ingestion API returns an HTTP 503 Usable space limit reached error when the ingested log data exceeds the configured queue size. Typically, this is a temporary situation that occurs only during spikes. If this error persists, increase the value of disk_queue_max_size_mb in custom.properties to allow log ingestion spikes to be queued.
Troubleshooting
Visit Dynatrace Community for troubleshooting guides, and see Troubleshooting Log Management and Analytics.
Related sizing guides
For detailed ActiveGate sizing recommendations based on workload profiles, see:
For guidance on scaling the OpenTelemetry Collector when ingesting logs via OTLP, see How to scale the OTel Collector.