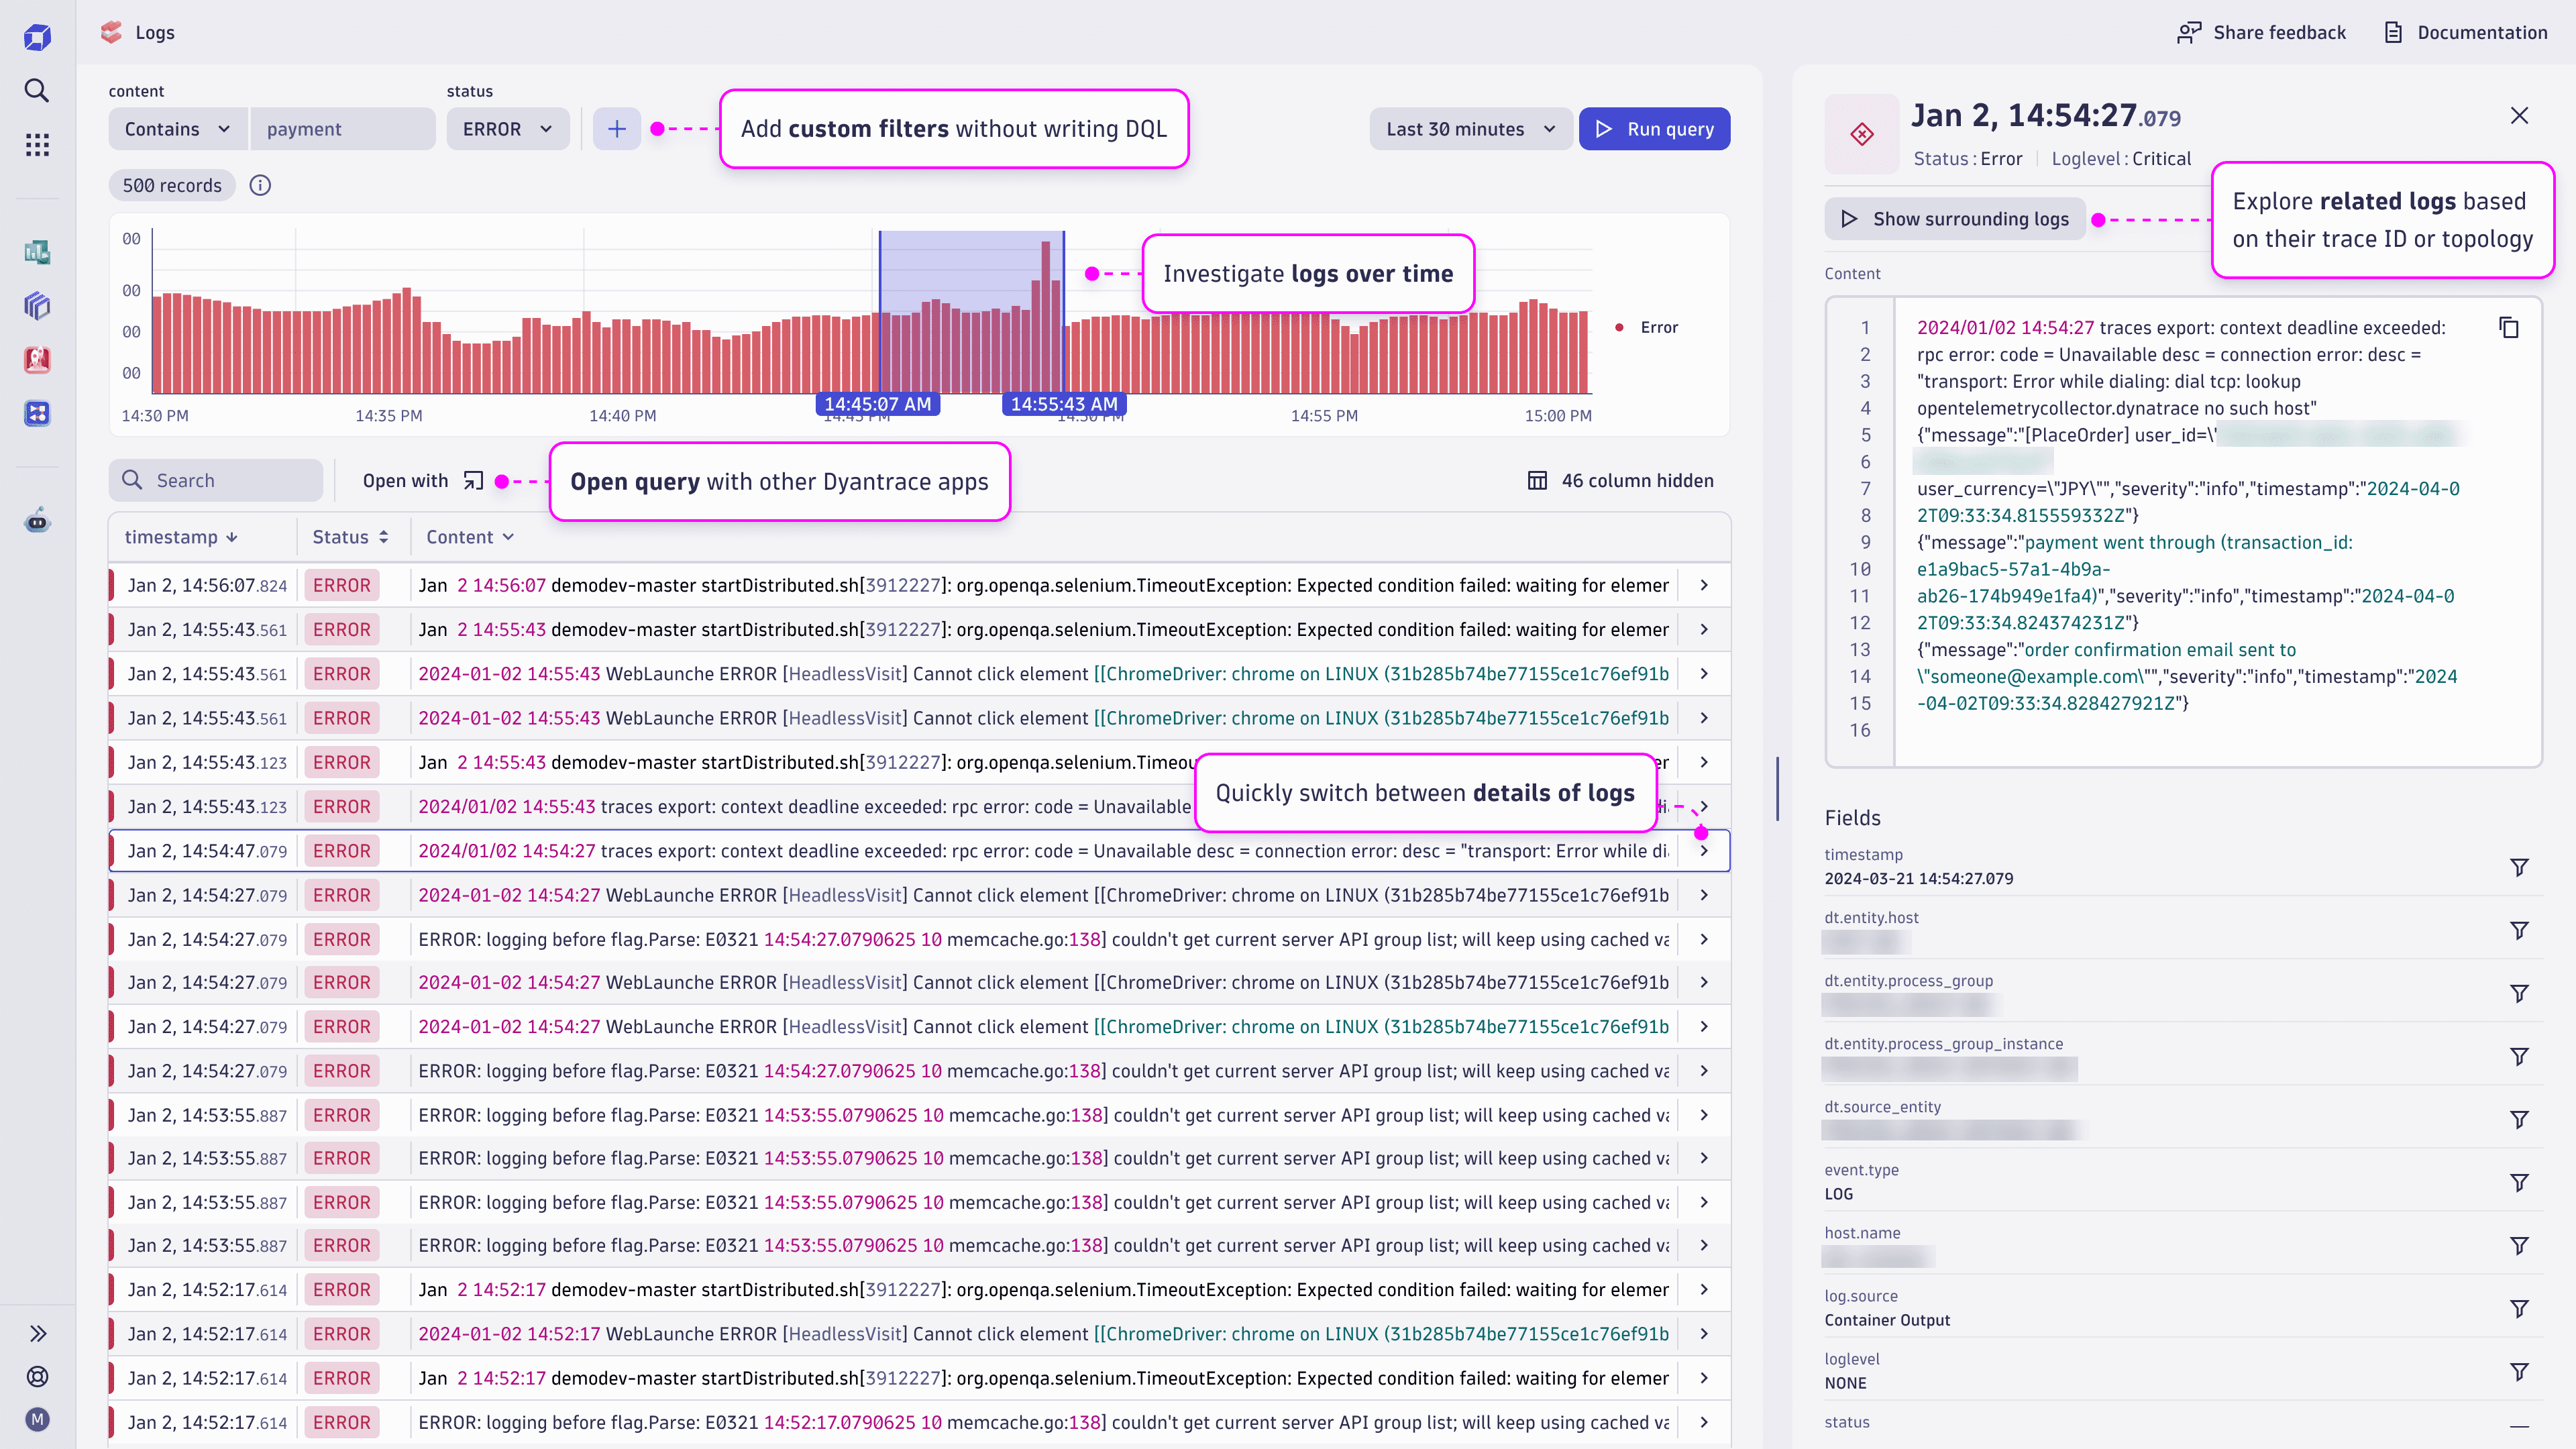
Logs App
The Logs app is your starting point to finding relevant log records without writing queries. Easily filter on your relevant data, carry out proactive investigations, discover root causes from surrounding logs, expand your analysis to other entities, and share your findings.

Use cases
- Find the logs you’re looking for. Easily filter your logs without writing DQL, and find the logs you need.
- Proactive investigation. Uncover problems and insights by investigating log distribution chart over time.
- Discover the root cause of issues from context. Investigate the surrounding logs of interest to understand the context and root cause of errors:
- Find the root cause & check if a log is only a symptom of issues
- Based on traces: show transaction details in a distributed environment
- Based on source: analyze select record in the context of a single component
- Expand your analysis. Quickly navigate between log details and related hosts, Kubernetes clusters, traces, or other entities. This helps you understand the impact of a single record in the context of related metrics and traces
- Share your findings. Continue your journey with logs in Notebooks, Dashboards, Security Investigator, or automate with Workflows.
Querying and filtering
Build your query by clicking the plus button at the top of the page to add attributes. For status and loglevel you can pick an option in the list of presets (see here how log severity is transformed). For other filters, add a comparison operator (equals, contains, not contains, does not equal, starts with, ends with) and a desired value.
For example, if you want to query log records from syslog with all statuses, then select all options for status, add a log.source attribute, pick the contains operator, and insert the syslog value.
Use the date picker to apply the correct timeframe for your query.
In addition to query attributes, you can use two commands:
sort. Usesortto pick a field (column) based on which you can sort the results in ascending or descending order.limit. By default, your query is limited to 1000 records at most. Use thelimitcommand to reduce the result set to optimize query performance and consumption.
Select Run query to execute the query.
Search among returned results
After your query has returned records in the result table, you can search for keywords in this data. Use the Search in results field to filter the table to your keyword. This filtering won't execute a new query, but will only show the already returned and loaded results in your browser.
Log distribution chart
Use the log distribution chart to spot trends in your logging. The chart displays how your queried data has been distributed over the last 30 minutes based on the status. The log distribution chart is redrawn every time you make a new query without impacting your original query or consuming the query license.
You can choose a specific area in the chart for closer inspection. Note how your query timeframe changes based on the area you chose. Use buttons or keyboard shortcuts to investigate the chart.
Surrounding logs
See the surrounding logs for every log record to better understand the context for the data. First, find a relevant log line in the result table and open its details, then select Show surrounding logs. The surrounding logs are shown for the context provided by the log record:
- If
trace_idparameter is present, you will see other records with the same trace ID. - Otherwise you can see surrounding logs for the same topology entity, e.g host.
Expand your analysis
Continue your analysis of logs discovered in the Logs app in other Dynatrace applications. Select Open with to continue analysis in, for example:
- Dashboards, to incorporate logs based on your query on a dashboard.
- Notebooks, and create data-rich reports with log data.
- Security Investigator, to include queried logs into a security case investigation.
- Workflows, to use logs in automations.
Frequently asked questions
Select Edit DQL query from the menu, besides the Run query button.
Querying logs works based on the same licensing as other Log Management and Analytics features, where you only consume the license for queried log volume in bytes.
Note that generating the log distribution chart or searching among the previously returned results does not consume the license.
The license is consumed only when you click the Run query button or when you use Surrounding logs.
The users must have access to the Dynatrace Platform and logs stored in Grail (see the built-in access policies for log data). The application replaces the Logs and Events screen, so users who accessed logs previously can use the Logs app.