Treat diagnostic messages
Captured distributed traces are the main source of data for Dynatrace Davis® causal AI. Because Davis relies on high data quality and fidelity, certain standards must be met to analyze the collected data; all services, methods, timings, properties, and so on must be correctly captured and transmitted. If this doesn't happen, you'll be informed of the issue via a diagnostic message for the affected traces.
-
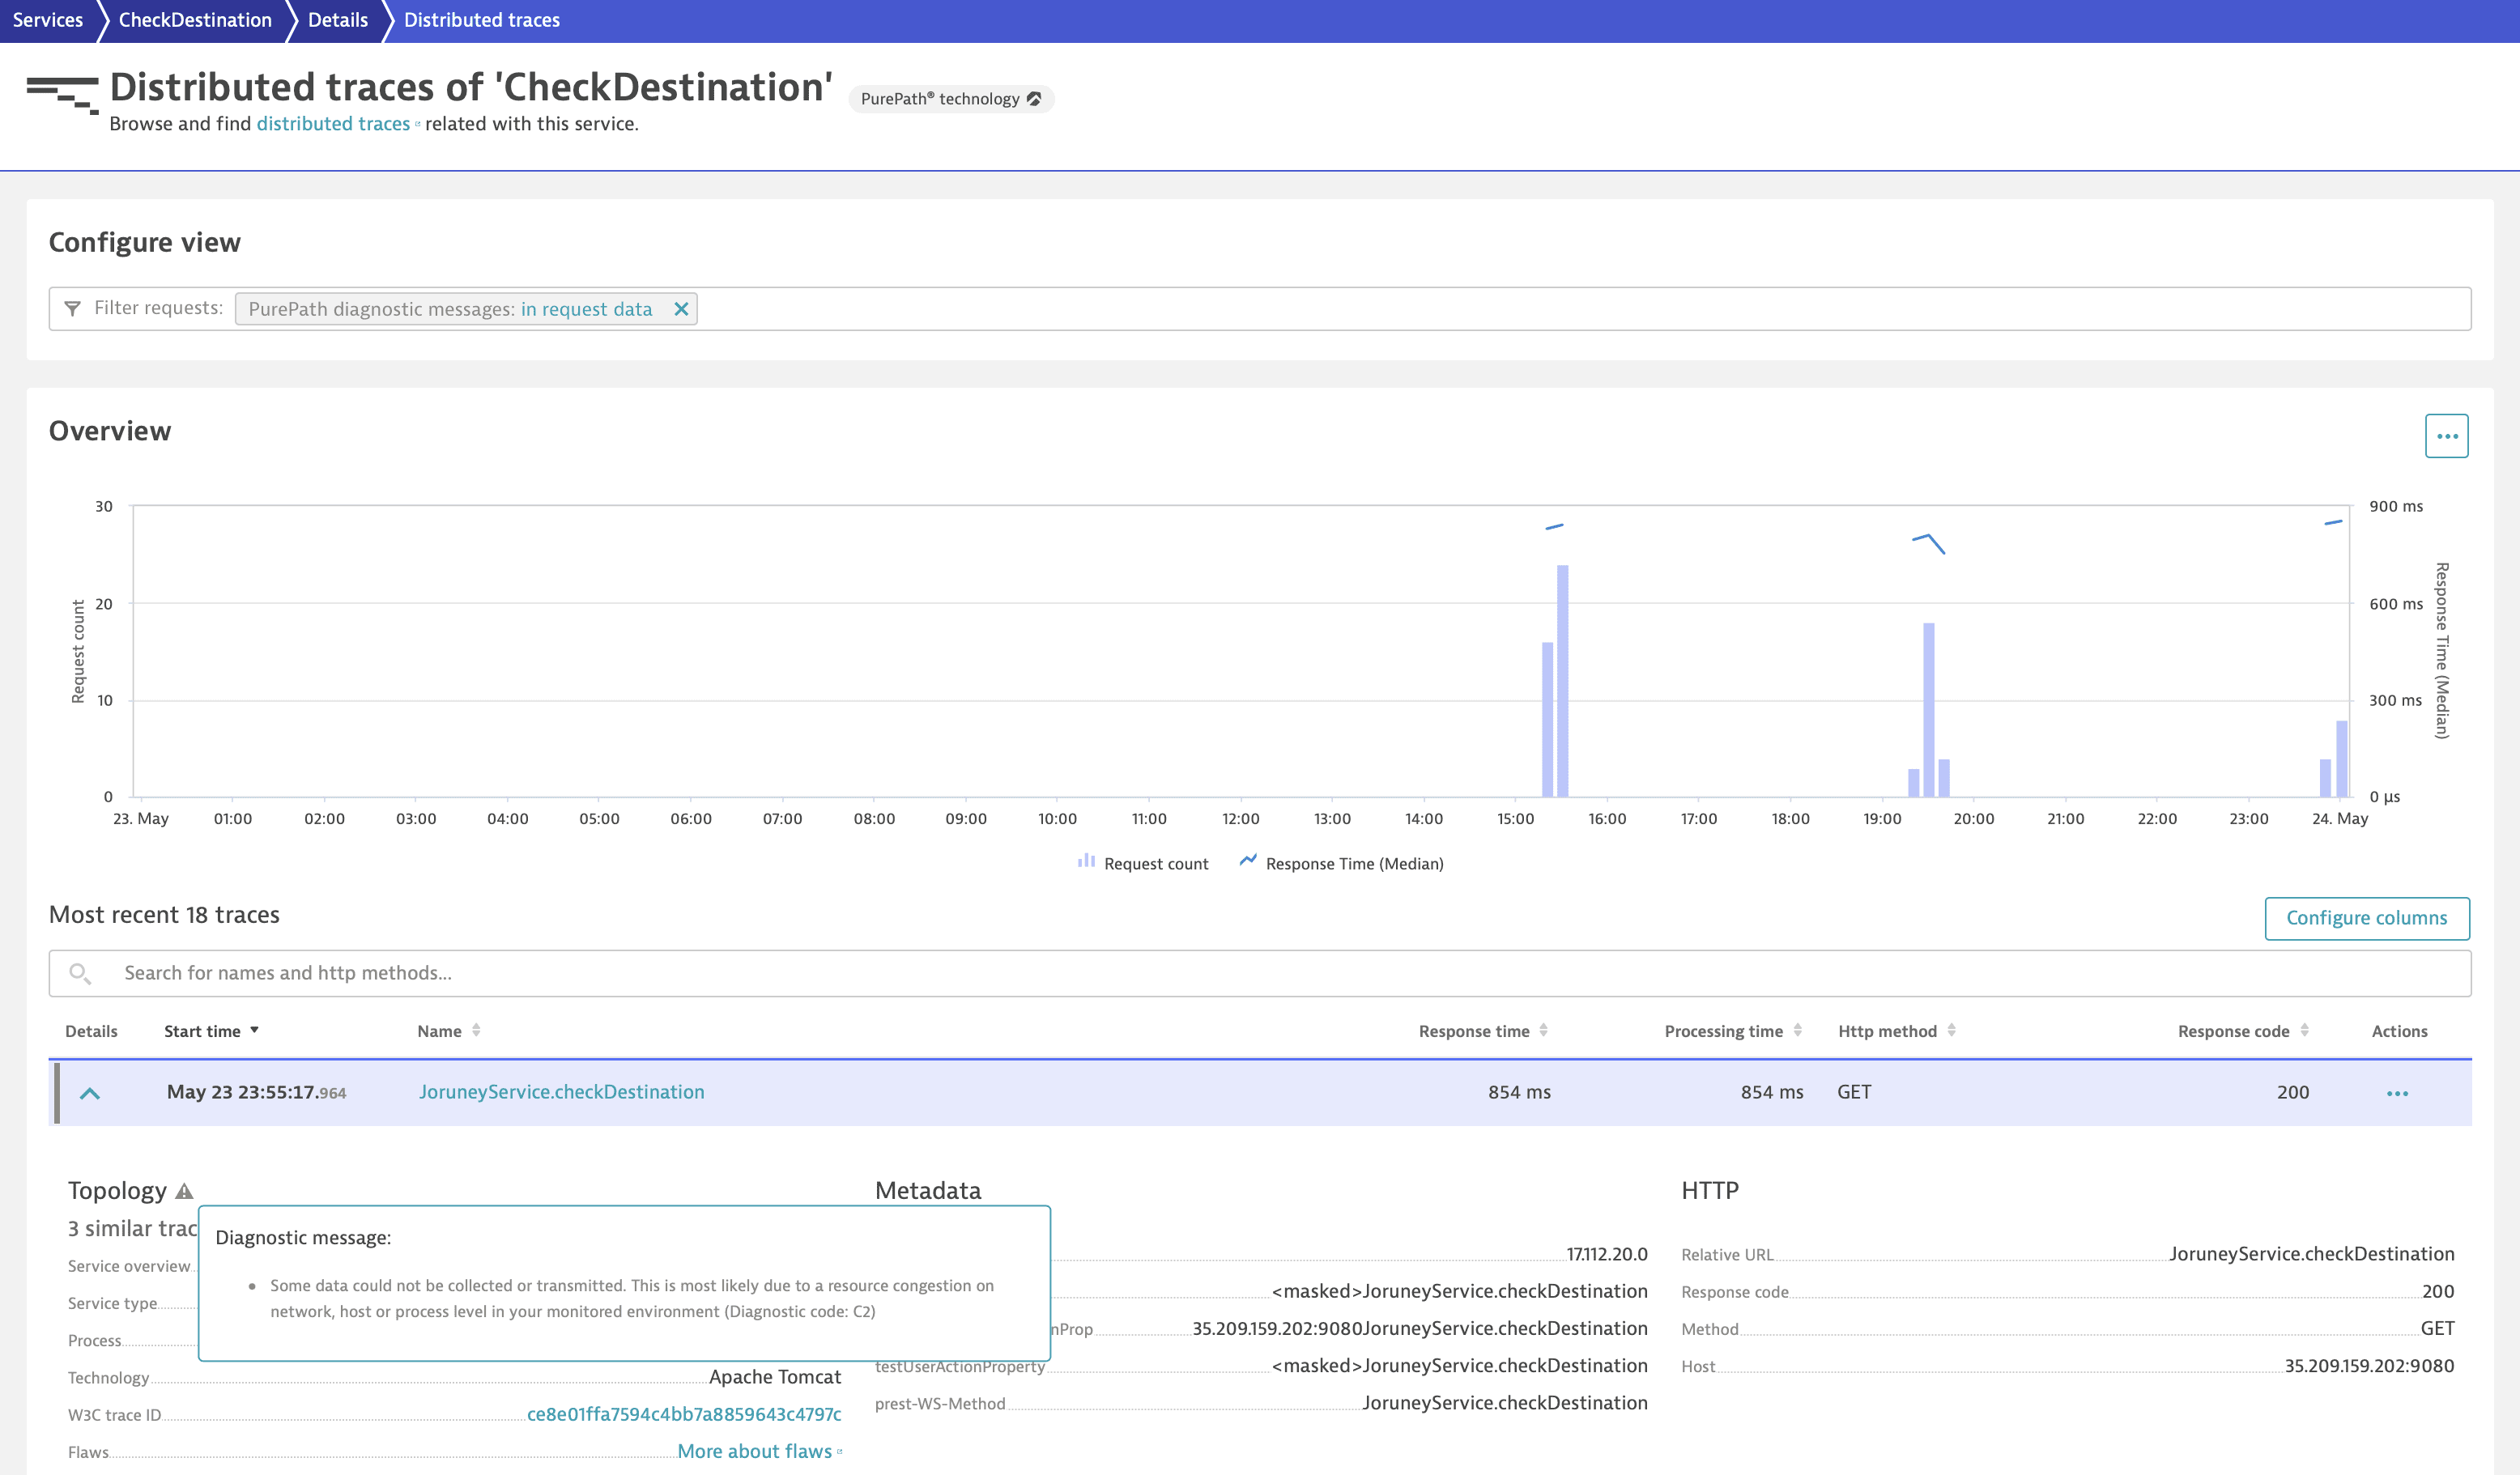
In case the correct service can be determined, distributed traces with diagnostic messages are listed on the service's Distributed traces page, along with all other distributed traces related to the service.
-
In case a related service can't be determined, for example, because of a missing service name or type, distributed traces are listed as Unexpected services in the list of services of the process for which distributed traces have been captured.
Unexpected services may be caused by network issues (data lost in transition) or by the abrupt termination of the process (restart or scaling).
Troubleshoot diagnostic messages
Via the content of diagnostic messages, you can understand the possible causes of missing capture or transmission of data and to what extent Davis® AI can rely on the collected data. Sometimes diagnostic messages are symptoms of a setup issue that requires investigation.
To maintain good data quality, we recommend that you
-
Use network error patterns to identify the source of a problem.
For example, if all requests of a specific service have network-related errors, the cause may be a short-living process that isn't sending data to Dynatrace.
-
Reduce the number of request attributes or change the definitions of custom services to reduce the number of requests.
Truncation of trace data
A trace can be truncated because data isn't fully acquired, correlated, or visualized. This typically occurs when limits established to protect your environment's resources are exceeded. When trace data is truncated, you get a specific diagnostic message.
If you've configured cross-environment tracing, data fetched from remote environments isn't truncated but aggregated.
While limits that protect your environment's resources can't usually be removed, you might influence truncation by intervening at the source of the problem. The following list includes some suggestions to help reduce the truncation of trace data.
-
Reduce the number of nodes sent per trace, for example, by modifying custom services and OneAgent features active in your environment.
OneAgent can send a limited number of nodes per trace. Once it runs into resource limitations, new nodes are no longer created. The trace is truncated at ingestion, and new incoming data isn't added to the trace. This can affect the correlation of entities and undermine your data quality.
-
Investigate traces running for extended lengths of time.
To protect your environment's resources, action is taken when traces run for extended lengths of time. For example, traces that are no longer active after running for 90 minutes are timed out, while traces for which the start time of the call is too far in the past are truncated. In both cases, new data isn't added to the trace. This can affect the correlation of entities and data quality.
-
Investigate traces with limited or excessive amounts of data.
- When trace data doesn't contain sufficient metadata on networks or not all nodes were received, correlating entities might be unsuccessful, leading to truncated traces.
- When a call has too many in-progress dependencies or the trace has too many nodes, such a trace is truncated. We recommend investigating the related service and, in case of custom services, getting in touch with a Dynatrace product expert via live chat within your environment.
-
Adapt the full-trace view to visualize the data you need.
The full-trace view in Dynatrace is typically large enough to display the most important information for the entire trace. However, formatting can be modified to help you visualize all the data you need.
Format element
Initial setup
Adaptation
Time range
For the current time range, select More (…) in the upper-right corner of the full-trace view and hover over Refine analysis.
To increase the time range, select Refine analysis.
Visible requests
In the Code level tab, you can see service calls up to 100,000 nodes.
To change this limit, contact a Dynatrace product expert via live chat within your Dynatrace environment.