Set up cross-environment tracing
In multiple environment scenarios, data pools are separated. If a request affects services that are monitored in different Dynatrace environments, its traces aren't automatically correlated.
To correlate and follow such traces, you can configure a connection between the Dynatrace environments and enable the response header and coordinated sampling switches. The service flow then represents the connection between the connected environments, distributed traces link to the connected remote environment, and you can access Davis® AI analysis capabilities.
-
Cross-environment tracing is limited to traces of requests that can transfer information about response headers and trace context from the receiving environment, such as HTTP or synchronous requests.
-
IBM z/OS (CICS, IMS, and Java) and AWS Lambda don't support cross-environment tracing.
Configuration
- Make sure that a direct network connection between the clusters can be established via HTTP/HTTPs.
The procedures that follow use the Dynatrace web UI. To carry out the equivalent tasks via API, see:
- Access tokens API—to create a token in the remote environment
- Remote environments API—to create a link to the remote environment from the local environment
 Create an access token
With this procedure, you get an access token from the remote environment that you need in the other steps.
To create an access token in the remote Dynatrace environment
- Sign in to the remote environment.
- This is the environment from which you pull data.
- If you can't sign in to the remote environment, someone with access to the remote environment can do this procedure for you.
- Go to Access Tokens.
- Select Generate new token.
- Enter a token name.
- Find and select the following scopes:
- Look up a single trace (
traces.lookup) - Fetch data from a remote environment (
RestRequestForwarding)
- Look up a single trace (
- Select Generate token.
This generates a token that gives your local environment permission to check the existence of a trace in a remote environment and to pull data from a remote environment. - Select Copy and then paste the token to a secure location.
It's a long string that you need to copy and paste back into Dynatrace later.
 Add the remote environment
To add the remote Dynatrace environment to the list of available remote environments
-
Sign in to your local Dynatrace environment.
-
Go to Settings.
-
Select Integration > Remote environments.
-
Select Connect environment.
-
Define the remote environment from which your local environment pulls data, and then select Save changes.
-
Name is the name under which the remote environment will be listed in your current Dynatrace environment. This is freeform text. It doesn't affect the remote environment.
-
Remote environment URI
-
For Dynatrace SaaS, it needs to be in the following format:
https://<ENVIRONMENTID>.live.dynatrace.com/Replace
<ENVIRONMENTID>with your actual environment ID. -
For Dynatrace Managed, any URI is allowed.
-
To connect a Dynatrace (SaaS deployment) environment to a Dynatrace Managed deployment via a URI that is outside the
dynatrace-managed.comdomain, contact a Dynatrace product expert via live chat within your Dynatrace environment.
-
-
Network scope
External: The remote environment is located in another network. Globally configured proxy settings are used if present. This is the default scope.Internal: The remote environment is located in the same network. Globally configured proxy settings are not used.Cluster: The remote environment is located in the same cluster. The request is made tolocalhost.
Dynatrace SaaS can only use the
Externalnetwork scope. -
Token is the token you generated in the previous procedure. It needs to include the Look up a single trace scope (
traces.lookup). -
Test connection checks the connection from your current environment to the remote environment.
Be sure to get a
connection successfully establishedmessage before continuing.
-
 Enable the features
Enable the following features in each environment of the group that you want to connect:
-
Coordinated sampling
You can increase the consistency of cross-environment tracing with coordinated sampling. When you enable the switch, sampling is coordinated across environments with the help of the W3C trace ID.
- Go to Settings > Preferences > OneAgent features.
- Set W3C trace context propagation according to your preferences.
You can send W3C trace context HTTP headers or gRPC headers. - Find and turn on Cross-environment tracing - Coordinated sampling.
-
Response headers
You can enable the identification and tracking of cross-environment calls, including the environment ID and the trace ID in HTTP response headers. If the calling environment receiving the response has the environment configured as a trusted remote environment, the call destination is linked.
- Go to Settings and select Preferences > OneAgent features.
- Find and turn on Cross-environment tracing - Environment and transaction IDs in HTTP response headers.
Now that you have connected your environments, you can analyze traces across cross-connected remote environments.
Troubleshooting
Analyze cross-connected remote environments
Once you configure a connection between environments, the following specific analysis options are available.
Service overview
Dynatrace detects requests to connected Dynatrace environments and uses the available information to create an associated Remote environment web service or web request service.
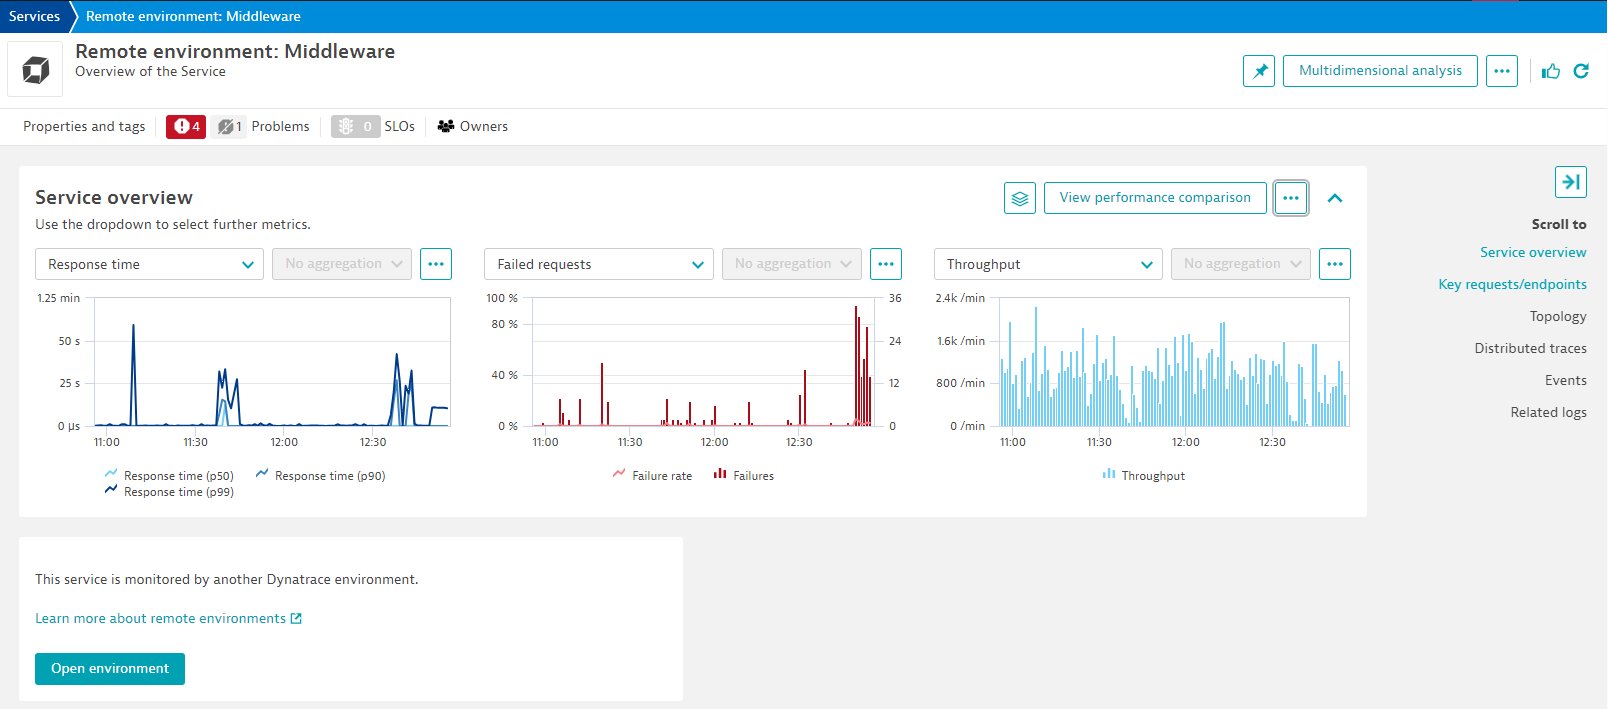
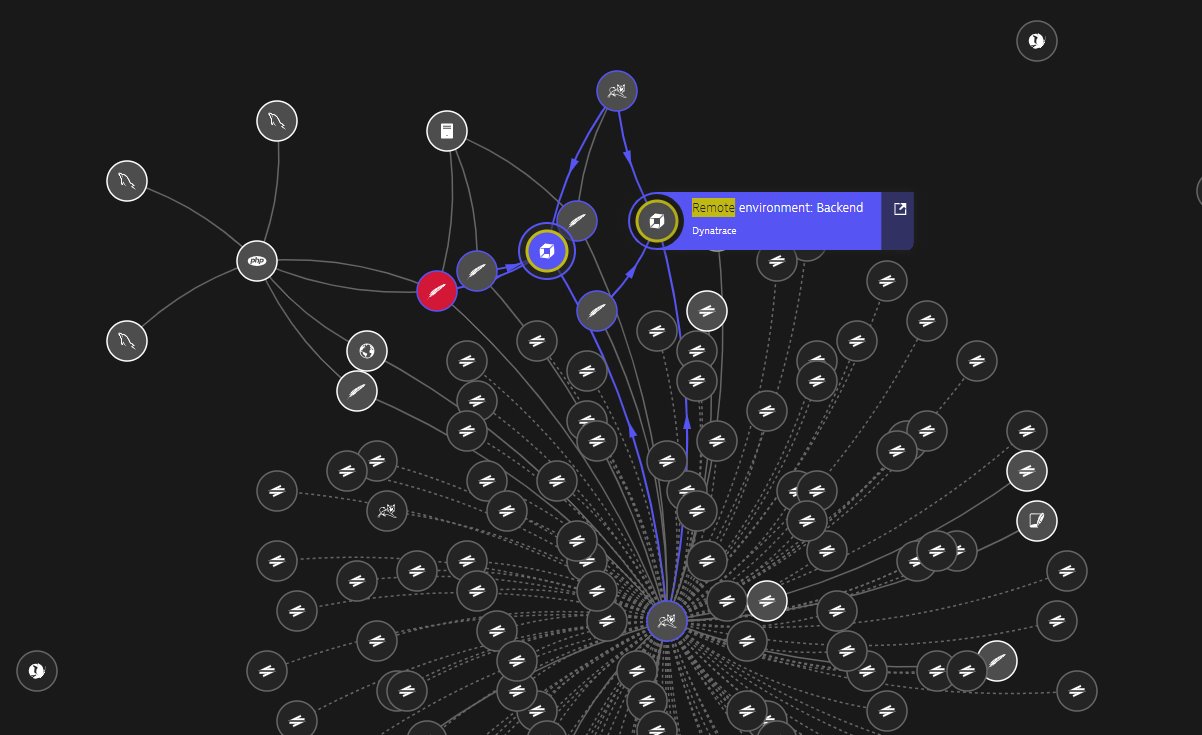
-
Outgoing calls to connected environments are represented in Smartscape and Service flow.
-
All the services monitored by the remote environment and contributing to the request are listed on the Remote environments page. To open it, select Open environment on a Remote environment service page.
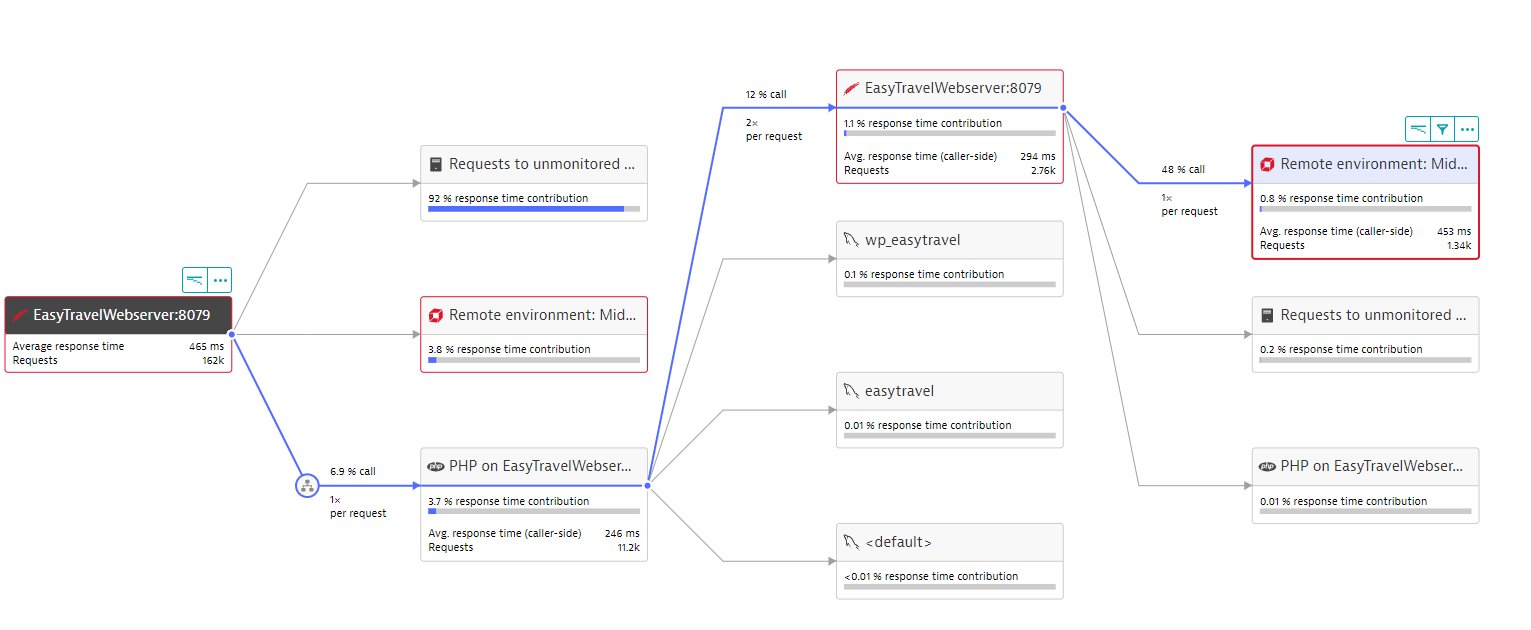
Service flow
Service flow recognizes remote environment calls. Because the requests are monitored by another Dynatrace environment, a specific drill-down option is available when you select the remote environment call. In the side pane, select Open environment to access the Remote environments page.
Distributed traces
-
When a request goes to a connected remote environment, Dynatrace displays the remote environment name in the call tree.
To follow the trace in the remote environment
- Select the remote environment request.
- In the Summary tab, select Open environment.
-
If the environments' connection is configured correctly, Dynatrace automatically displays the call Aggregated requests. It aggregates all the data of detected requests on each respective connected remote environment.
If you configured a connection to the remote environment but you can't see requests on it, you can trigger a manual search for the trace in configured environments. In the upper-right corner of the trace page, select Find in remote environments.
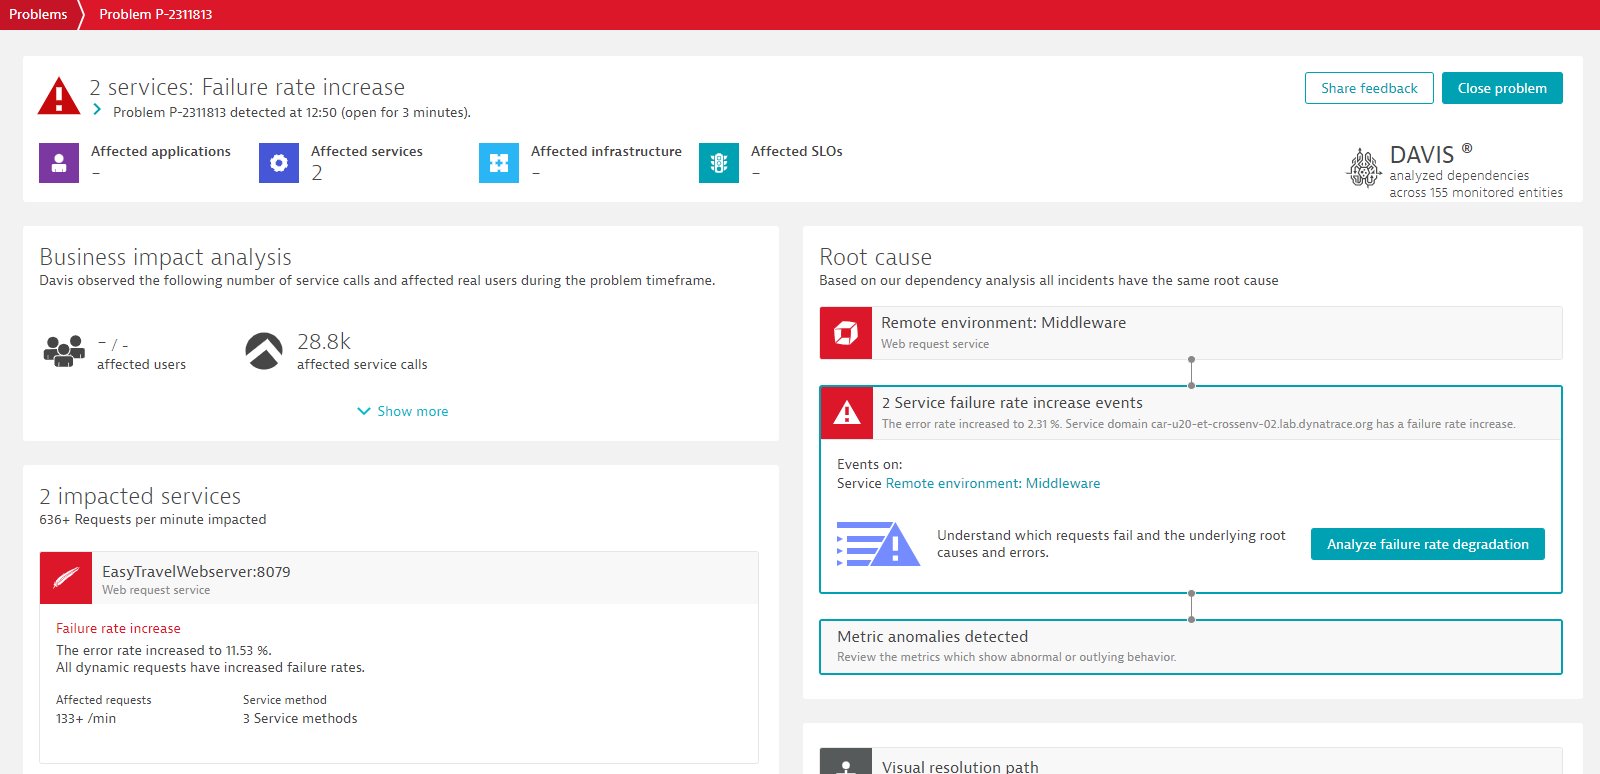
Davis AI
Once Dynatrace creates the remote environment service, problems and events are correlated to the affected remote environment service.
You can use Davis AI capabilities to understand which requests are failing and discover the root cause of problems in the remote environment.