Evaluate data freshness in Grail
In an ideal data ecosystem, all data is as current as possible. Observing the freshness of data helps to ensure that decisions are based on the most recent and relevant information.
In this example, we focus on a batch process that collects all events from an industrial plant and forwards those records in batches to Grail. The freshness of the incoming data depends on when those batches are pushed to Grail. To evaluate the freshness, each record comes with the record_ts field containing the timestamp of the original recording time. We're going to visualize it in Notebooks.
1. Visualize records with DQL
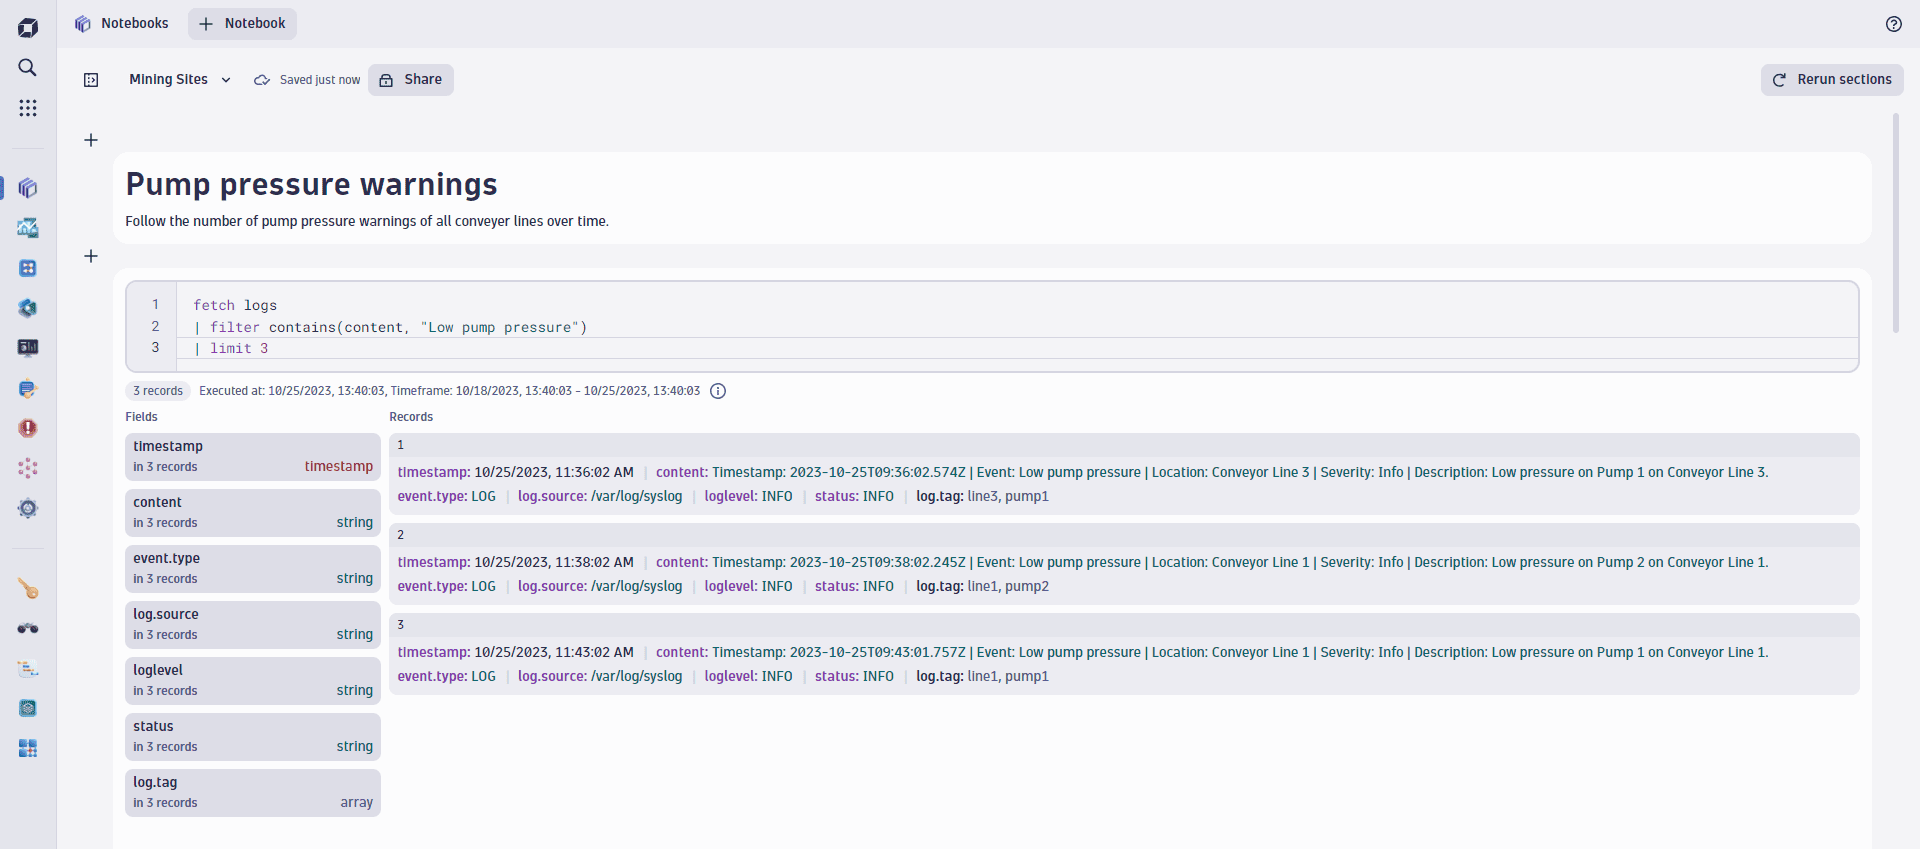
The following query fetches some logs streaming in from this industrial plant.
fetch logs| filter contains(content, "Low pump pressure")

2. Calculate data freshness
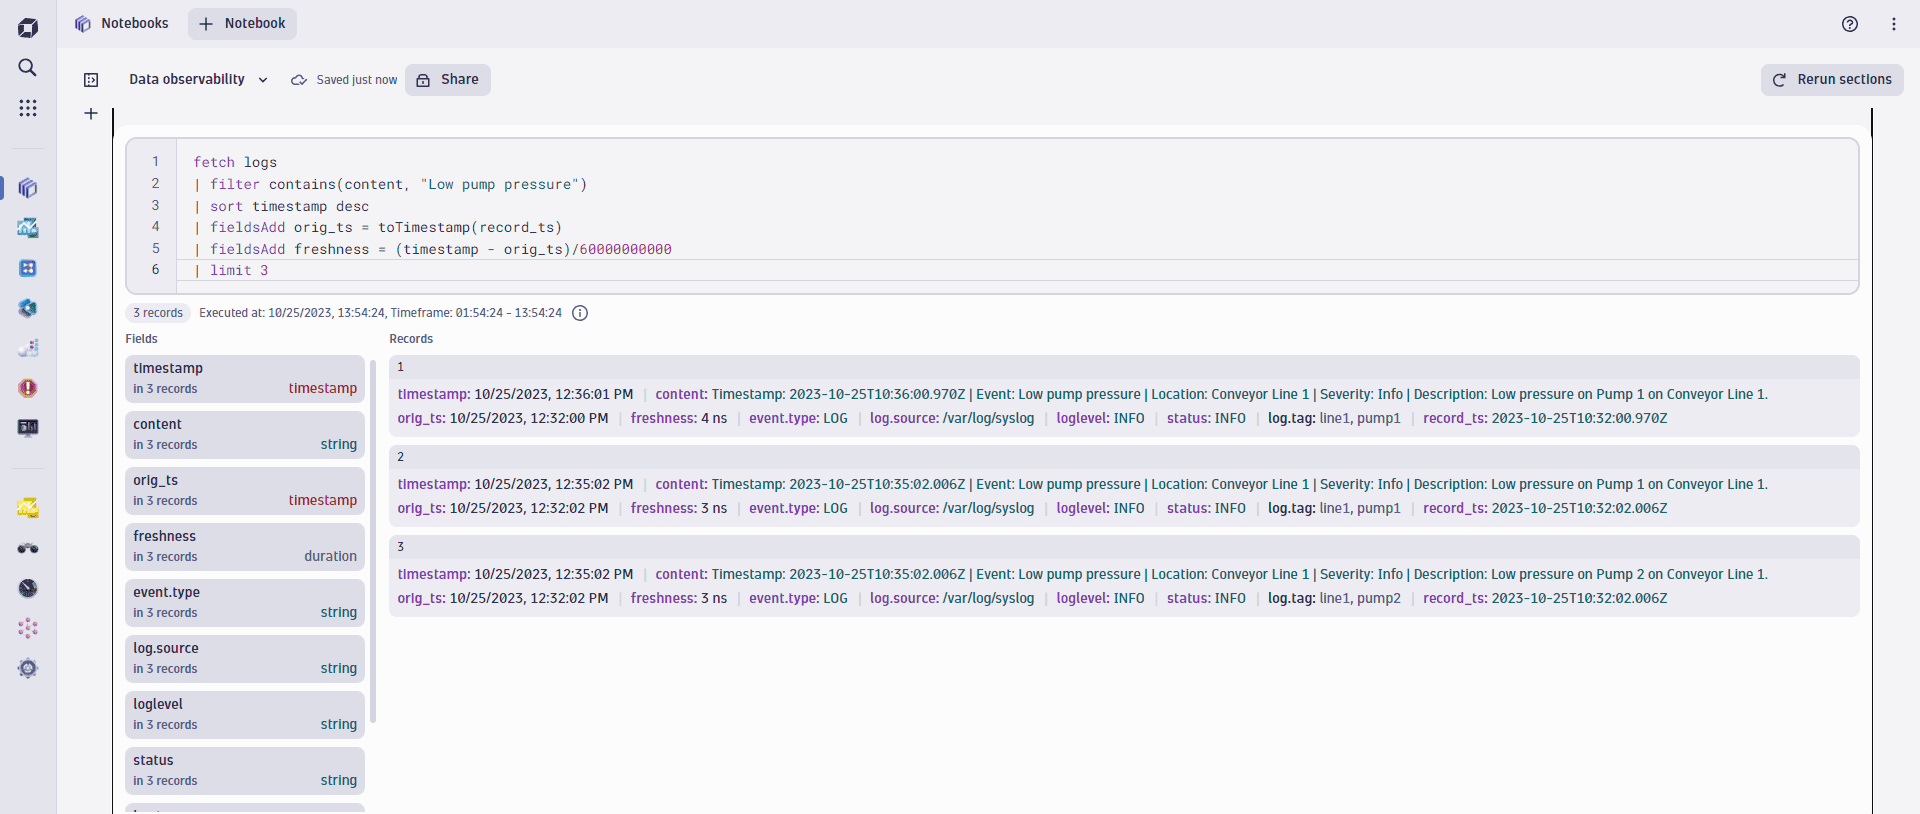
Now, let's visualize how fresh those data records are when they are stored in Grail. Conveniently, DQL enables us to convert the original timestamp into a date-time field and then calculate the delay between Grail record timestamp and the original timestamp. We store the calculation result in a new field freshness.
Here's the adapted query for that.
fetch logs| filter contains(content, "Low pump pressure")| sort timestamp desc| fieldsAdd orig_ts = toTimestamp(record_ts)| fieldsAdd freshness = (timestamp - orig_ts)/60000000000

3. Chart data freshness
By putting the freshness field on a chart, you can reveal the delay between the creation of a data record and its storage in Grail.
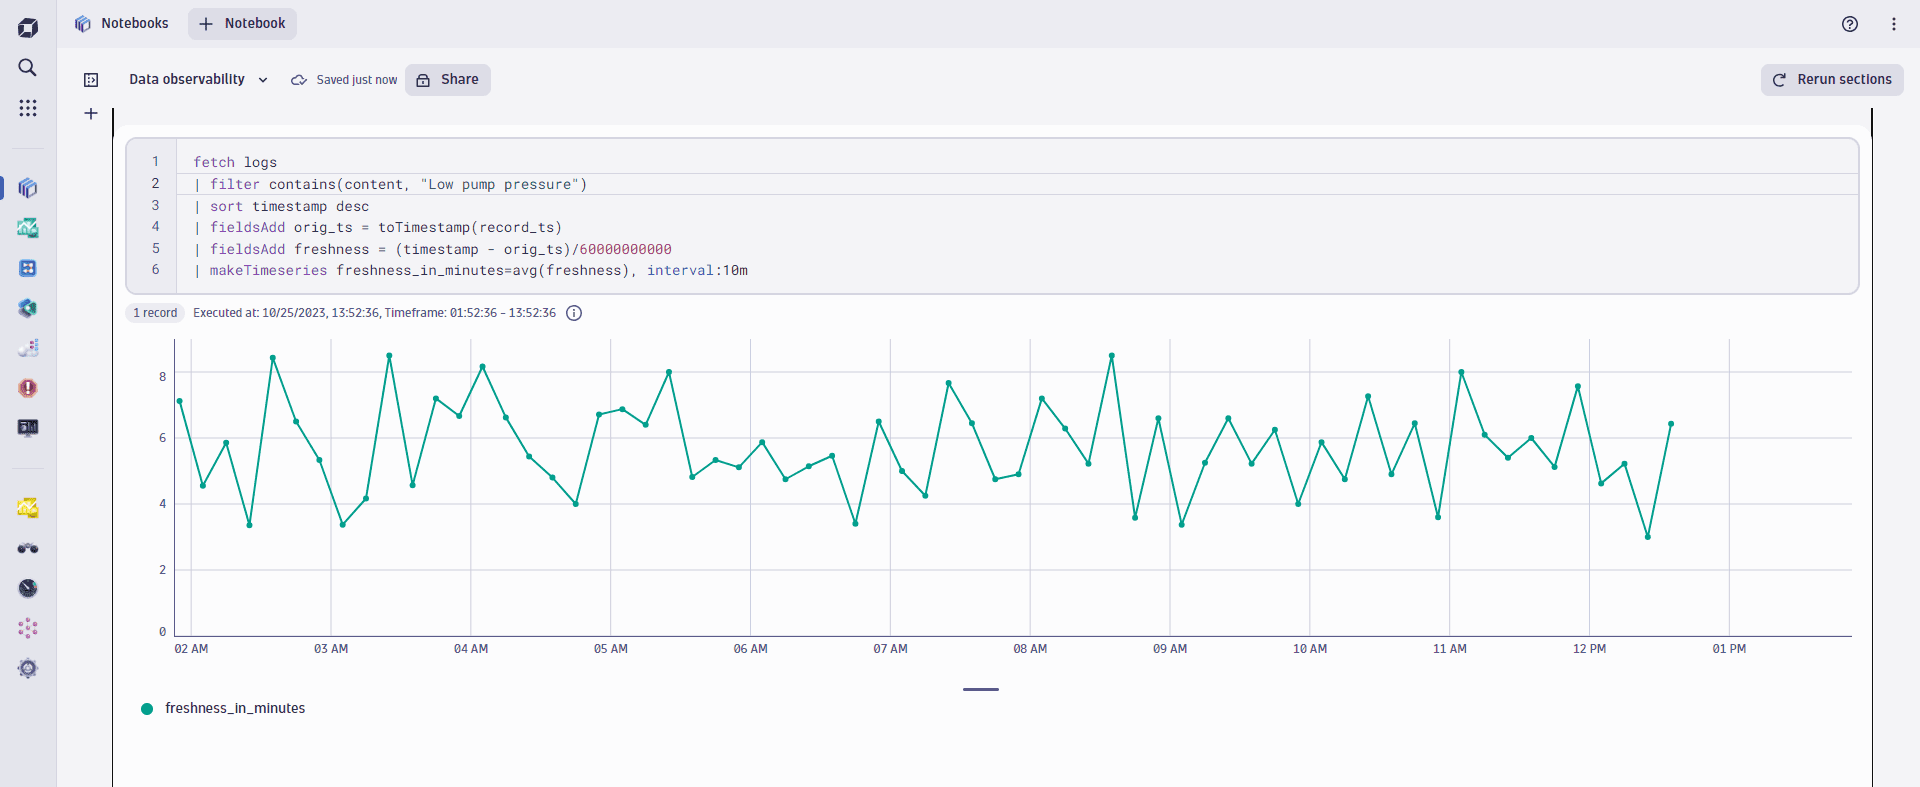
We can achieve this by further modifying the query. Now it calculates the difference between the original timestamp and the Grail record storage timestamp. It also summarizes all the records into a time series of a 10-minute resolution.
fetch logs| filter contains(content, "Low pump pressure")| sort timestamp desc| fieldsAdd orig_ts = toTimestamp(record_ts)| fieldsAdd freshness = (timestamp - orig_ts)/60000000000| makeTimeseries freshness_in_minutes=avg(freshness), interval:10m
Executing the DQL query above results in the data freshness chart below, which shows the average data freshness of all incoming data records measured in minutes:

This freshness measurement can then be used by out-of-the-box Dynatrace anomaly detection to actively alert on abnormal changes within the data ingest latency to ensure the expected freshness of all your data records.