Add Markdown to dashboard
- Latest Dynatrace
- How-to guide
- 10-min read
- Published Jul 08, 2022
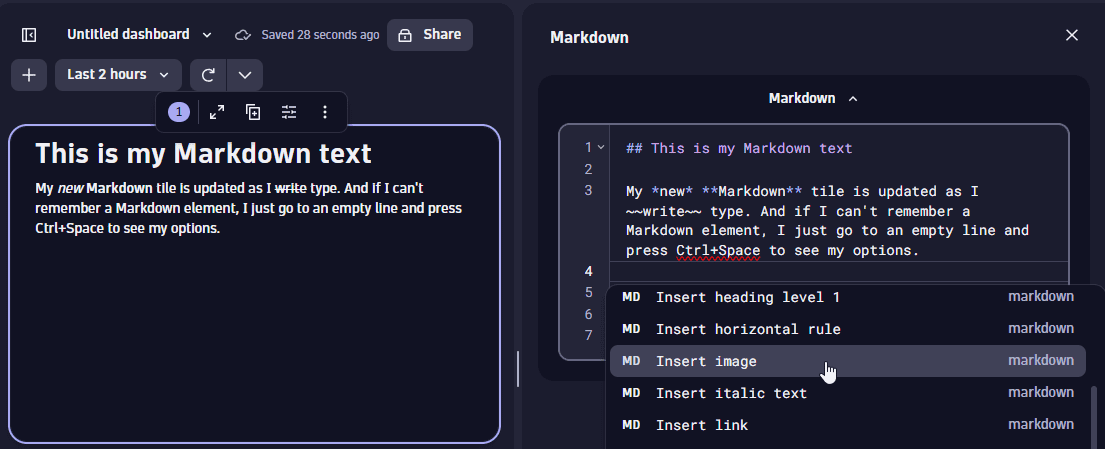
A Markdown tile can be anything from a minor note about something on the dashboard to a whole page of formatted information with links and pictures.
Add a Markdown tile
To add a markdown tile to a dashboard
-
In the upper-right of the dashboard, open the (Add) menu and select Add markdown.
Keyboard shortcut: Shift+M
An Options side panel opens on the right.
-
In the Options side panel, enter your text.
- Use Markdown to format your text and add links and images.
- The tile is updated as you edit.
- While you're editing text, press Ctrl+Space to see options.
-
Close the Options side panel when you're done.
Syntax
Use Markdown to format your annotations.
While you're typing in the edit box, your Markdown is rendered in the tile.
Press Ctrl+Space on an empty line to pop up a selectable list of available Markdown elements.
Italics
Wrap text in single asterisks (*like this*) to get italics like this.
Bold
Wrap text in double asterisks (**like this**) to get bold text like this.
Strikethrough
Wrap text in double tildes (~~like this~~) to get strikethrough (crossed out) text like this.
Blockquote
Start a line with > to get blockquotes, where everything before you press Enter is quoted.
Code
-
Wrap text in backticks (`like this`) to get bold text
like this. -
Wrap text in triple backticks (```like this```) to show a code block (multiple lines of
code text).
Headings
To add a heading, start the line with the # character like this: # This is your heading text.
Horizontal line
To visually separate sections of your annotation, add a horizontal line with three dashes (---):
Lists
Each line of an unordered (bulleted) list starts with an asterisk (*):
* Line 1* Line 2
Alternatively, you can use a dash (-):
- Line 1- Line 2
An ordered (numbered) list starts with a number and a period (1.) followed by a space and then your text:
1. The first line of my procedure.2. The second line of my procedure.3. The third line of my procedure.
If you use 1. for each line number, the lines are renumbered automatically when you display the dashboard.
Tables
To add a table, define the headers, the column formatting row, and then the rows of data you want to display
| Header 1 | Header2--- | ---content2 | content2
| Header 1 | Header2 |
|---|---|
content2 | content2 |
Special characters
You can use any printable characters, including emojis such as 😃 and 🌍 and ❤️.
Links
You can link to other places in your dashboard and elsewhere.
A link in Markdown is a label and link of the form [label](address), where:
- The
labelis freeform text to display on the link in your Markdown tile or section - The
addressspecifies what to open when someone selects the link, such as a website or a Dynatrace app
| Link to | Syntax and examples |
|---|---|
Website |
|
Notebooks app |
|
Specific notebook | Syntax:
Example:
To get the address
|
Specific notebook section | Syntax:
Example:
To get the address
|
Dashboards app |
|
Specific dashboard | Syntax:
Example:
To get the address
|
Specific dashboard tile | Syntax:
Example:
To include a specific tile ID in the link
|
Images
There are three ways to add an image to Markdown:
- Add the URL of an image
- Upload an image file to the library
- Select an image from the library
To add an image to your Markdown
-
Add or edit Markdown.
-
On the Markdown toolbar, select and choose the image source:
-
Insert from URL: to add a link to a picture using this format:
 -
Upload image: to upload your image file to the image library and add it to your Markdown. Use one of these methods:
- Select
 and browse for the image file you want to upload.
 - Drag an image file to the window.
From this point, you can also select Library to browse for an image from a library of previously uploaded images.
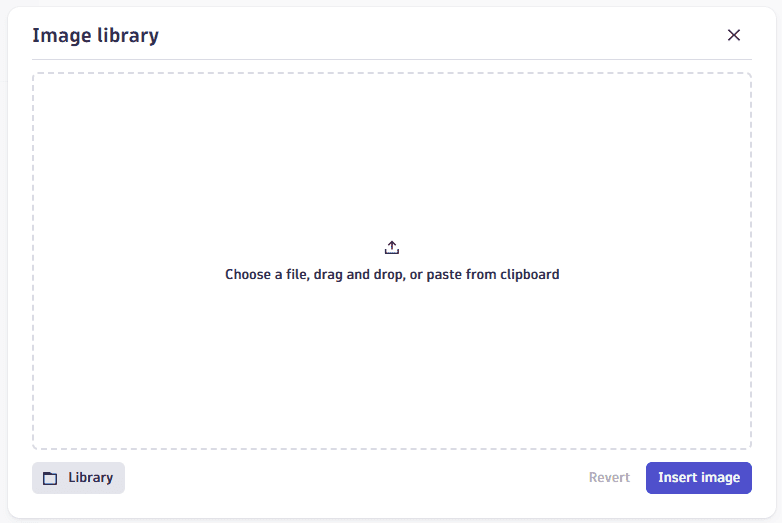 "Image library" window
 - Select
-
Media library: to select an image from a library of images you have already uploaded.
-
Variables
To reference a variable in an annotation, use the variable name prefixed by a $ character. For example:
The status is $Status.
If the dashboard has a variable named Status and the current value of Status is Good, the above example would appear in your tile as "The status is Good." and it would be updated when the value of Status changes.
For details on variables, see Add a variable to a dashboard.