Filter tiles
- How-to guide
- 2-min read
- Published Jul 19, 2017
The dashboards discussed here are classic dashboards created using the dashboarding functionality integrated with previous Dynatrace.
- For more about classic dashboards, see Dashboards Classic.
- For more about dashboards created with the Dashboards app in the latest Dynatrace, see Dashboards.
- To improve your dashboard experience, you can upgrade existing dashboards from Dashboards Classic to the Dashboards app in the latest Dynatrace.
Dynatrace provides powerful filtering options that enable you to set up dashboards in support of the unique monitoring needs of each of your organization's teams. This topic explains how to create a dashboard and add a filtered tile to it.
Create a dashboard
- Go to Dashboards (previous Dynatrace) or
 Dashboards Classic.
 - Select Create dashboard, enter a Dashboard name, and select Create.
This creates the dashboard and opens it in edit mode. - Select Done.
Now we have an empty dashboard to work with.
Create a filtered tile
-
Go to Hosts (previous Dynatrace) or
 Hosts Classic.
 -
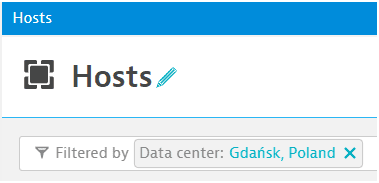
Set a filter on the table. In this example, we set
Data centertoGdańsk, Poland.There are two ways to set a filter:
-
For common filter filters, you can select an item in the Quick filters column. This is a subset of available filters.
-
On the Filtered by line, you can specify any available filter.
How to set a filter
Start typing to select a filter
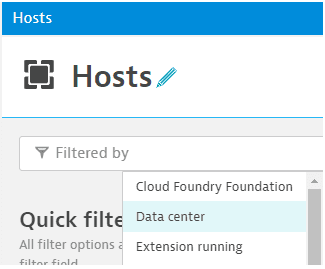
and then select or type a value
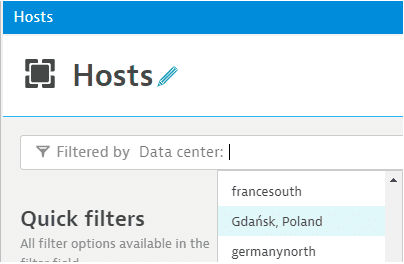
to add a filter to the filter line
-
-
Select Pin to dashboard, select a target dashboard, and select Pin to create the tile and pin it to the selected dashboard.
-
Select Open dashboard to open the dashboard in edit mode with the new tile selected for editing.
-
Optional Change tile settings as needed:
- Show or hide the tile chart
- Select a tile-specific timeframe
- Select a tile-specific management zone
- Select a tile-specific environment
-
Select Done.
Now we have a tile that's specific to the hosts in the Gdańsk, Poland, data center.
Each hexagon on the tile represents a host. A green hexagon is a healthy host; a red hexagon is a host with a problem.
- If hosts are added or removed from that data center, the tile updates automatically.
- If a host's health changes, so does the color of the hexagon representing that host.
- To see which host has the problem, hover over a red hexagon.
- To drill down to a red host's details, select the red hexagon and then select View host.
- To view the filtered Hosts page from which we created the tile, open the menu in the tile's upper-right corner and select View details.