Overview (Dynatrace Platform Subscription pre-2023)
- Latest Dynatrace
- Explanation
- 2-min read
- Published Nov 24, 2025
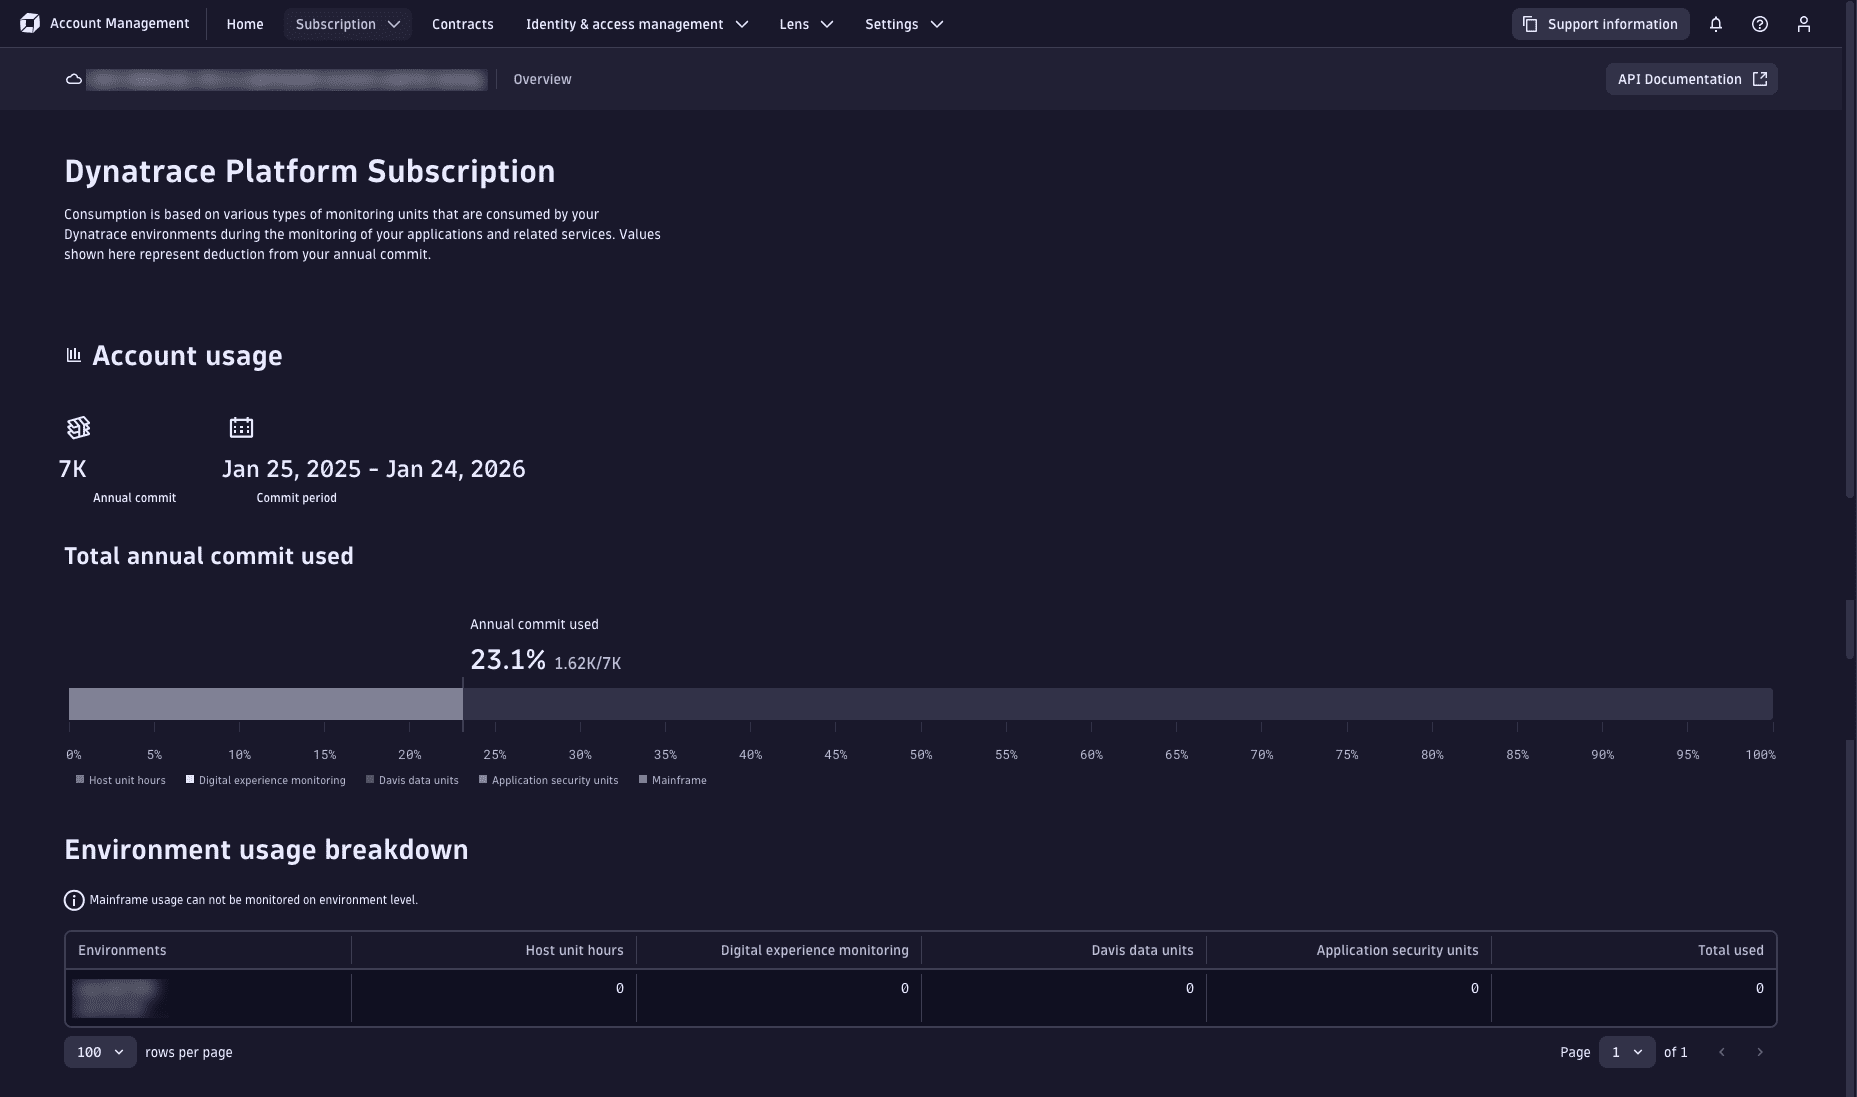
The Account Management Overview view provides three key analyses of your DPS subscription.
- Account usage: A summary of your usage, expressed as a proportion of your annual commit.
- Environment usage breakdown: A breakdown of your annual commit usage across your environments and capabilities.
- Usage details: Historical chart and tabular view of usage by environment and capability.
You can access this information at Account Management > Subscription > Overview.
All budget and cost information is also available via the Dynatrace Platform Subscription API.
This page is valid only for Dynatrace Platform Subscription licenses that were signed before April, 2023. For all other Dynatrace Platform Subscription licenses, please see Overview (Dynatrace Platform Subscription).
Account usage
Account usage provides a summary of how much of your annual commit has been used.
-
Annual commit: A textual summary of the current annual commit.
-
Commit period: The subscription duration.
A Dynatrace Platform Subscription can span multiple years, broken down into annual commit periods, with each period having an annual commit.
- Dates are based on UTC and run from
0:00on the start date shown to23:59:59on the end date indicated.
- Dates are based on UTC and run from
-
The license bar: Your actual total consumption, expressed as a proportion of your annual commit.
Hover over the license bar to get a breakdown of commit usage by capability.
Environment usage breakdown
The Environment usage breakdown table provides a snapshot of cumulative usage by environment and platform feature. The values represent totals for the current commit period, shown shown as a list of environments. You can view current usage by feature, and total DPS usage.
Environments are displayed using their friendly name (if set) and environment identifier.
You can use this information to quickly determine which environments are using up most of the DPS annual commit.
Usage details
Whereas the Account usage and Environment usage sections provide a summary of costs to date, Usage details allow you to analyze DPS usage with different views and filters.
Period
You may have a subscription that spans multiple annual periods. By default, Account Management displays usage for your current subscription period. To view usage for an earlier period, select a different Period.
Products
The table shows the cumulative usage for the feature selected in the Products list.
- If you select
All, the table reflects top-level feature usage, such as host unit hours and Davis data units. - If you select a specific product, such as
Davis data units, the table is updated to show the breakdown (metrics, logs, etc.) with the row total shown on the right. Selecting a time range also updates the table with cumulative usage for the user-defined period.
Select a Product to view subfeature usage. For example, select Davis data units to chart the usage of custom metrics, log analytics, serverless functions, events, and traces.
Resolution
- By default, the chart displays the
Forecastresolution. This sets the timeframe to the annual commit period, showing cumulative costs to date and projected costs through the end of the period. The forecast model is linear across all data points in the annual period. - To filter by product, environment, or timeframe, select either the
DailyorHourlyresolution.
Filter
Use the Filter setting above the chart to view consumption information for selected environments.
Legend
Each item in the chart legend is a toggle switch for that element: select it to hide or show the corresponding element on the chart. This can be useful, for example, if you want to hide the annual commit level when viewing usage in a low-usage environment.
Chart type
Use the chart buttons in the upper-right of the chart to switch chart types.
Timeframe
To change the timeframe of the chart:
- Expand the current timeframe setting.
- Specify a new range.
- Select Apply.