License overview (Dynatrace classic licensing)
- Latest Dynatrace
- Explanation
- 3-min read
- Published Nov 24, 2025
The Account Management License view provides a real-time view of your Dynatrace classic licensing product consumption. Dynatrace classic licensing covers usage of products such as host units, host unit hours, Digital Experience Monitoring, Davis data units (DDUs), and Application Security units (ASUs). Historical analysis is available at the daily or hourly level.
You can access this information at Account Management > License.
If you see Account Management > Subscription, please refer to our Dynatrace Platform Subscription documentation instead.
Total license usage
The Total license usage section displays real-time information about your licensing consumption.
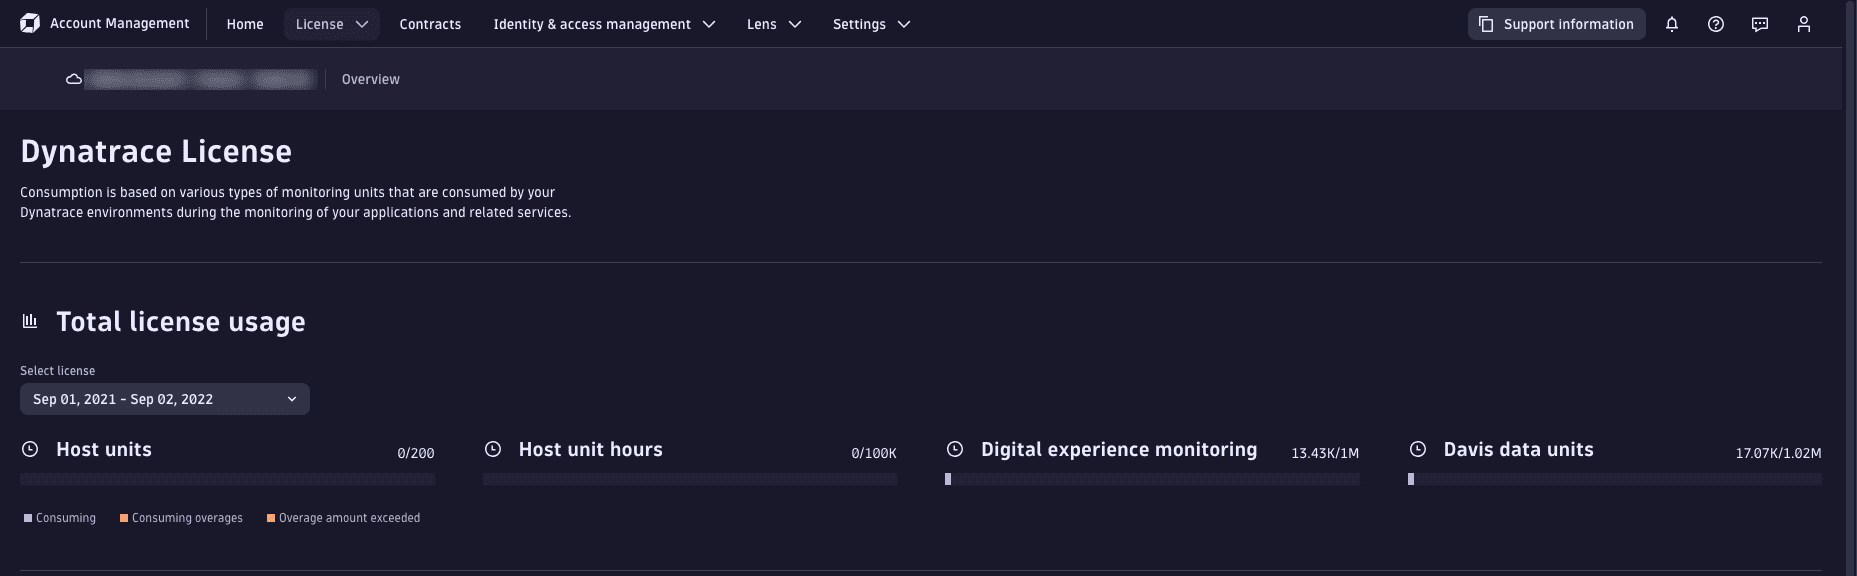
Each licensed product is displayed in a separate infographic that indicates how much of each product you have used. The colored bars indicate if you're under or over your quota:
- Blue: Your usage is below your quota.
- Brown: You have exceeded your quota, and your usage incurs overage charges (if this is allowed for your license).
- Red: Your maximum quota is reached, and monitoring is deactivated.
Hover over a product infographic to display a detailed breakdown of usage.
Usage details
The Usage details section displays historical license consumption.
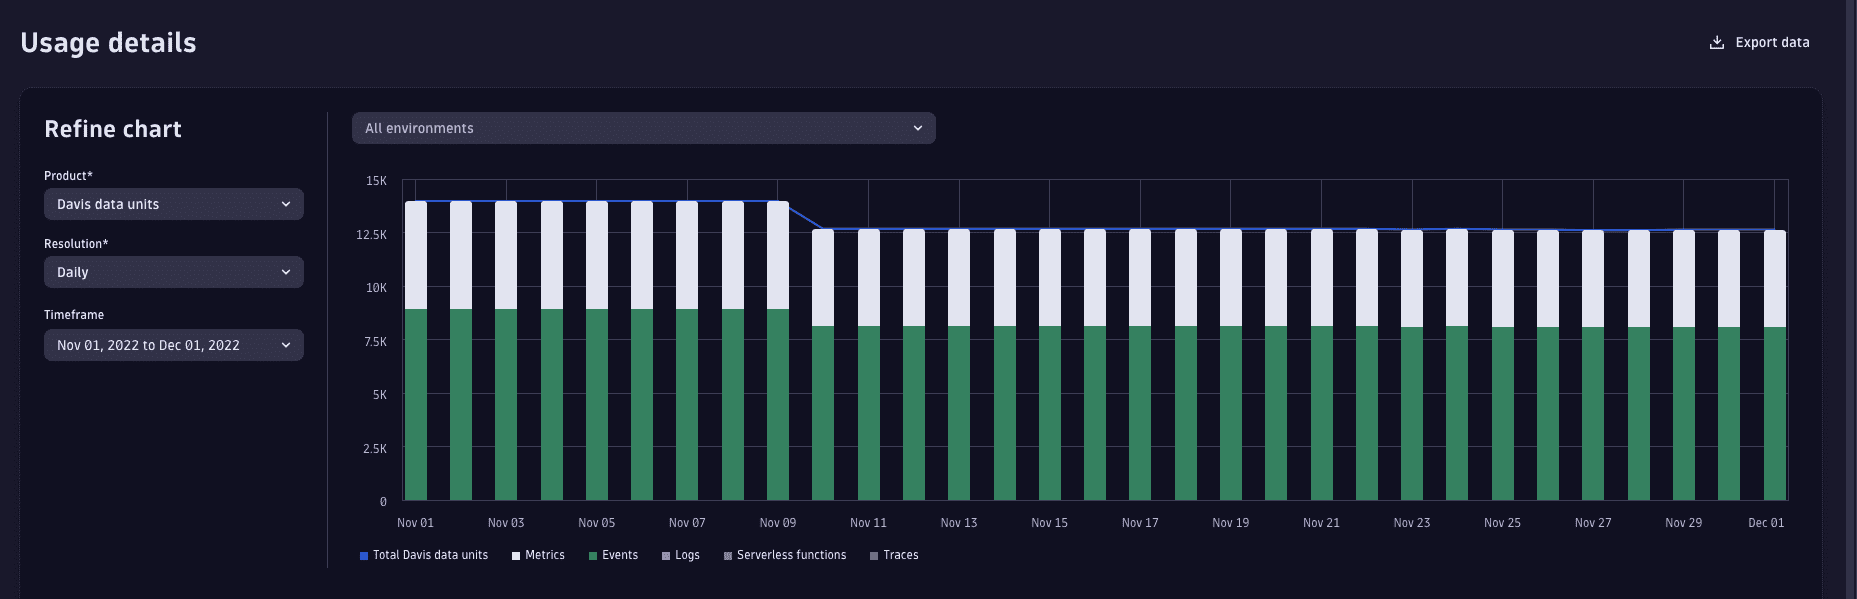
You can filter this information according to Environment, Product, Resolution, and Timeframe.
You can export this data in CSV format.
To do this, select  Export data.
Use Resolution to choose the granularity:
- Daily: Day-by-day total usage.
- Hourly: Hourly cumulative totals for a selected day.
- Total: Cumulative usage for consumption-based licenses (includes host unit hours, Digital Experience Monitoring, Davis data units, and Application Security units).
- Linear forecast: Forecast usage based on linear extrapolation from the last 30 days of usage data (limited to Digital Experience Monitoring and Davis data units only).
- Seasonal forecast: Forecast usage based on a seasonal forecast from the last 365 days of data (limited to Digital Experience Monitoring and Davis data units only).
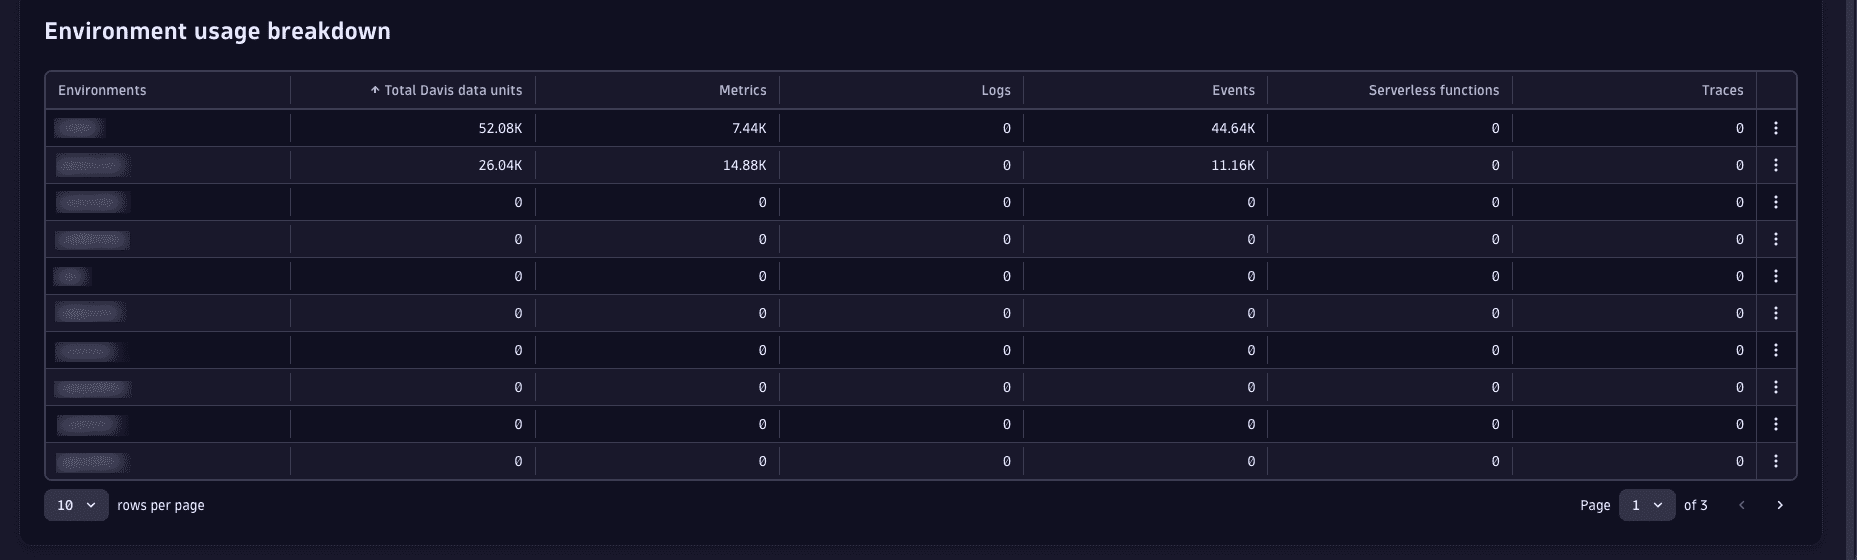
Environment usage breakdown
The Environment usage breakdown section shows how individual environments contribute to license consumption, including a breakdown of product consumption within each environment.
Quotas and overages
If your account settings allow you to split host unit quotas, you'll see the License > Quotas and overages page.
You need the View and manage account and billing information permission to view the Quotas and overages page.
You can use this page to
- View the available host units.
- View the host unit quota on a per-environment basis.
- Change the host unit quota for any environment.
- Configure overages (when your account is authorized to do so).
Configure overages
If you're authorized to configure overages, you’ll see a May consume host unit hours option box for each environment. Select this option to allow overages for mission-critical environments and production servers with high loads.
Note that when overages are allowed, the relevant environments incur additional host unit hour charges when usage exceeds the host unit quota.
Host unit limit exceeded
If your account is not authorized to configure overages, limits on concurrent host units are enforced. Once you reach your host unit quota, Dynatrace deactivates monitoring on certain OneAgents until you're under your concurrent host unit limit. The most recently started OneAgents are disabled first.
For example, assume you have a limit of six concurrent host units per environment. Your actual deployment has OneAgents as shown in the table below.
| Monitored host | OneAgent start date | OneAgent start time | Size (GB) | Host units per monitored host | Total concurrent host units |
|---|---|---|---|---|---|
| Host 1 | 2025-01-04 | 01:12 AM | 32 | 2 | 2 |
| Host 2 | 2025-01-04 | 02:43 AM | 48 | 3 | 5 |
| Host 3 | 2025-01-04 | 11:18 PM | 16 | 1 | 6 |
| Host 4 | 2022-01-05 | 10:12 AM | 32 | 2 | 8 |
| Host 5 | 2025-01-05 | 10:13 AM | 16 | 1 | 9 |
Once Host 4 begins to report data, you'll have exceeded your limit of six concurrent host units. Therefore, at that point, Dynatrace deactivates monitoring on hosts 4 and 5.
When the OneAgents on Host 4 and Host 5 start reporting data, you'll exceed your configured limit of 6 concurrent host units. At that point, Dynatrace deactivates monitoring of these two hosts and continues to monitor Hosts 1–3.
Frequently asked questions (FAQs)
Why does the license consumption in Usage details not match the information in Total license usage?
- Total license usage provides an accurate and real-time measurement of your license consumption. These measurements differentiate between free, paid, and overage usage.
- Usage details provides a historic breakdown of total consumption. This breakdown includes all units, and does not differentiate between paid, free, and overage usage.
When should I use linear forecasts and seasonal forecasts?
-
Linear model:
- If you're a new customer, the linear model offers more accurate predictions during the first year of consumption.
- The linear model is also accurate if your consumption in the previous 30 days is indicative of your future usage.
-
Seasonal model: If your business is more seasonal (for example, retail usage spikes during holiday periods) and you have a year or more of consumption data, the seasonal model can provide a more accurate estimate of future usage.
What host unit quota limit does the usage details show?
The shown quota limit is the overall quota limit on the contract, including all your environments.
Why does the forecast show that I have consumed more DDUs than my current license is for?
Forecasts show the total consumption that has accrued from the first day your first Dynatrace license was active. Total consumption may include consumption from a license that has since expired.
Therefore, even if the forecast shows that you have consumed more DDUs than your current license, this does not automatically mean that you have already consumed the DDUs in your current license.