Custom Metrics Classic (DPS)
- 16-min read
- Published Aug 12, 2025
You can extend the value of Dynatrace by defining, enabling or ingesting custom metrics. Dynatrace enables you to integrate third-party data sources, ingest custom metrics via API, leverage extensions, cloud integrations, and more.
Here is a non-exhaustive list of custom metric types:
- Metrics ingested from Amazon CloudWatch, Azure Monitor, or Google Cloud Operations Cloud for Cloud services monitoring
- Metrics ingested from remote extensions for monitoring of databases, network devices, queues, and more
- All API-ingested metrics
- Calculated service metrics, custom DEM metrics, and log metrics
How consumption is calculated: metric data points
The unit of measure for calculating custom metrics is a metric data point. A metric data point is a single measurement of a custom metric. Every metric data point that belongs to a custom metric consumes an additional metric data point whenever the metric is calculated.
Calculate your consumption
- In Hub, find the cloud service or extension you want to use (for example, Amazon S3, Azure Storage Account, Oracle Database, and F5).
- Determine how many custom metrics Dynatrace ingests for the service or extension.
- Determine the number of metric data points per custom metric.
- Use the example below as a guide.
If you have a single custom metric that is written once per minute, annually you will consume 525.6 k metric data points:
1 metric data point × 60 min × 24 h × 365 days = 525.6k metric data points/year
Note that a single custom metric may have multiple dimensions. For example, if you have the same custom metric for 2 instances of your cloud service, you will consume 2 metric data points:
cloud.aws.dynamo.requests.latency, dt.entity.dynamo\_db\_table=DYNAMO\_DB\_TABLE-41043ED33F90F271 21.78cloud.aws.dynamo.requests.latency, dt.entity.dynamo\_db\_table=DYNAMO\_DB\_TABLE-707BF9DD5C975159 4.47
2 instances × 1 metric data point × 60 min × 24 h × 365 days = 1,051.2k metric data points/year
Metric data points are not billed based on the increase in dimensions, but rather by the increased number of metric data points. If dimensions are added, but the number of metric data points remains the same, then billable metric data points usage does not change:
cloud.aws.dynamo.requests.latency, dt.entity.dynamo\_db\_table=DYNAMO\_DB\_TABLE-41043ED33F90F271, Operation='DeleteItem' 21.78cloud.aws.dynamo.requests.latency, dt.entity.dynamo\_db\_table=DYNAMO\_DB\_TABLE- 707BF9DD5C975159, Operation='DeleteItem' 4.47
Therefore, in this case, the same number of metric data points is consumed as shown in the calculation above.
Track your consumption
This section describes the different Dynatrace tools that you can use to track consumption and costs.
Track your consumption with metrics
Dynatrace provides built-in usage metrics that help you understand and analyze your organization's consumption of Custom Metrics Classic. To use them in Data Explorer, enter DPS into the Search field. These metrics are also available via the Environment API and linked in Account Management (Usage summary > Custom Metrics Classic > Actions > View details). The table below shows the list of metrics you can use to monitor your organization's consumption of Custom Metrics Classic.
- (DPS) Recorded metric data points per metric key
Key:
builtin:billing.custom_metrics_classic.raw.usage_by_metric_keyDimension:
metric_key\[STRING]Resolution: 1 min
Description: Number of consumed metric data points split by metric key.
- (DPS) Total billable metric data points
Key:
builtin:billing.custom_metrics_classic.usageDimension: count
Resolution: 15 min
Description: Total number of metric data points after deducting the included metric data points.
- (DPS) Total billable metric data points by other entities
Key:
builtin:billing.custom_metrics_classic.usage.otherDimension: count
Resolution: 15 min
Description: Number of billable metric data points that are not included with host monitoring.
- (DPS) Billable metric data points reported and split by other entities
Key:
builtin:billing.custom_metrics_classic.usage.other_by_entityDimension:
dt.entity.monitored_entity\[ME:MONITORED_ENTITY]Resolution: 15 min
Description: Number of billable metric data points split by entities that cannot be assigned to a host.
- (DPS) Total metric data points billable for Full-Stack monitored hosts
Key:
builtin:billing.custom_metrics_classic.usage.fullstack_hostsDimension: count
Resolution: 15 min
Description: The number of billable metric data points for Full-Stack monitored hosts.
- (DPS) Total metric data points billable for Infrastructure hosts
Key:
builtin:billing.custom_metrics_classic.usage.infrastructure_hostsDimension: count
Resolution: 15 min
Description: Number of billable metric data points for Infrastructure monitored hosts.
You can monitor the total number of billable metric data points for different intervals (15 min, hour, day, or week) for any selected timeframe using the metric "(DPS) Total billed metric data points". The example below shows consumption aggregated in 1-hour intervals.
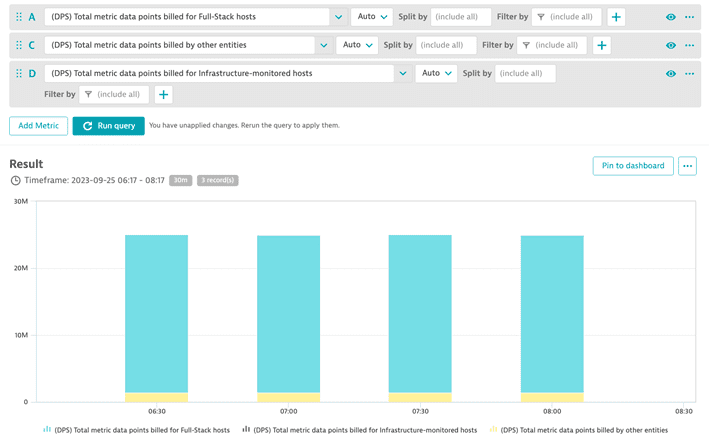
You can break down the total number of billable metric data points to monitor the number of metric data points consumed by Full-Stack monitored hosts, Infrastructure monitored hosts, and other entities. The following metrics can be used: "(DPS) Total metric data points billed for Full-Stack hosts, (DPS) Total metric data points billed for Infrastructure hosts," and "(DPS) Total metric data points billed by other entities."
The example below shows the number of billable metric data points consumed by all Full-Stack monitored hosts, Infrastructure monitored hosts, and other entities.
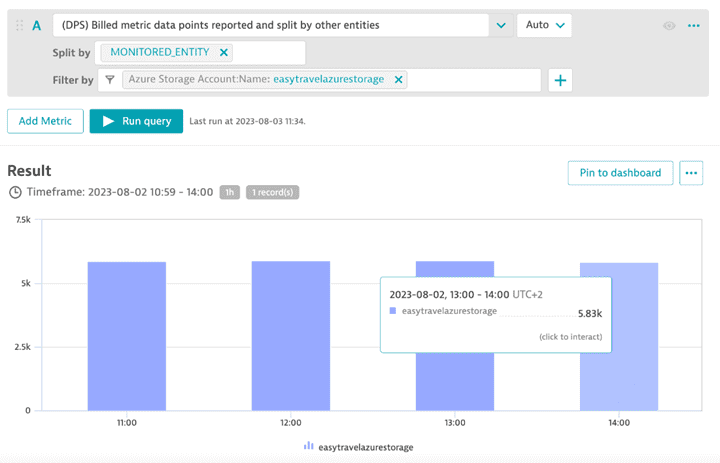
You can monitor the consumption of metric data points by any filtered entity using the metric "(DPS) Billed metric data points reported and split by other entities." The example below shows the number of billable metric data points that come from an Azure Storage Account.
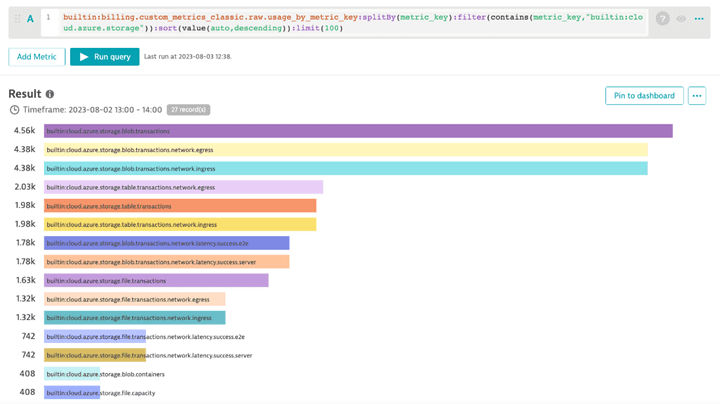
You can monitor metric data point consumption per metric keyusing the metric "(DPS) Recorded metric data points per metric key." The example below lists the top metric keys for an Azure Storage Account, in descending order of consumption.
You can easily control billable metric data points for cloud services. You can identify which metric data points are the most valuable and disable those that are less valuable. For example, learn how to do that for Azure Storage Account.
Track your consumption and costs in Account Management
You can also track your usage in Account Management. Go to Account Management > Subscription > Overview > Cost and usage details > Usage summary > Platform Extensions > Environment name > View Details.