Serverless Functions Classic (DPS)
- Latest Dynatrace
- Explanation
- 3-min read
As of January 12, 2026, Serverless Functions Classic will no longer be part of the rate card for any new DPS subscription signed on or after that date. Existing DPS customers will continue to have access to the SaaS platform extensions capabilities.
This page describes how the Serverless Functions Classic DPS capability is consumed and billed. For an overview of the capability, including its main features, see Serverless Functions Classic.
How consumption is calculated: invocations
Tracing of serverless functions, such as AWS Lambda, Azure Functions, and Google Functions operating on a consumption model, is based on the monitored function's total number of monitored invocations. The term "function invocations" is equivalent to "function requests" or "function executions."
Cloud functions monitored with metrics using cloud vendor integrations, such as Amazon CloudWatch, Azure Monitor, or Google Cloud Operations consume custom metrics within Dynatrace. For details, see custom metrics.
For AWS Lambda tracing integration, monitoring consumption is based on the monitored functions' total number of monitored invocations (for example, requests).
Assuming an average of 1,000 invocations per Lambda function per month, monitoring 100 Lambda functions would result in a total of 100,000 invocations per month. Each invocation results in the consumption of one invocation from your DPS budget as per your rate card.
Azure Functions provide many different hosting options with various tracing integration possibilities. Tracing Azure Functions on the App Service (dedicated) plan is equivalent to Full-Stack Monitoring and consumes GiB-hours (depending on the memory size and the duration the App Service is monitored).
For Tracing Azure Functions on Azure consumption plan, monitoring consumption is based on the monitored functions' total number of monitored invocations (for example, requests).
Assuming an average of 1,000 invocations per Azure function per month, monitoring 100 Azure functions would result in a total of 100,000 invocations per month. Each invocation is deducted from your available Dynatrace Platform Subscription budget as per your rate card.
Google Functions tracing
For Google Functions tracing integration, monitoring consumption is based on the monitored functions' total number of monitored invocations (for example, requests).
Assuming an average of 1,000 invocations per Google function per month, monitoring 100 Google functions would result in a total of 100,000 invocations per month. Each invocation is deducted from your available Dynatrace Platform Subscription budget as per your rate card.
When a Serverless Functions platform host is monitored with OneAgent (consuming GiB-hours), all monitored function invocations are part of the Full-Stack Monitoring package and therefore don't result in additional consumption.
Track your consumption
This section describes the different Dynatrace tools that you can use to track consumption and costs.
Track your consumption with metrics
Dynatrace provides built-in usage metrics that help you understand and analyze your organization's consumption of Serverless Functions Classic.
To use them in Data Explorer, enter DPS into the Search field. These metrics are also available via the Environment API and linked in Account Management (Usage summary > Serverless Functions Classic > Actions > View details). The table below shows the list of metrics you can use to monitor your organization's consumption of Serverless Functions Classic.
- (DPS) Total Serverless Functions Classic billing usage
Key:
builtin:billing.serverless_functions_classic.usageDimension: count
Resolution: 1 min
Description: Number of billable serverless function invocations aggregated over all monitored entities.
- (DPS) Serverless Functions Classic billing usage by function
Key:
builtin:billing.serverless_functions_classic.usage_by_functionDimension:
function\[STRING]Resolution: 1 min
Description: Number of billable serverless function invocations split by function.
- (DPS) Serverless Functions Classic billing usage by monitored entity
Key:
builtin:billing.serverless_functions_classic.usage_by_entityDimension:
dt.entity.monitored_entity\[ME:MONITORED_ENTITY]Resolution: 1 min
Description: Number of billable serverless function invocations split by monitored entity.
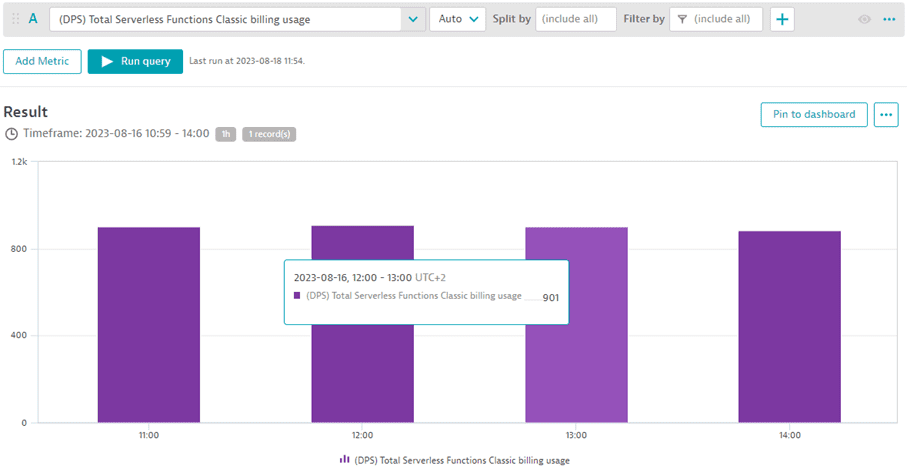
You can monitor the total number of billable serverless function invocations for various intervals for any selected timeframe using the metric "(DPS) Total Custom Traces Classic billing usage." The example below shows consumption aggregated in 1-hour intervals. Between 11:00 and 14:00, about 900 serverless function invocations were consumed each hour.
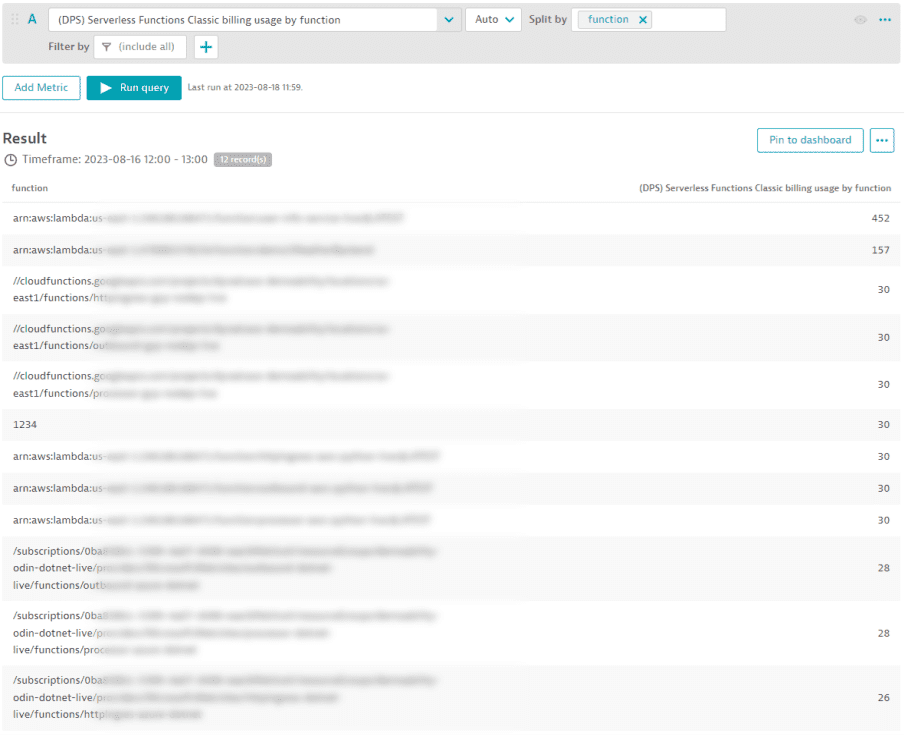
If you need to know the number of invocations split by serverless function, use the metric "(DPS) Serverless Functions Classic billing usage by function." The example below shows the list of serverless functions and the number of invocations between 12:00 and 13:00.
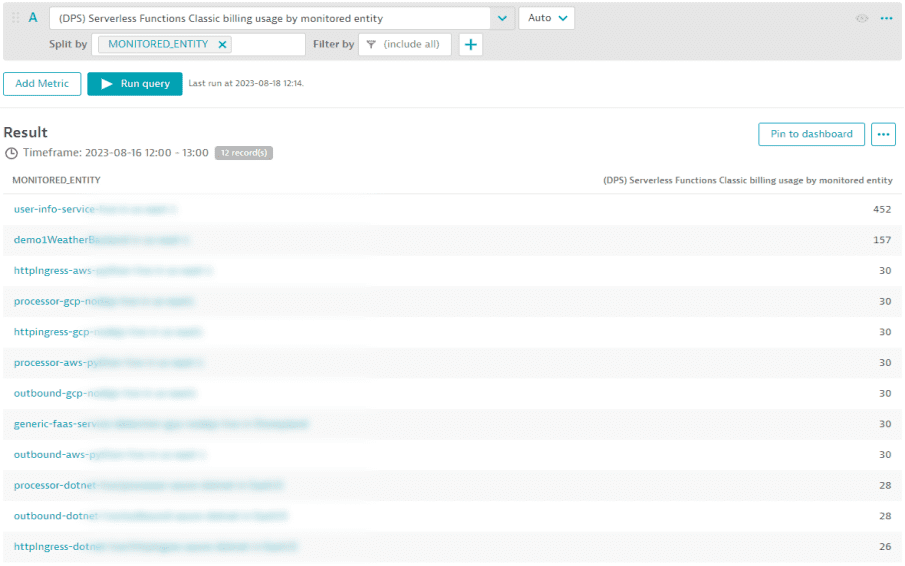
If you need to know the number of invocations split by monitored entity, use the metric "(DPS) Serverless Functions Classic billing usage by monitored entity." The example below shows the list of entities and the number of invocations triggered between 12:00 and 13:00.
Track your consumption and costs in Account Management
You can also track your usage in Account Management. Go to Account Management > Subscription > Overview > Cost and usage details > Usage summary > Platform Extensions > Environment name > View Details.