Custom Traces Classic (DPS)
- Latest Dynatrace
- 16-min read
As of January 12, 2026, Custom Traces Classic will no longer be part of the rate card for any new DPS subscription signed on or after that date. Existing DPS customers will continue to have access to the SaaS platform extensions capabilities.
This page describes how the Custom Traces Classic DPS capability is consumed and billed. For an overview of the capability, including its main features, see Custom Traces Classic.
How consumption is calculated: ingested spans
The unit of measure for Custom Traces Classic is in an ingested span. A span is a single operation within a distributed trace. To calculate the total consumption, multiply the number of ingested spans by the price per span.
Traces, including OpenTelemetry spans captured by OneAgent code modules or sent via the OneAgent local Trace API, are included with Full-Stack Monitoring, and therefore are not consumed as Custom Traces Classic.
Track your consumption
This section describes the different Dynatrace tools that you can use to track consumption and costs.
Track your consumption with metrics
Dynatrace provides built-in usage metrics that help you understand and analyze your organization's consumption of Custom Traces Classic. To use them in Data Explorer, enter DPS into the Search field. These metrics are also available via the Environment API and linked in Account Management (Usage summary > Custom Traces Classic > Actions > View details). The table below shows the list of metrics you can use to monitor your organization's consumption of Custom Traces Classic.
- (DPS) Total Custom Traces Classic billing usage
Key:
builtin:billing.custom_traces_classic.usageDimension: count
Resolution: 1 min
Description: The number of billable ingested spans aggregated over all monitored entities.
- (DPS) Custom Traces Classic billing usage by monitored entity
Key:
builtin:billing.custom_traces_classic.usage_by_entityDimension:
dt.entity.monitored_entity\[ME:MONITORED_ENTITY]Resolution: 1 min
Description: The number of billable ingested spans split by monitored entity.
- (DPS) Custom Traces Classic billing usage by span type
Key:
builtin:billing.custom_traces_classic.usage_by_span_typeDimension:
span_type\[STRING]Resolution: 1 min
Description: The number of billable ingested spans split by span type. |
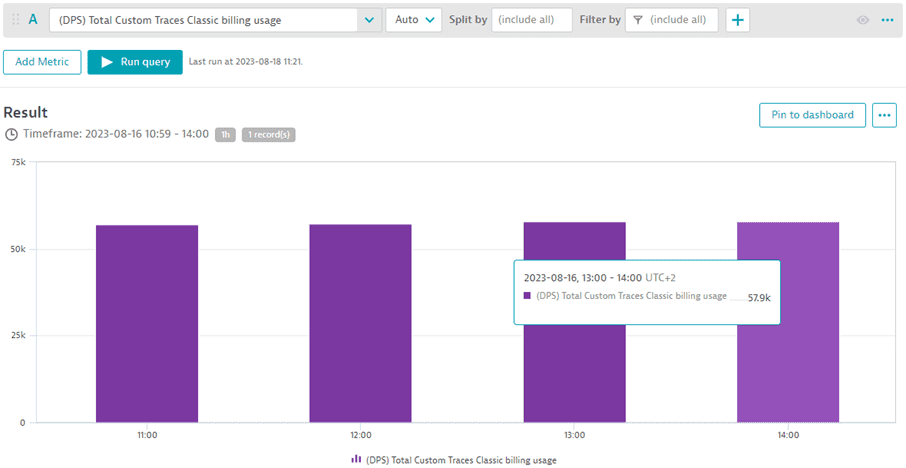
You can monitor the total number of billable custom traces for various intervals for any selected timeframe using the metric "(DPS) Total Custom Traces Classic billing usage." The example below shows consumption aggregated in 1-hour intervals. Between 11:00 and 14:00, around 58,000 custom traces were consumed each 1 hour.
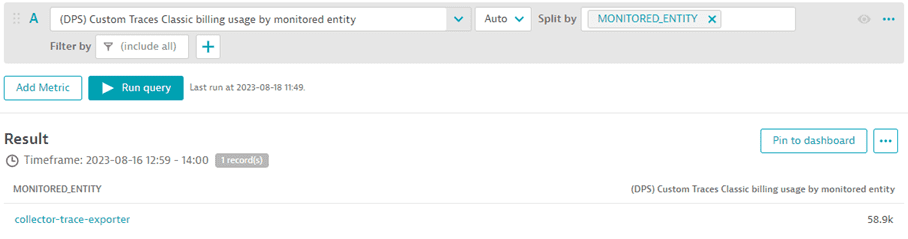
You can monitor the consumption of metric data points by any filtered entity using the metric "(DPS) Billed metric data points reported and split by other entities." The example below shows that all billable custom traces between 13:00 and 14:00 came from the entity collector-trace-exporter.
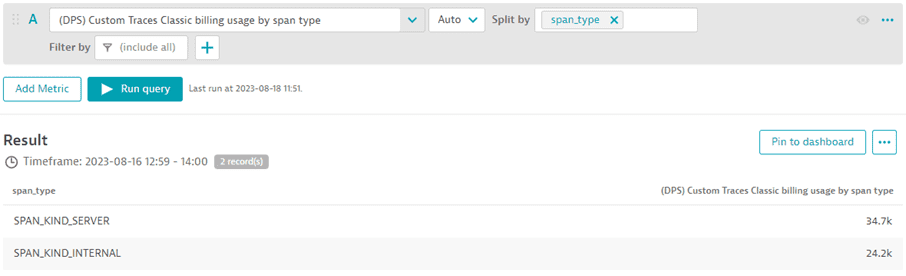
If you are interested in the split by span type, use the metric "(DPS) Custom Traces Classic billing usage by span type."
Track your consumption and costs in Account Management
You can also track your usage in Account Management. Go to Account Management > Subscription > Overview > Cost and usage details > Usage summary > Platform Extensions > Environment name > View Details.