PHP-FPM monitoring
- Latest Dynatrace
- 4-min read
Dynatrace PHP-FPM monitoring provides information about connections, slow requests, and processes. If PHP-FPM is underperforming or a problem occurs, Dynatrace lets you know immediately and shows you which hosts are affected.
Prerequisites
- Linux or Windows
- PHP version 7.1.0+
- The PHP-FPM status page needs to be enabled on all nodes that you want to monitor and the PHP-FPM status page needs to be enabled for access from
localhostover HTTP(S). For full instructions, please see the PHP documentation, but note that the default URL path is now/status(it is no longer/fpm-statusas shown in their example).
Enable PHP-FPM monitoring globally
With PHP-FPM monitoring enabled globally, Dynatrace automatically collects PHP-FPM metrics whenever a new host running PHP-FPM is detected in your environment.
- Go to Settings.
- Select Monitoring > Monitored technologies.
- On the Supported technologies tab, find and expand the PHP-FPM row.
- Enter a Status page URI.
To monitor more than one pool, type the URIs of the individual PHP-FPM status pages (separated by spaces) into the Status page URI field. All PHP-FPM instances must have a correct status page URI reference.
- Select Save.
- Turn on PHP-FPM.
Enable PHP-FPM monitoring on individual hosts
Dynatrace provides the option of enabling PHP-FPM monitoring for specific hosts rather than globally.
- If global PHP-FPM monitoring is currently turned on, turn it off: Go to Settings > Monitoring > Monitored technologies and turn off PHP-FPM.
- Go to
 Hosts Classic.
 - In the All hosts table, find and select the host you want to configure.
The host page is displayed. - Select More (…) > Settings.
- In the Monitored technologies table, find PHP-FPM and turn it on.
Monitor PHP-FPM
After you have enabled PHP-FPM monitoring, monitoring begins.
-
Go to
 Technologies & Processes Classic.
 -
Select the PHP tile.
-
To view cluster metrics, find PHP-FPM in the Process group table under the tiles and select Details to display the PHP-FPM process group details.
The chart displays the selected process group metric over time. You can select a different metric from the list. -
Select the Technology-specific metrics tab to display metrics specific to PHP-FPM.
- Select a different time interval from the time frame selector in the top menu bar to focus on a different time range.
- Select a metric type from the metric drop list under the timeline to compare the values of all nodes in a sortable table view.
-
To display node-specific metrics, select a node from the Process list at the bottom of the page.
-
Select the PHP-FPM tab to display the number of Accepted connections (connections accepted by the pool) and the Slow requests count.
Accepted connections is sometimes misunderstood to represent the number of requests, but this metric measures exactly what its name suggests: the number of connections accepted by the pool.
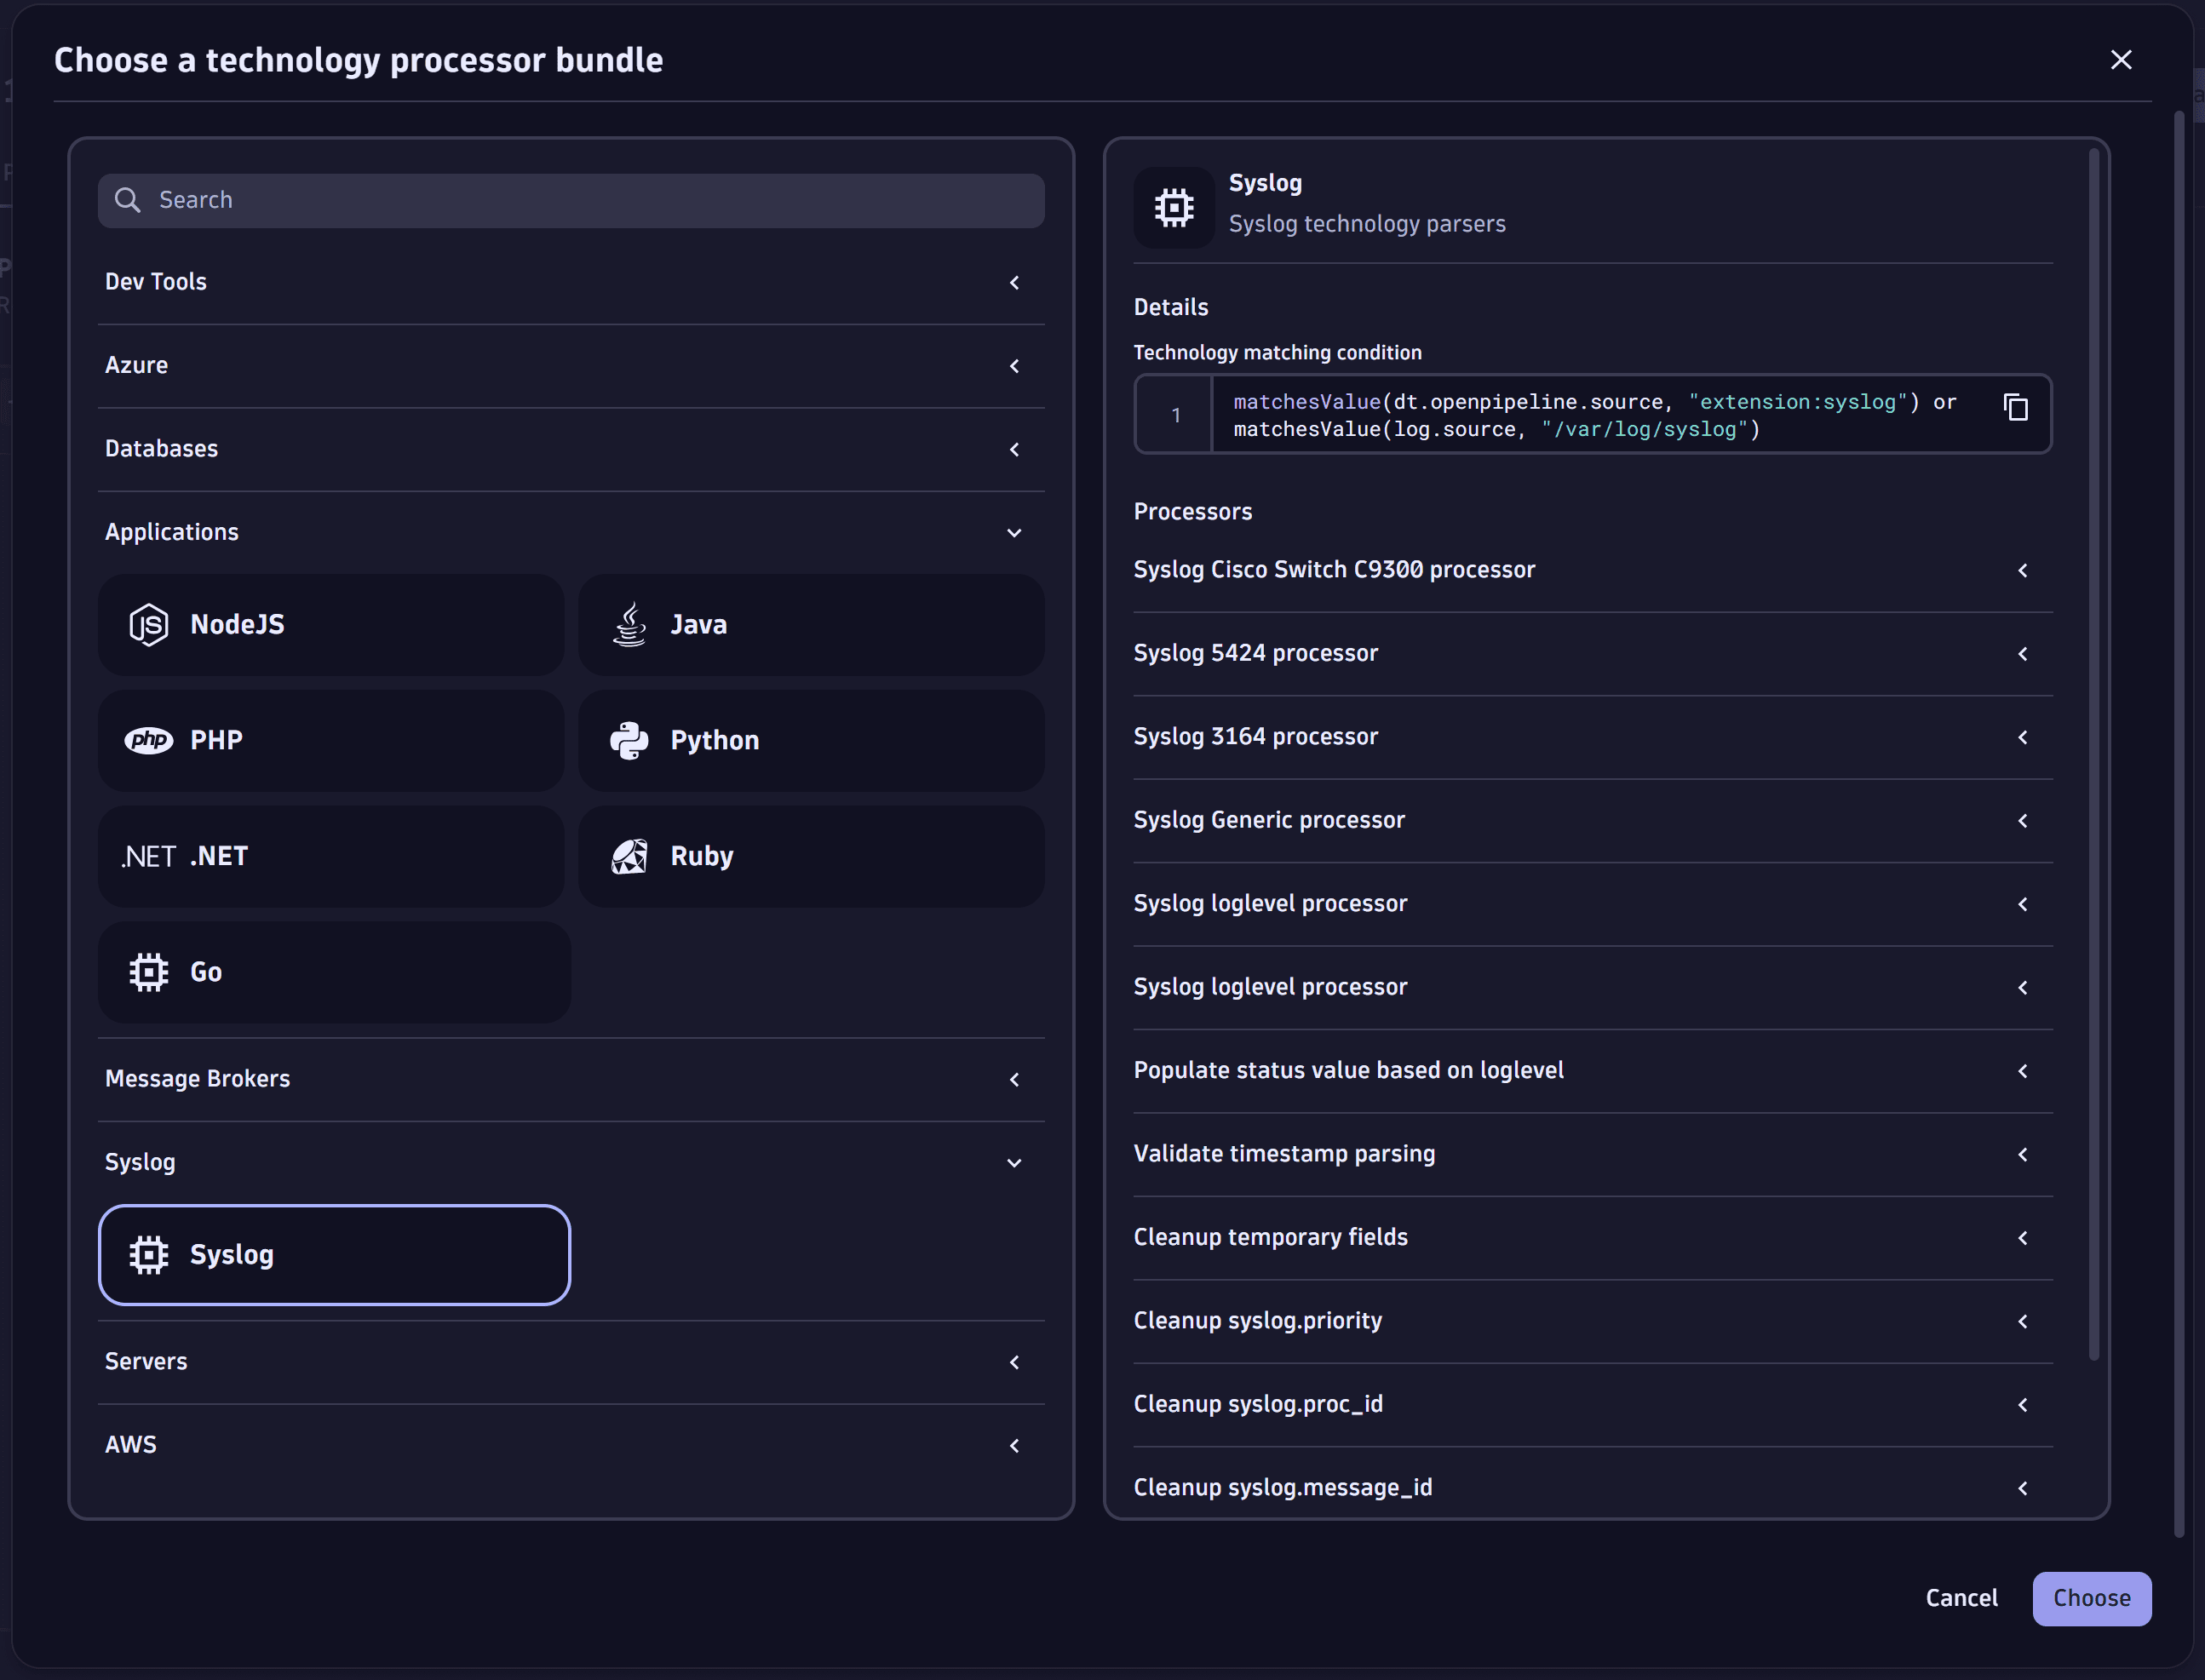
Process logs with technology bundle parsers
Through OpenPipeline, you can use and configure technology bundles. A technology bundle is a library of parsers (processing rules) that process logs from various technologies, such as Java, .NET, and Microsoft IIS.
Parsers help you to improve filtering, troubleshooting, metrics, alerts, and dashboards by efficiently extracting log levels and relevant attributes. You can also use technology bundles to structure logs from technologies that are not supported by Dynatrace out of the box.

For more information, see Process logs with technology bundle parsers.
PHP-FPM metrics
| Metric | Description |
|---|---|
Accepted connections | The number of connections accepted by the pool. |
Slow requests | The number of requests that have exceeded the |
Waiting connections | The number of requests in the queue of pending connections. |
Max number of waiting connections | The size of the pending connections socket queue. |
Active processes | The number of active processes. |
Total processes | The sum of idle and active processes. |
PHP-FPM node-monitoring metrics
More PHP-FPM monitoring metrics are available on individual process pages.
To view charts on Requests, Input buffering, and Processes, select the Further details tab.
When the number of total active processes reaches the Total processes limit, new scripts are prevented from running until the problematic processes have completed. The maximum number of Waiting connections defines the maximum number of connections that will be queued. When this limit has been reached, subsequent requests are refused or ignored.