OpenTelemetry instrument code samples
Java examples of the following instruments are shown below.
General procedure
To create an OpenTelemetry metric instrument
-
Build the MetricExporter (Dynatrace, OTLP, in-memory, etc.).
-
Build the MeterProvider.
-
Build the Meter.
-
Build the instrument itself.
-
Provide the instrument with a name, as well as a description and unit (optional).
-
Collect the attributes you want to add to the instrument and pass them as a parameter (for example, in a list).
-
Call the instrument and its method anywhere you want to record or measure.
Asynchronous instruments have a callback function that is invoked only on demand (when the Meter is being observed, also called observable instruments).
You need to declare the MetricsExporter, MeterProvider, Sdk, and Meter only once, at the start of your program, as shown below.
DynatraceMetricExporter dynatraceMetricExporter = DynatraceMetricExporter.builder().setUrl("<URL>").setApiToken("<TOKEN>").build();SdkMeterProvider meterProvider = SdkMeterProvider.builder().registerMetricReader(PeriodicMetricReader.builder(dynatraceMetricExporter).build()).build();OpenTelemetry openTelemetry = OpenTelemetrySdk.builder().setMeterProvider(meterProvider).buildAndRegisterGlobal();Meter meter = openTelemetry.meterBuilder("instrumentation-library-name").setInstrumentationVersion("1.0.0").build();Attributes attributes = Attributes.of(AttributeKey.stringKey("my-key-1"), "my-value-1",AttributeKey.stringKey("my-key-2"), Long.valueOf(new Random().nextInt(3)).toString());
Counter
After creation, call the counter and its add method anywhere you want to count. In this case, it is set in a request handler so that it adds each time a request is made.
private static LongCounter counter;counter = meter.counterBuilder("my-counter").setDescription("This is my cool counter.").build();counter.add((long) new Random().nextInt(11), attributes)
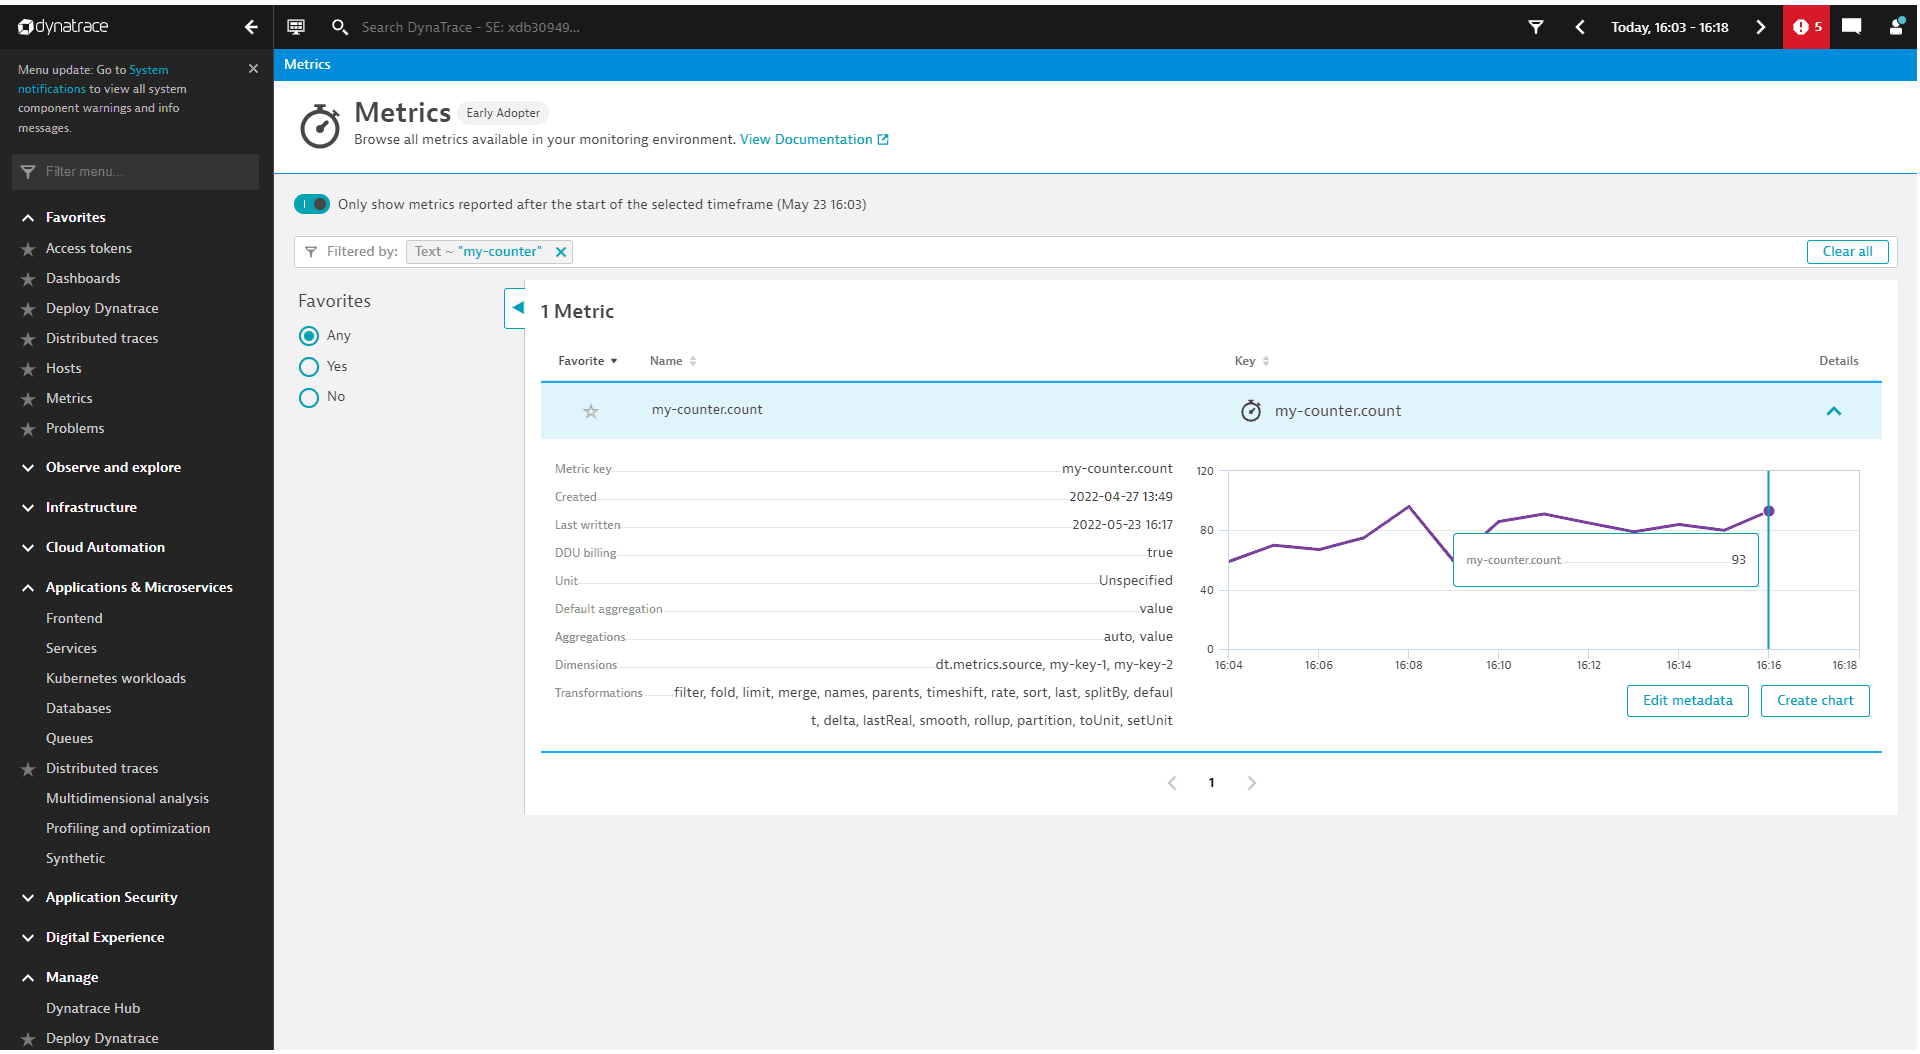
You should be able to view your counter in the Dynatrace Metrics browser as in the example below. To see further details and split by any attributes you passed, select Create chart to display a new view in Data Explorer.
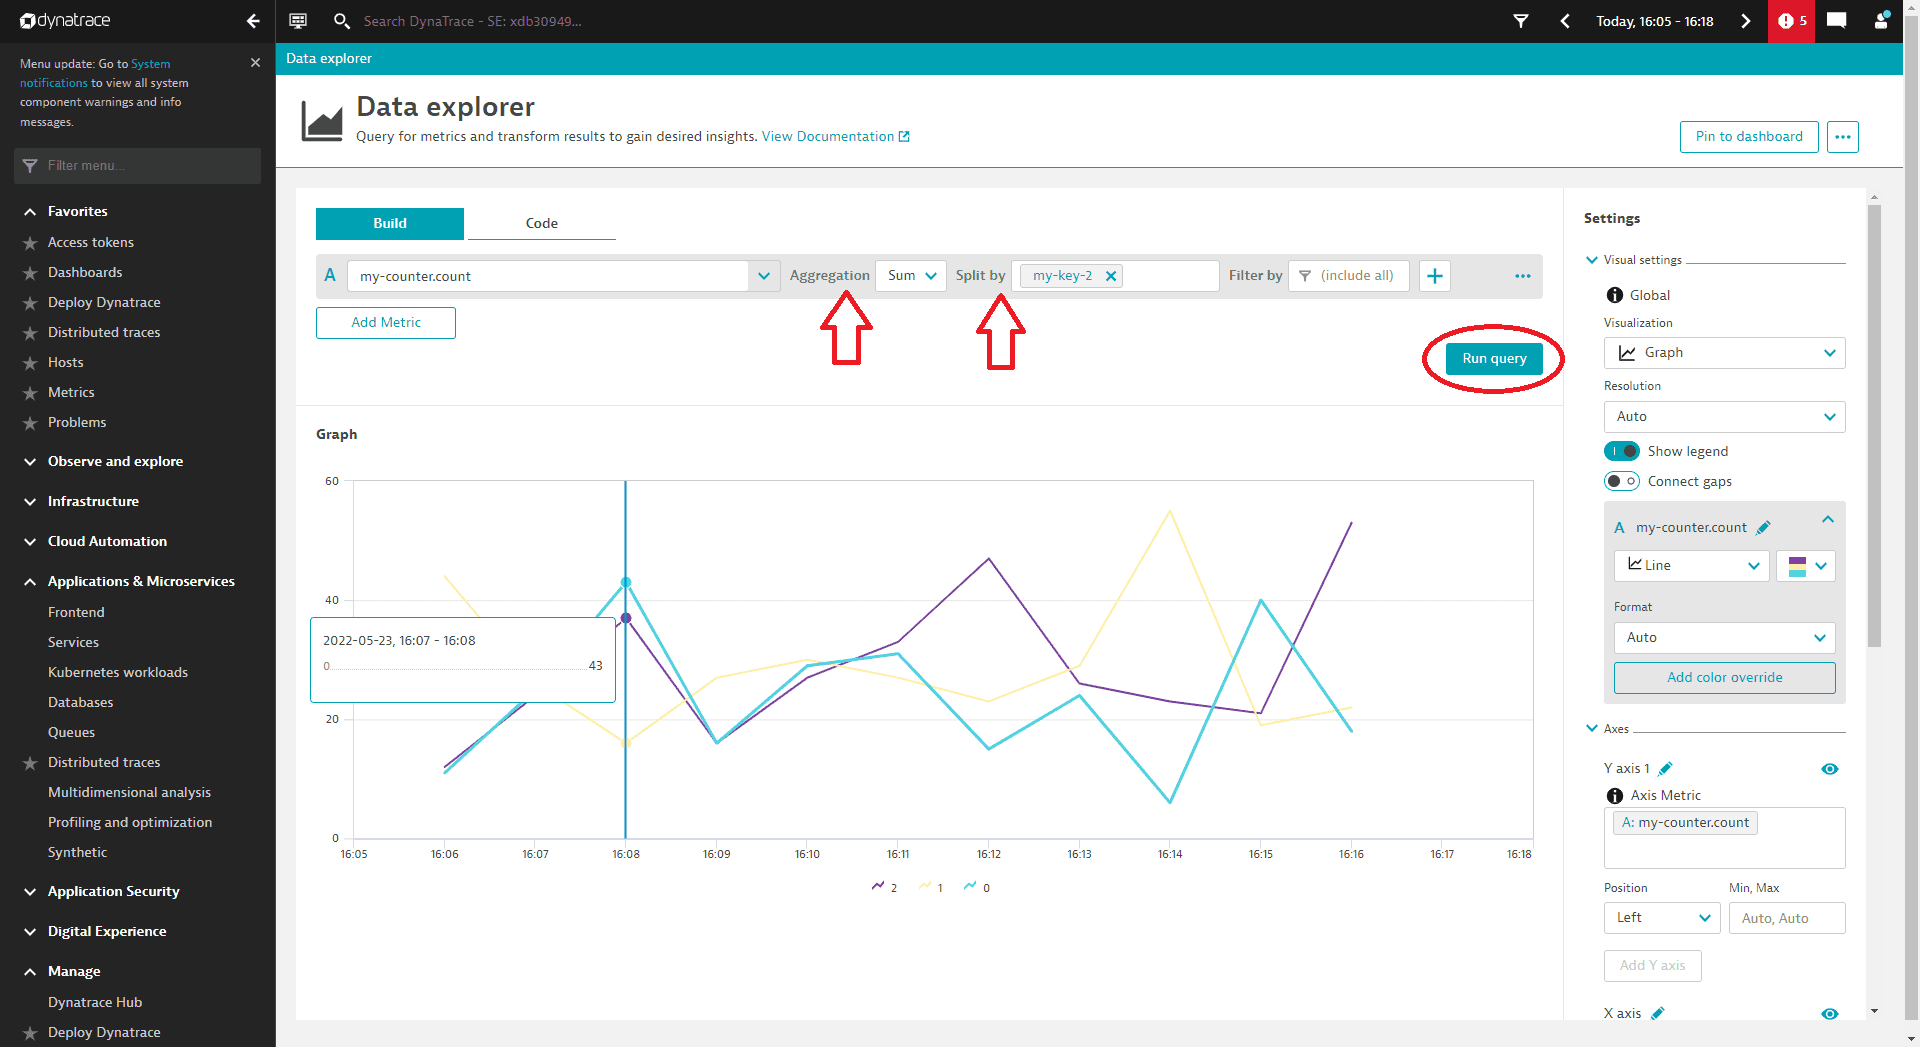
Define the Aggregation as well as where you would like to split the metrics, and then run the query.
In the example below, it shows the sum of the number of times that my-key-2 was either 0, 1, or 2.
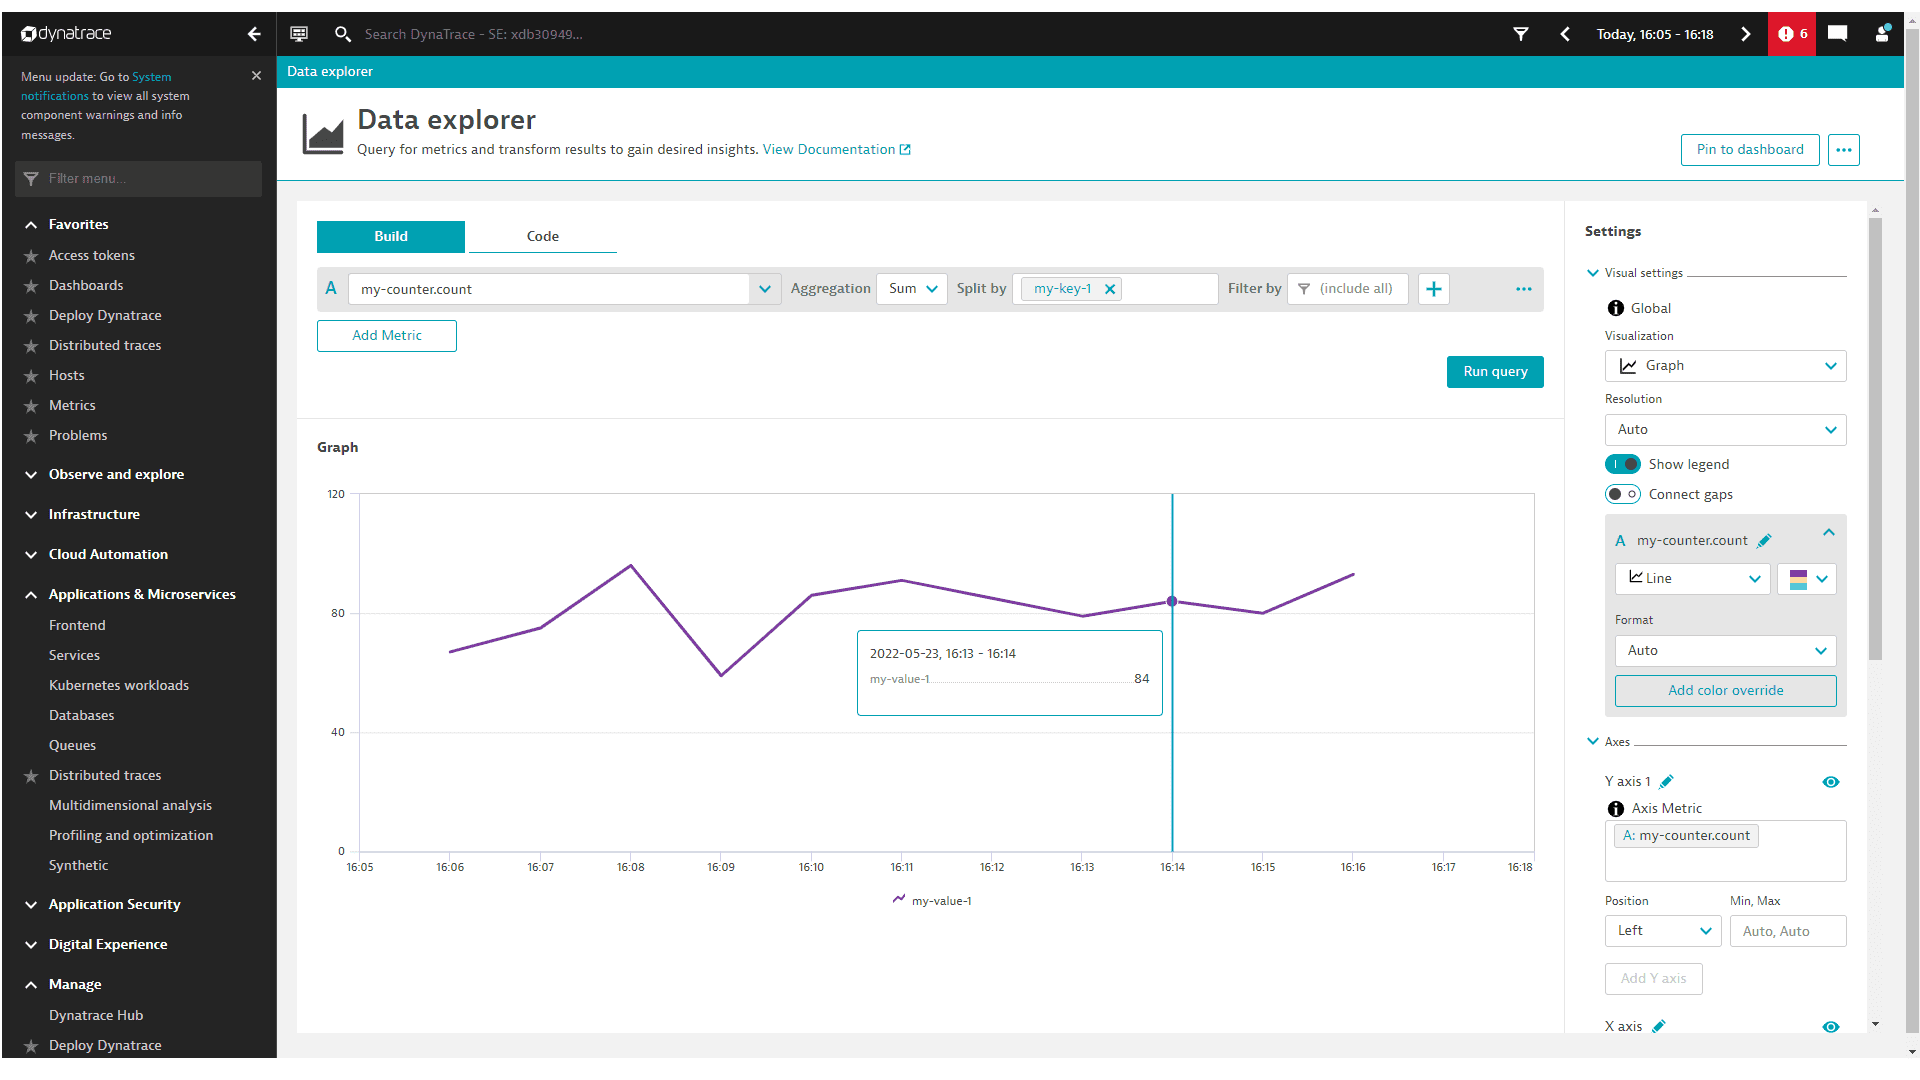
The same query split by my-key-1 would simply add up the number of times the request was made and display a single line on the graph as below.
Asynchronous Counter
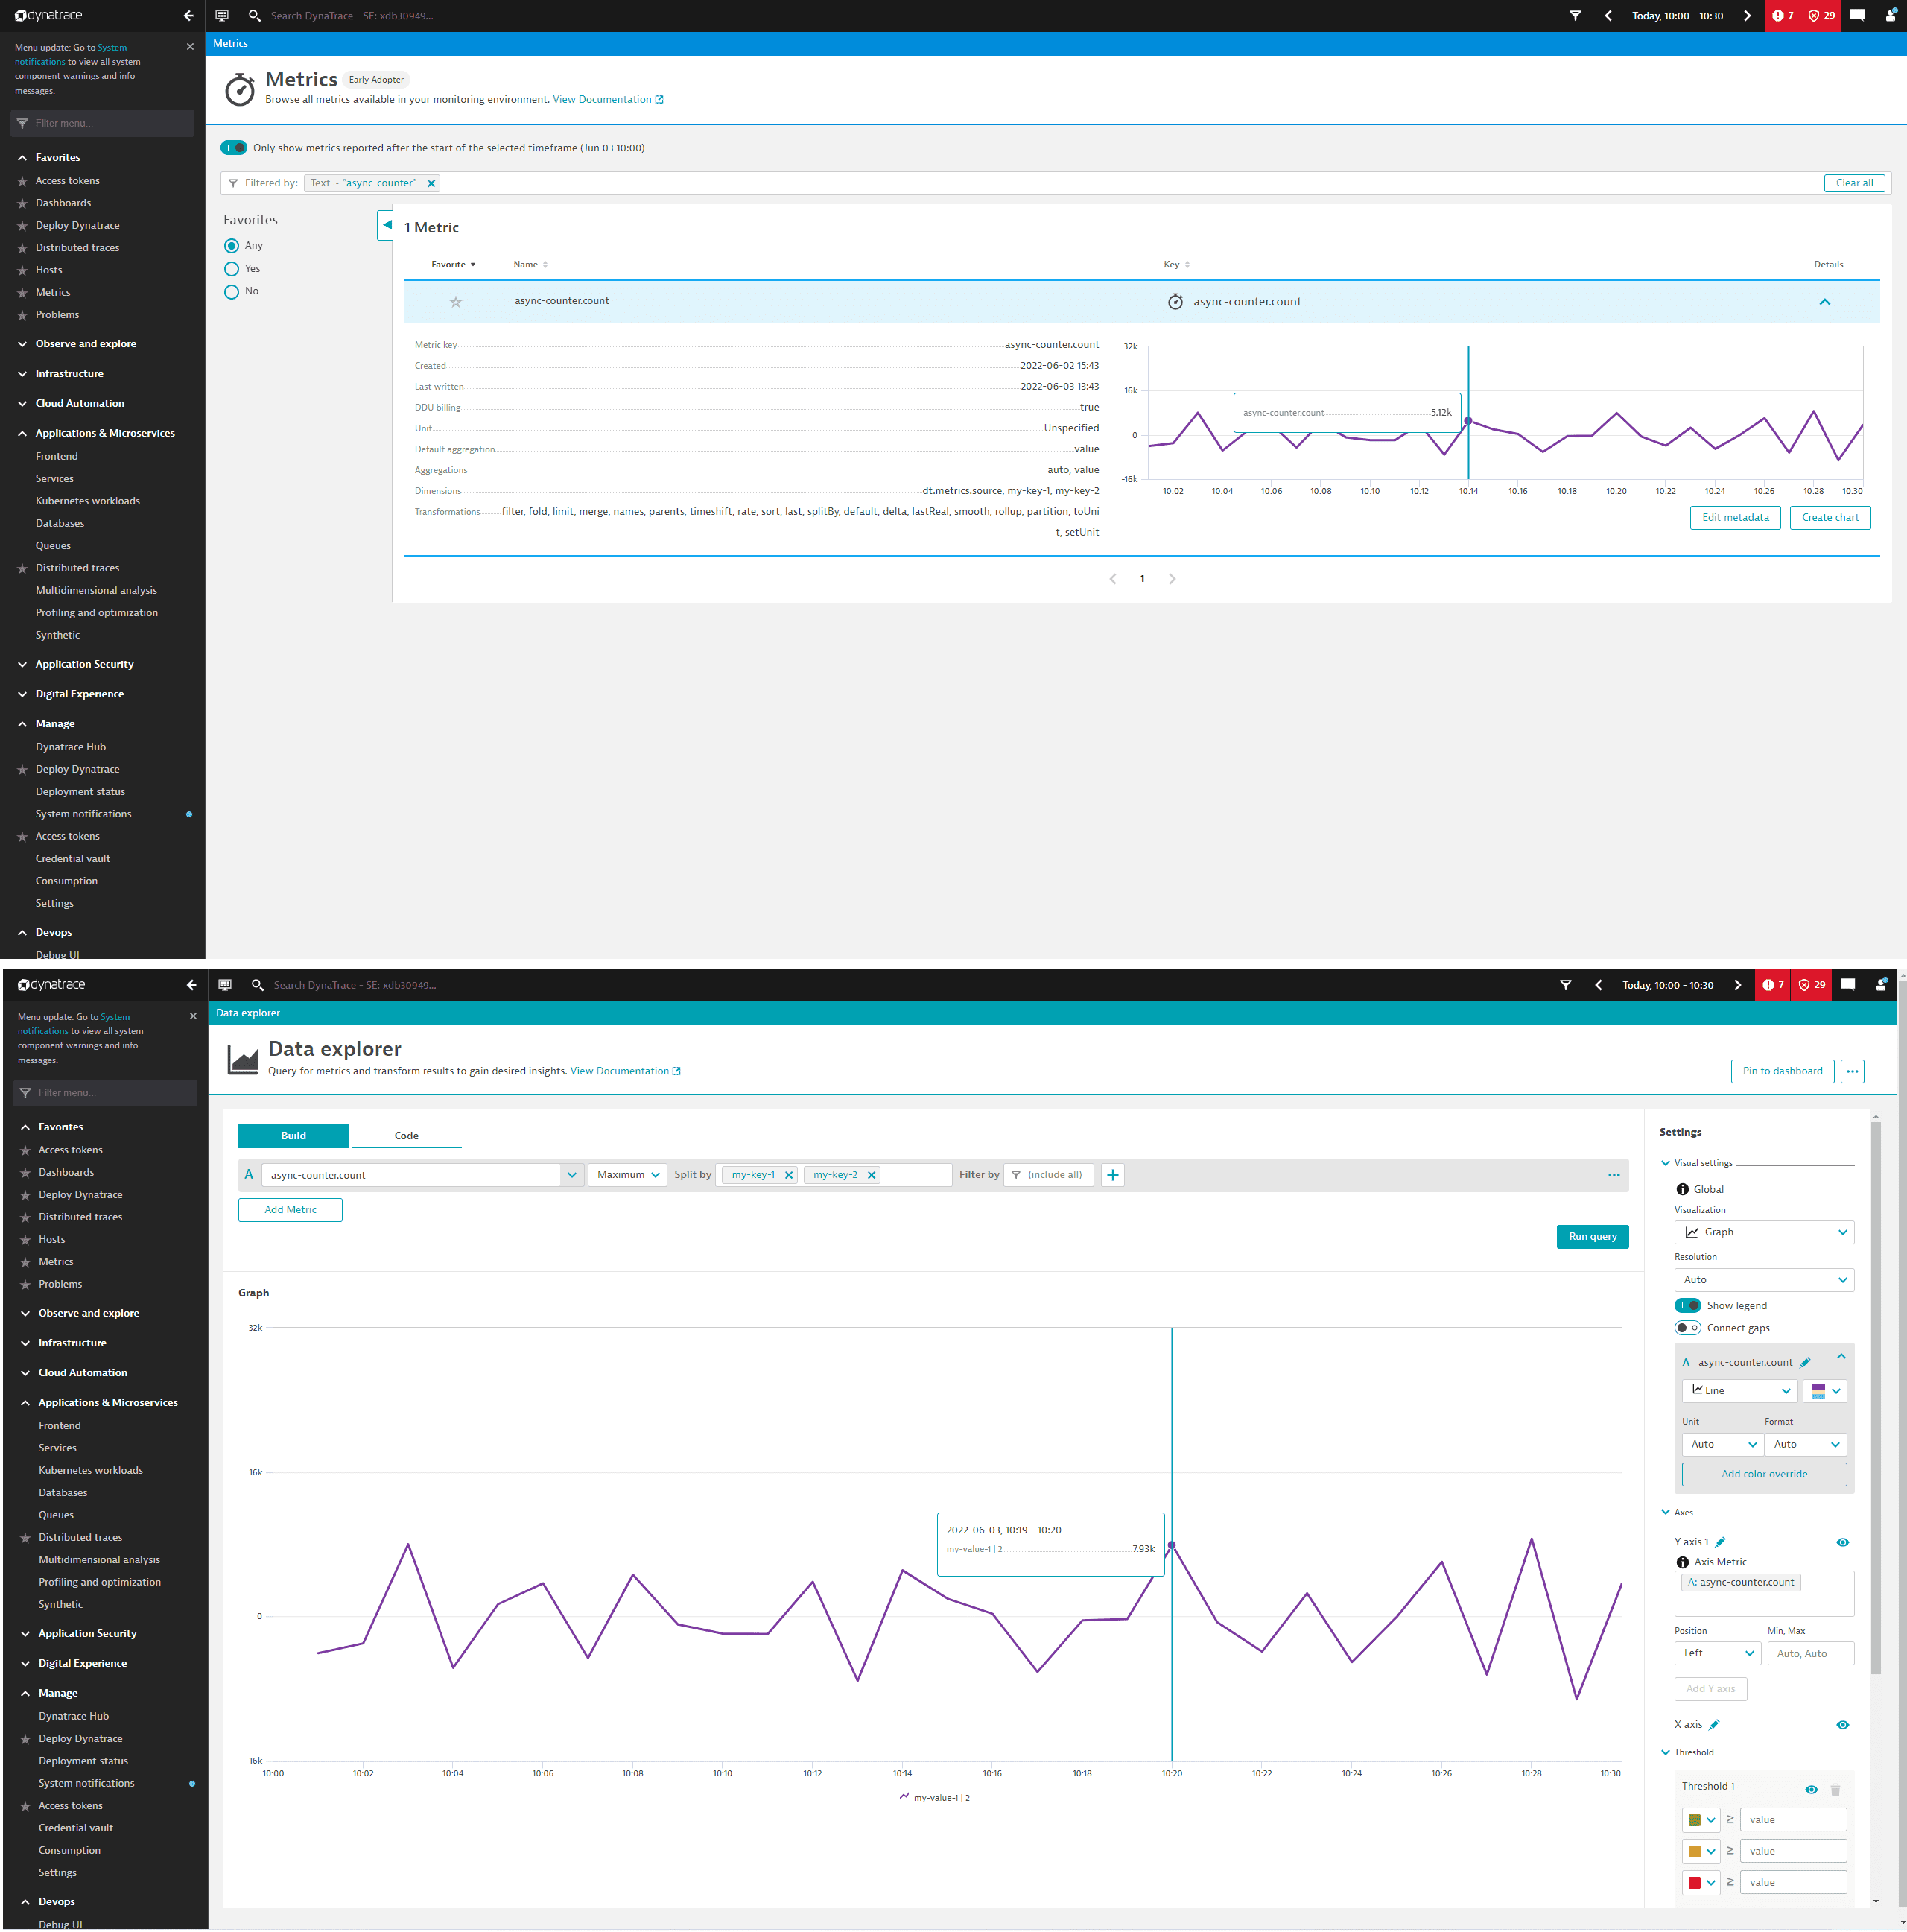
In this example, the asynchronous counter is created with a callback method. The thread is then sent to sleep in a loop so it stays open. Any time the thread is not sleeping, the meter is being observed and, thus, data is being collected by the async counter and sent out.
private static ObservableLongCounter asyncCounter;asyncCounter = meter.counterBuilder("my-async-counter").setDescription("This is my cool Asynchronous Counter.").buildWithCallback(measurement -> {measurement.record(new Random().nextInt(10000), attributes);});
Histogram
// The recommended boundaries for request duration (in seconds) according to Semantic ConventionsList<Double> bucketBoundaries = Arrays.asList(0.005d, 0.01d, 0.025d, 0.05d, 0.075d, 0.1d, 0.25d, 0.5d, 0.75d, 1d, 2.5d, 5d, 7.5d, 10d);DoubleHistogram histogram = meter.histogramBuilder("http.server.request.duration").setDescription("Duration of HTTP server requests.").setExplicitBucketBoundariesAdvice(bucketBoundaries).setUnit("s").build();// Record a request that took 1shistogram.record(1);
Asynchronous Gauge
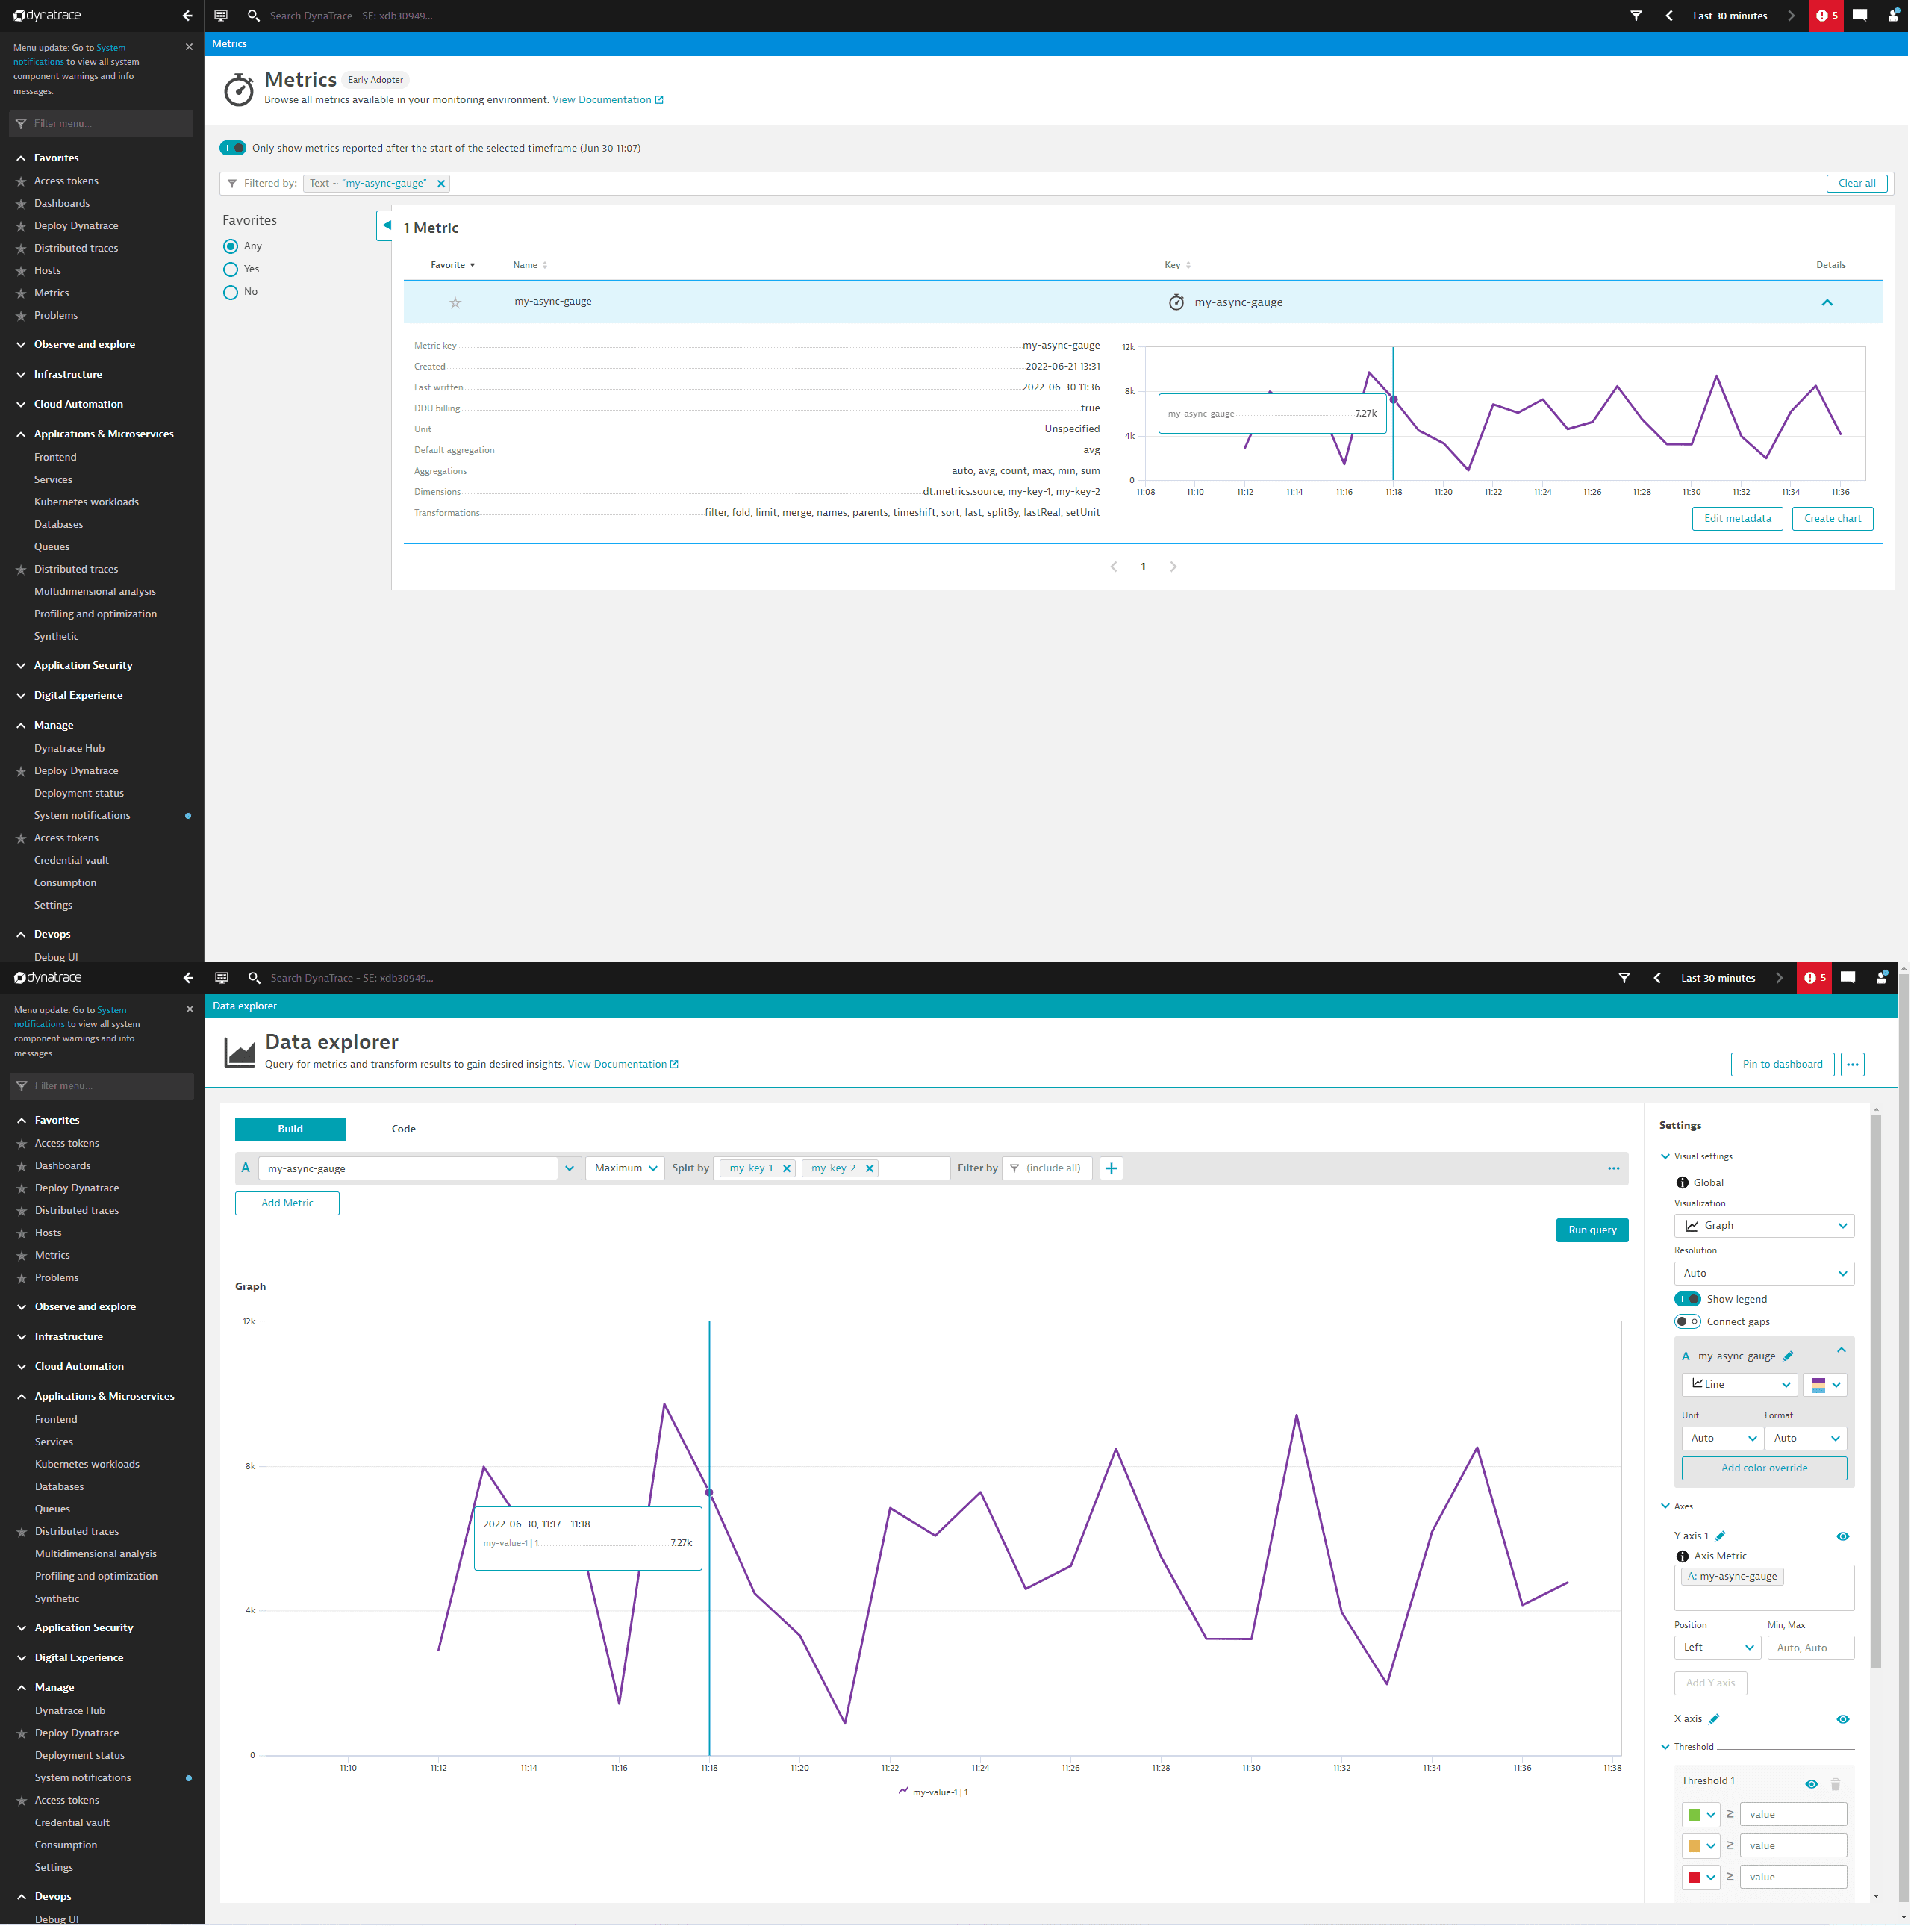
The asynchronous Gauge is created and called the same way as the asynchronous Counter above.
private static ObservableDoubleGauge asyncGauge;asyncGauge = meter.gaugeBuilder("my-async-gauge").setDescription("This is my cool Asynchronous Gauge.").setUnit("ms").buildWithCallback(measurement -> {measurement.record(new Random().nextInt(10000), attributes);});
UpDownCounter
After creation, call the UpDownCounter and its add method anywhere you want to count. In this case, we set it in a request handler so that it adds each time a request is made.
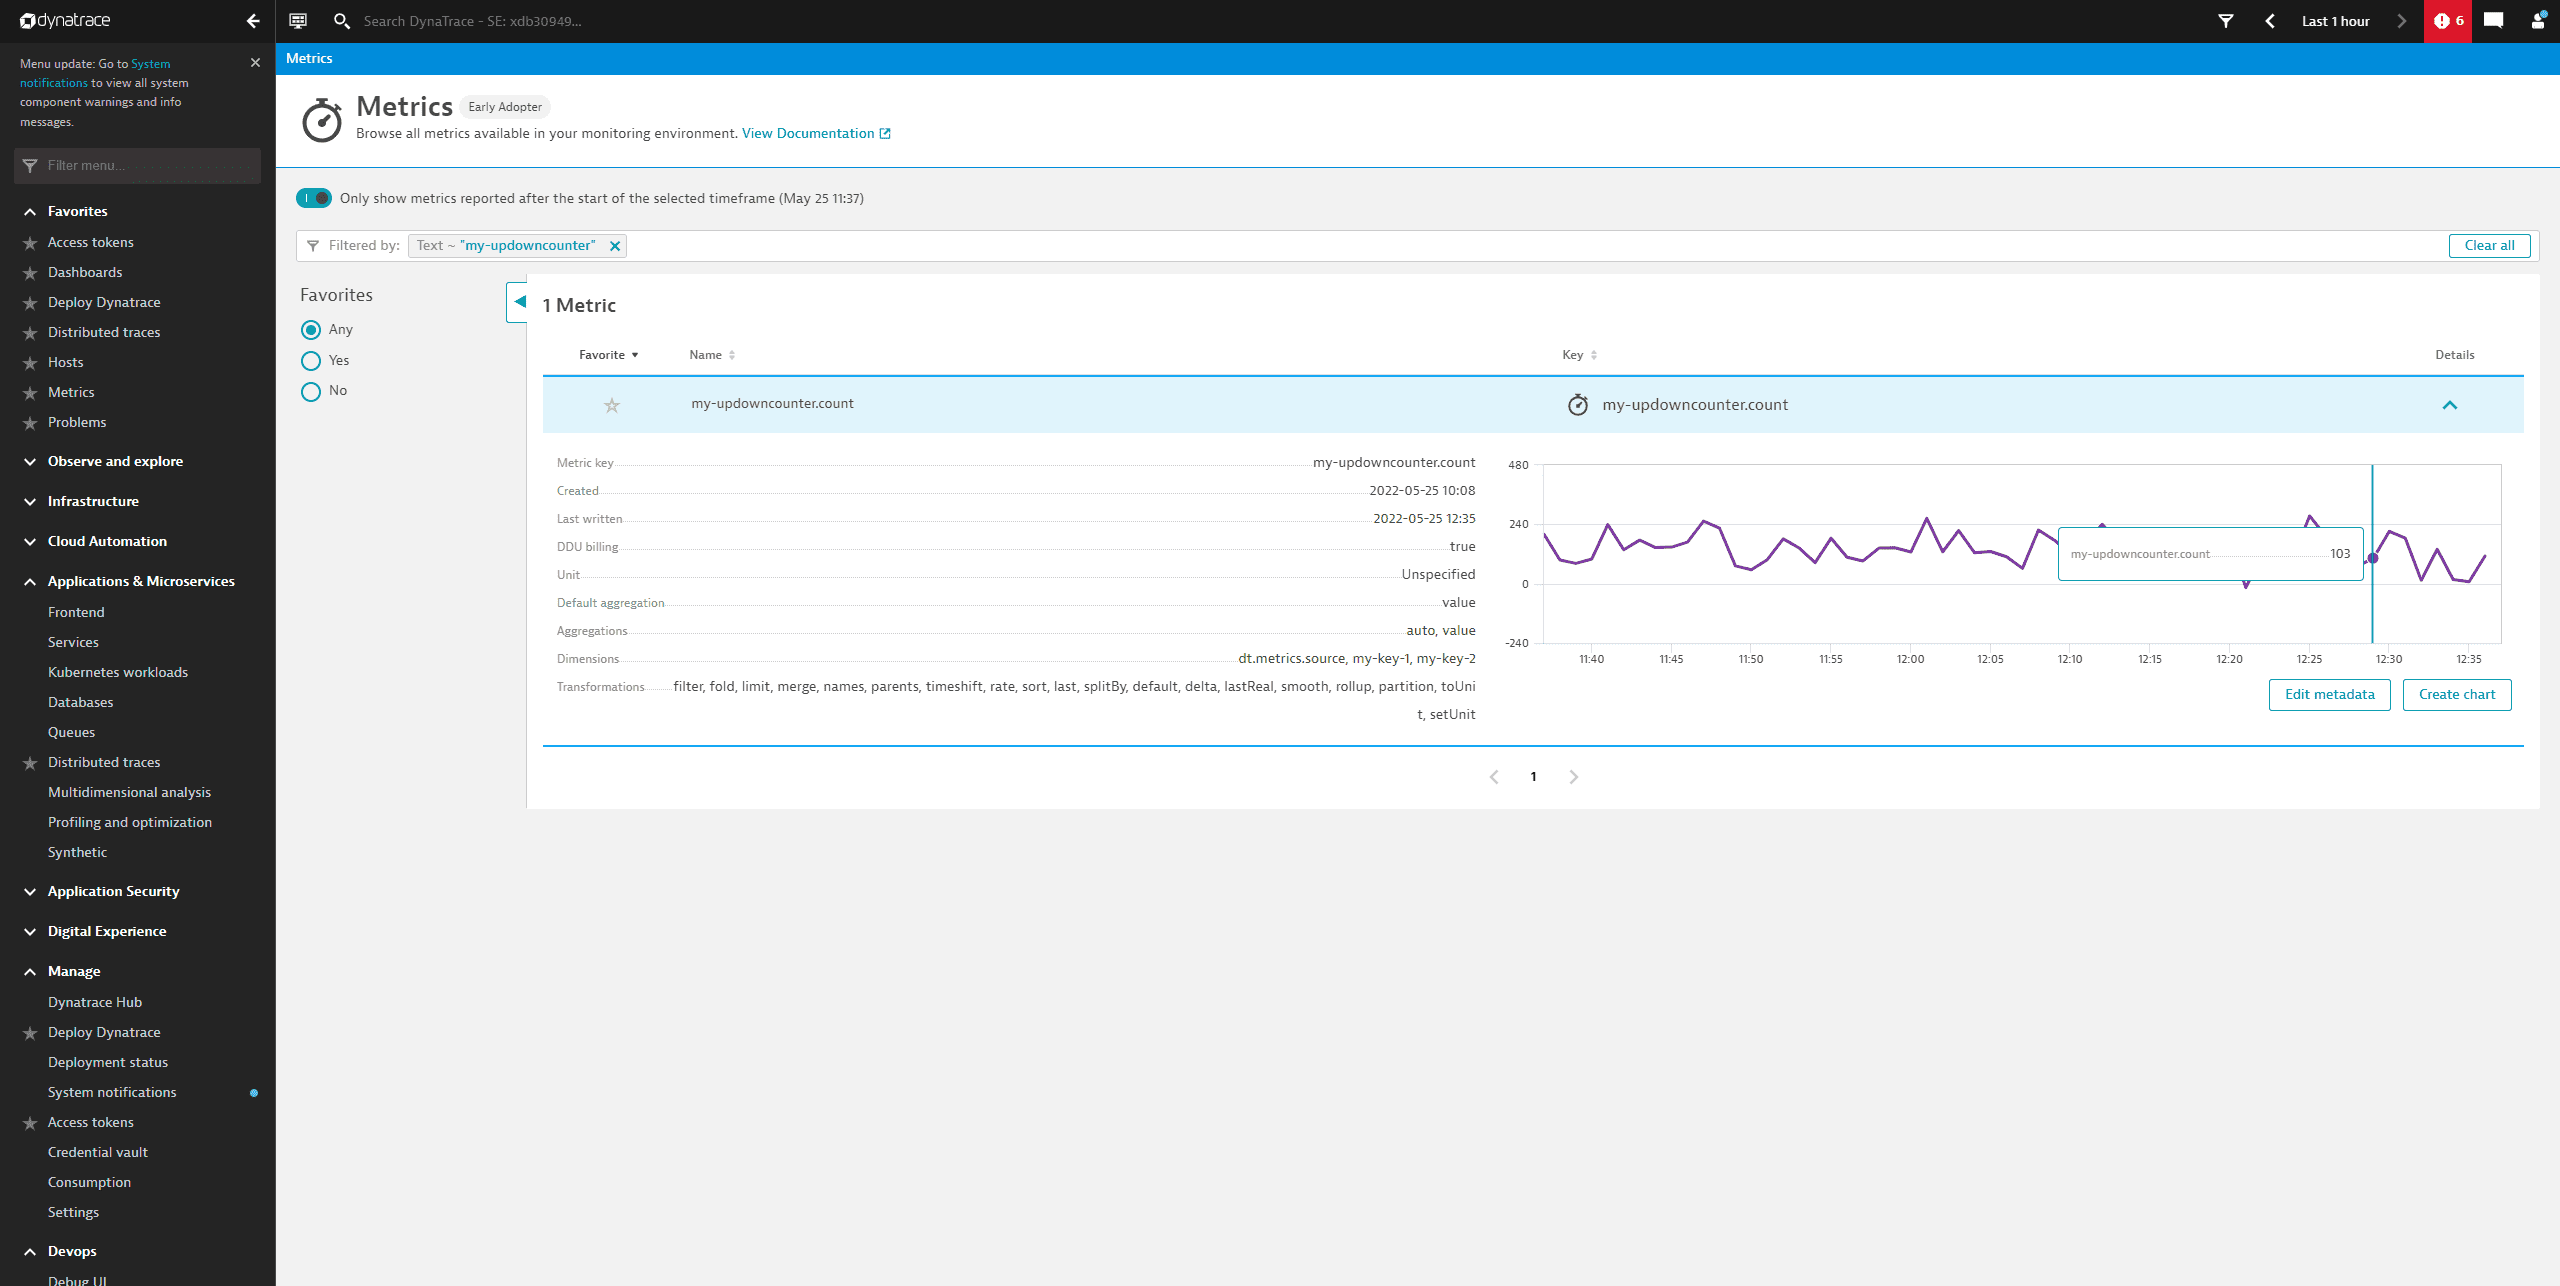
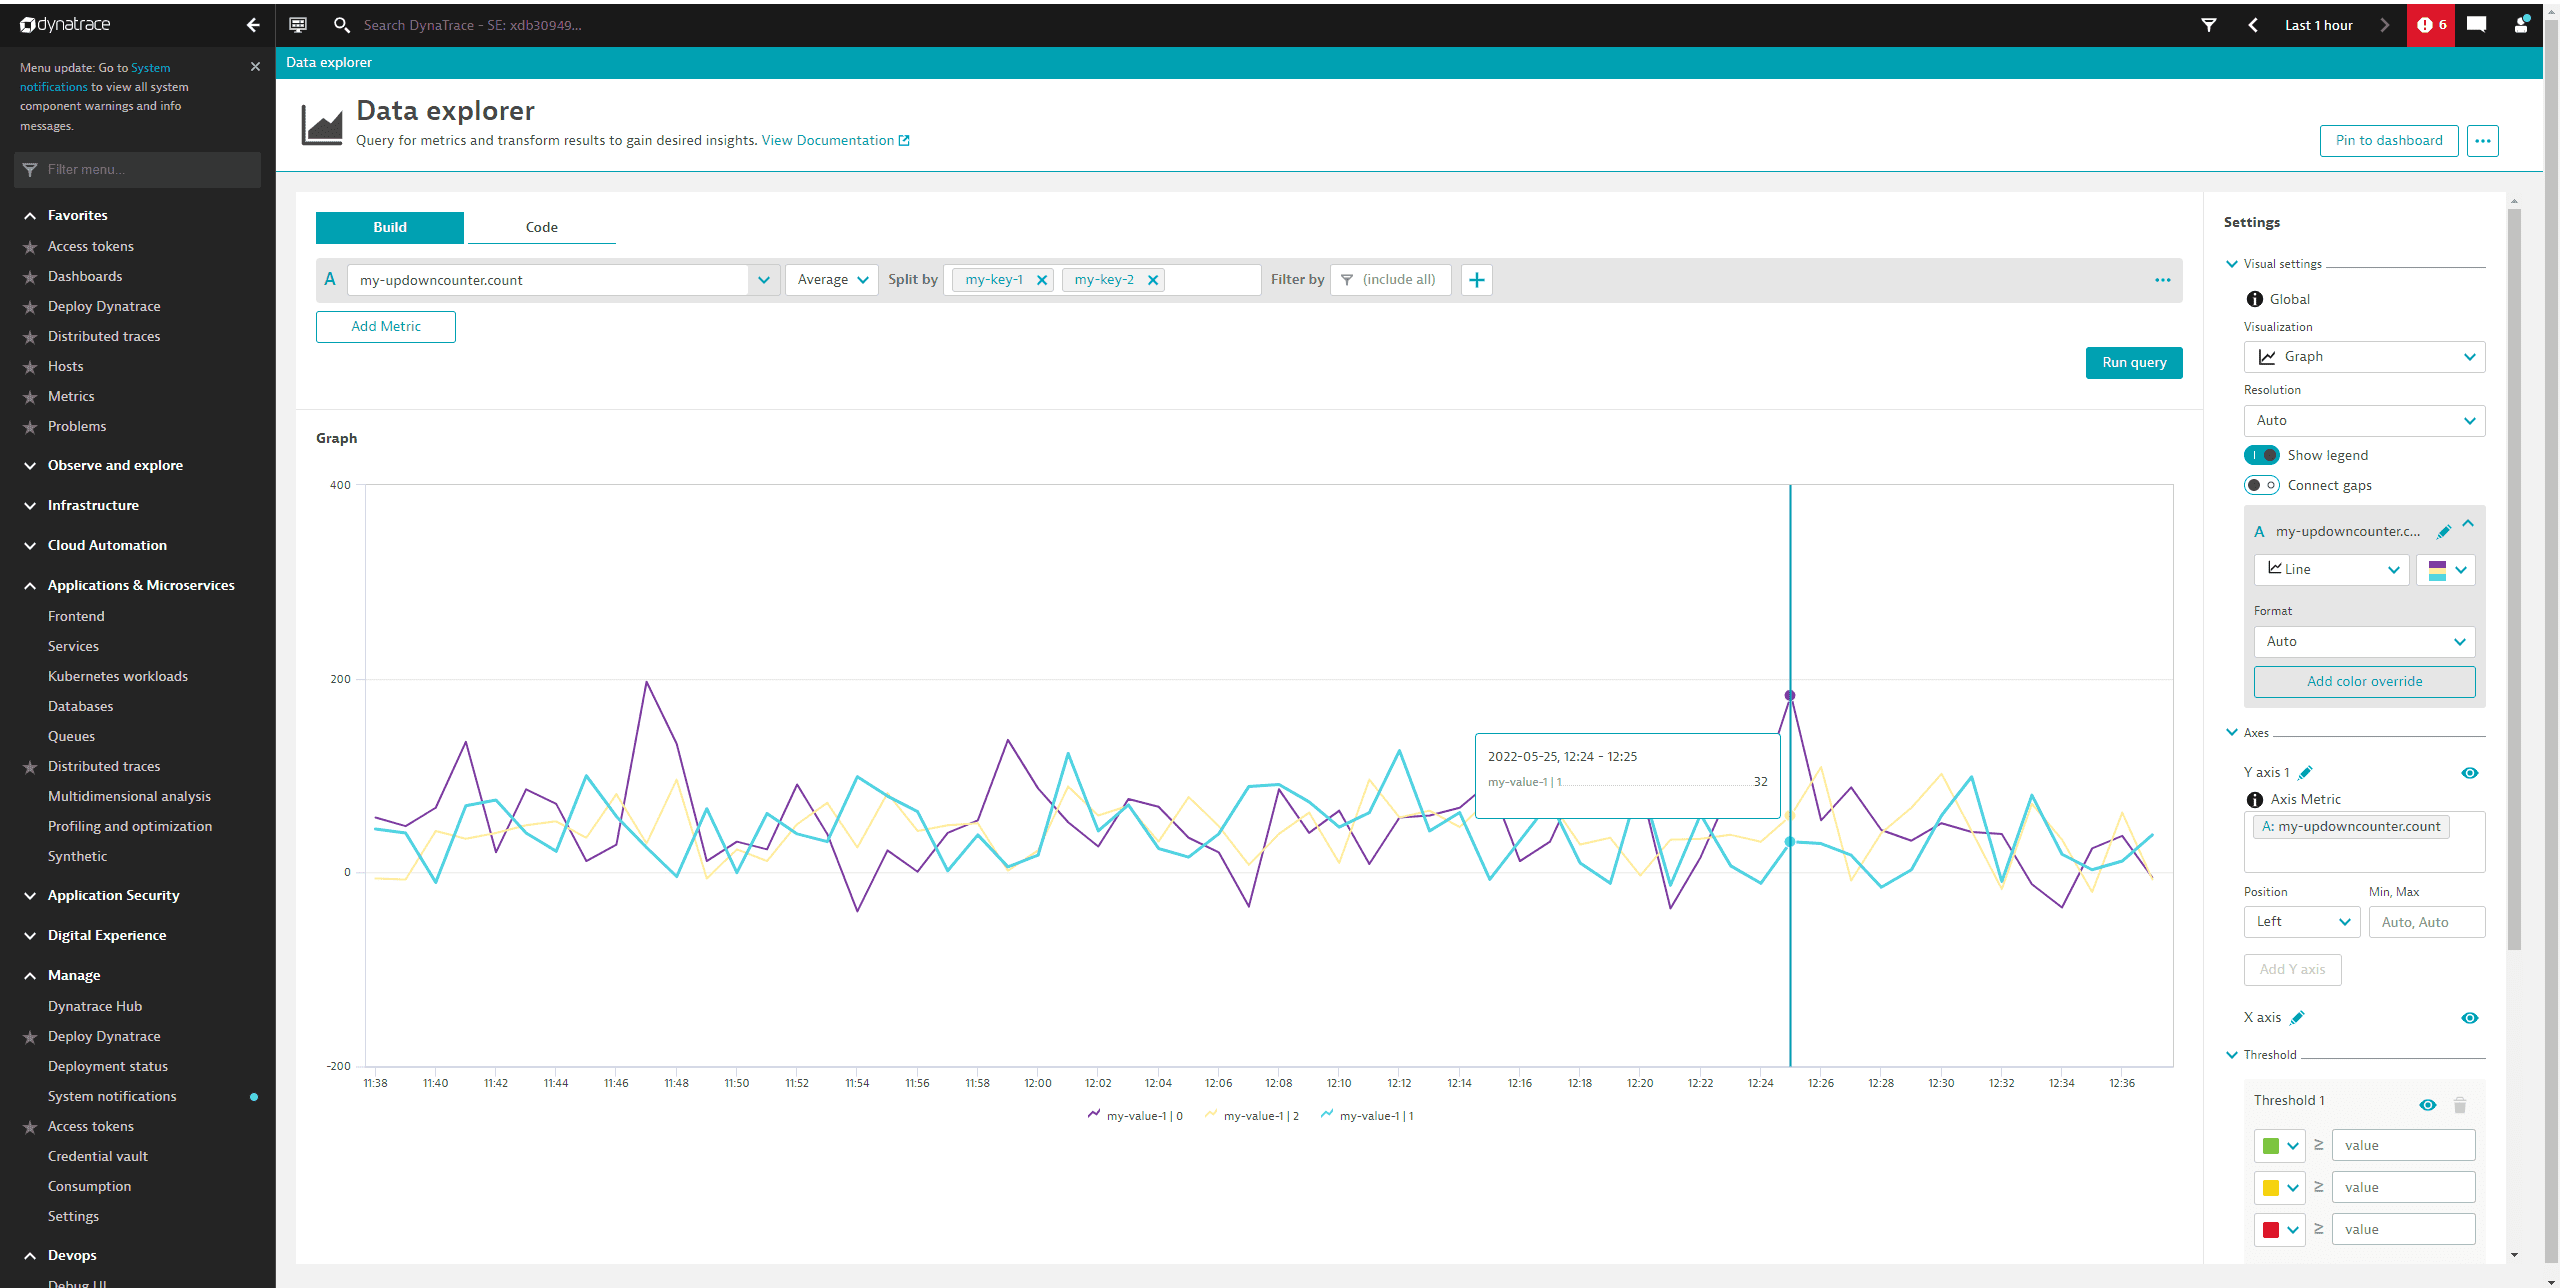
private static LongUpDownCounter longUpDownCounter;longUpDownCounter = meter.upDownCounterBuilder("my-updowncounter").setDescription("This is my cool UpDownCounter.").build();longUpDownCounter.add((long) new Random().nextInt(50), attributes);longUpDownCounter.add(-15, attributes);
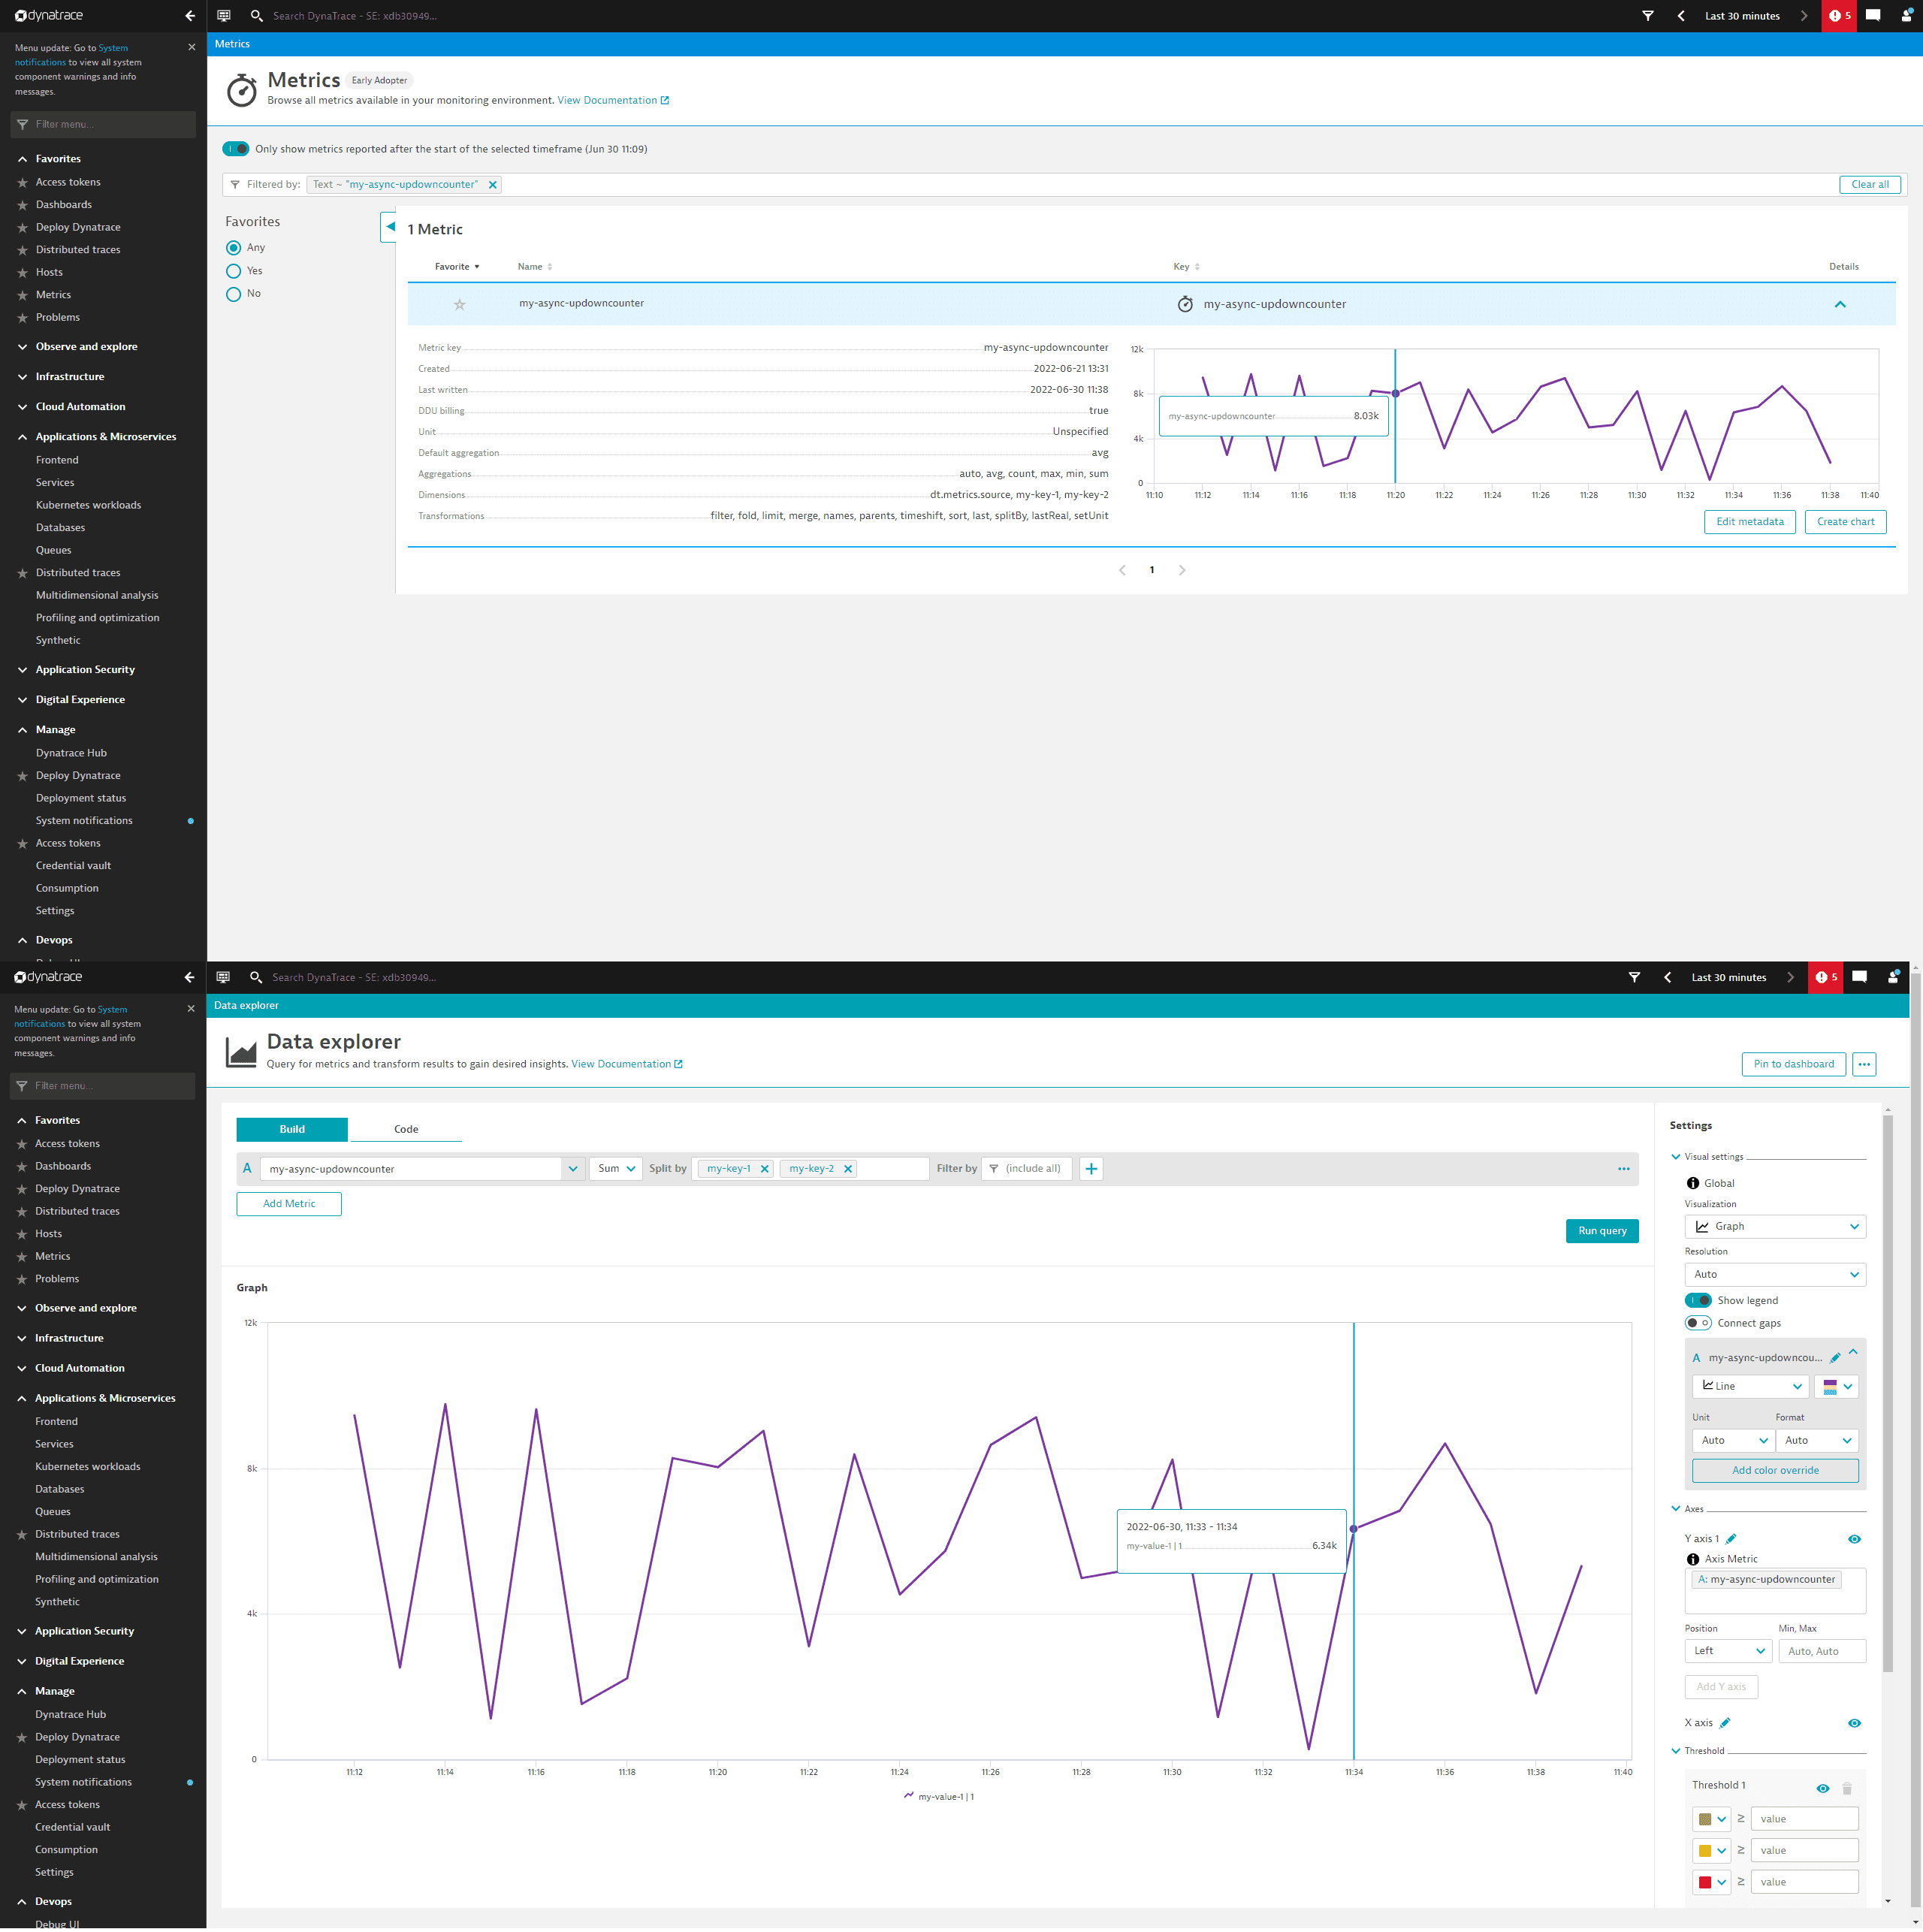
If you set it up correctly, you should see a graph like the one below in the Dynatrace Metrics browser. Select Create chart to display a graph in Data Explorer.
Data Explorer will then look like the image below. Note that this is not split yet.
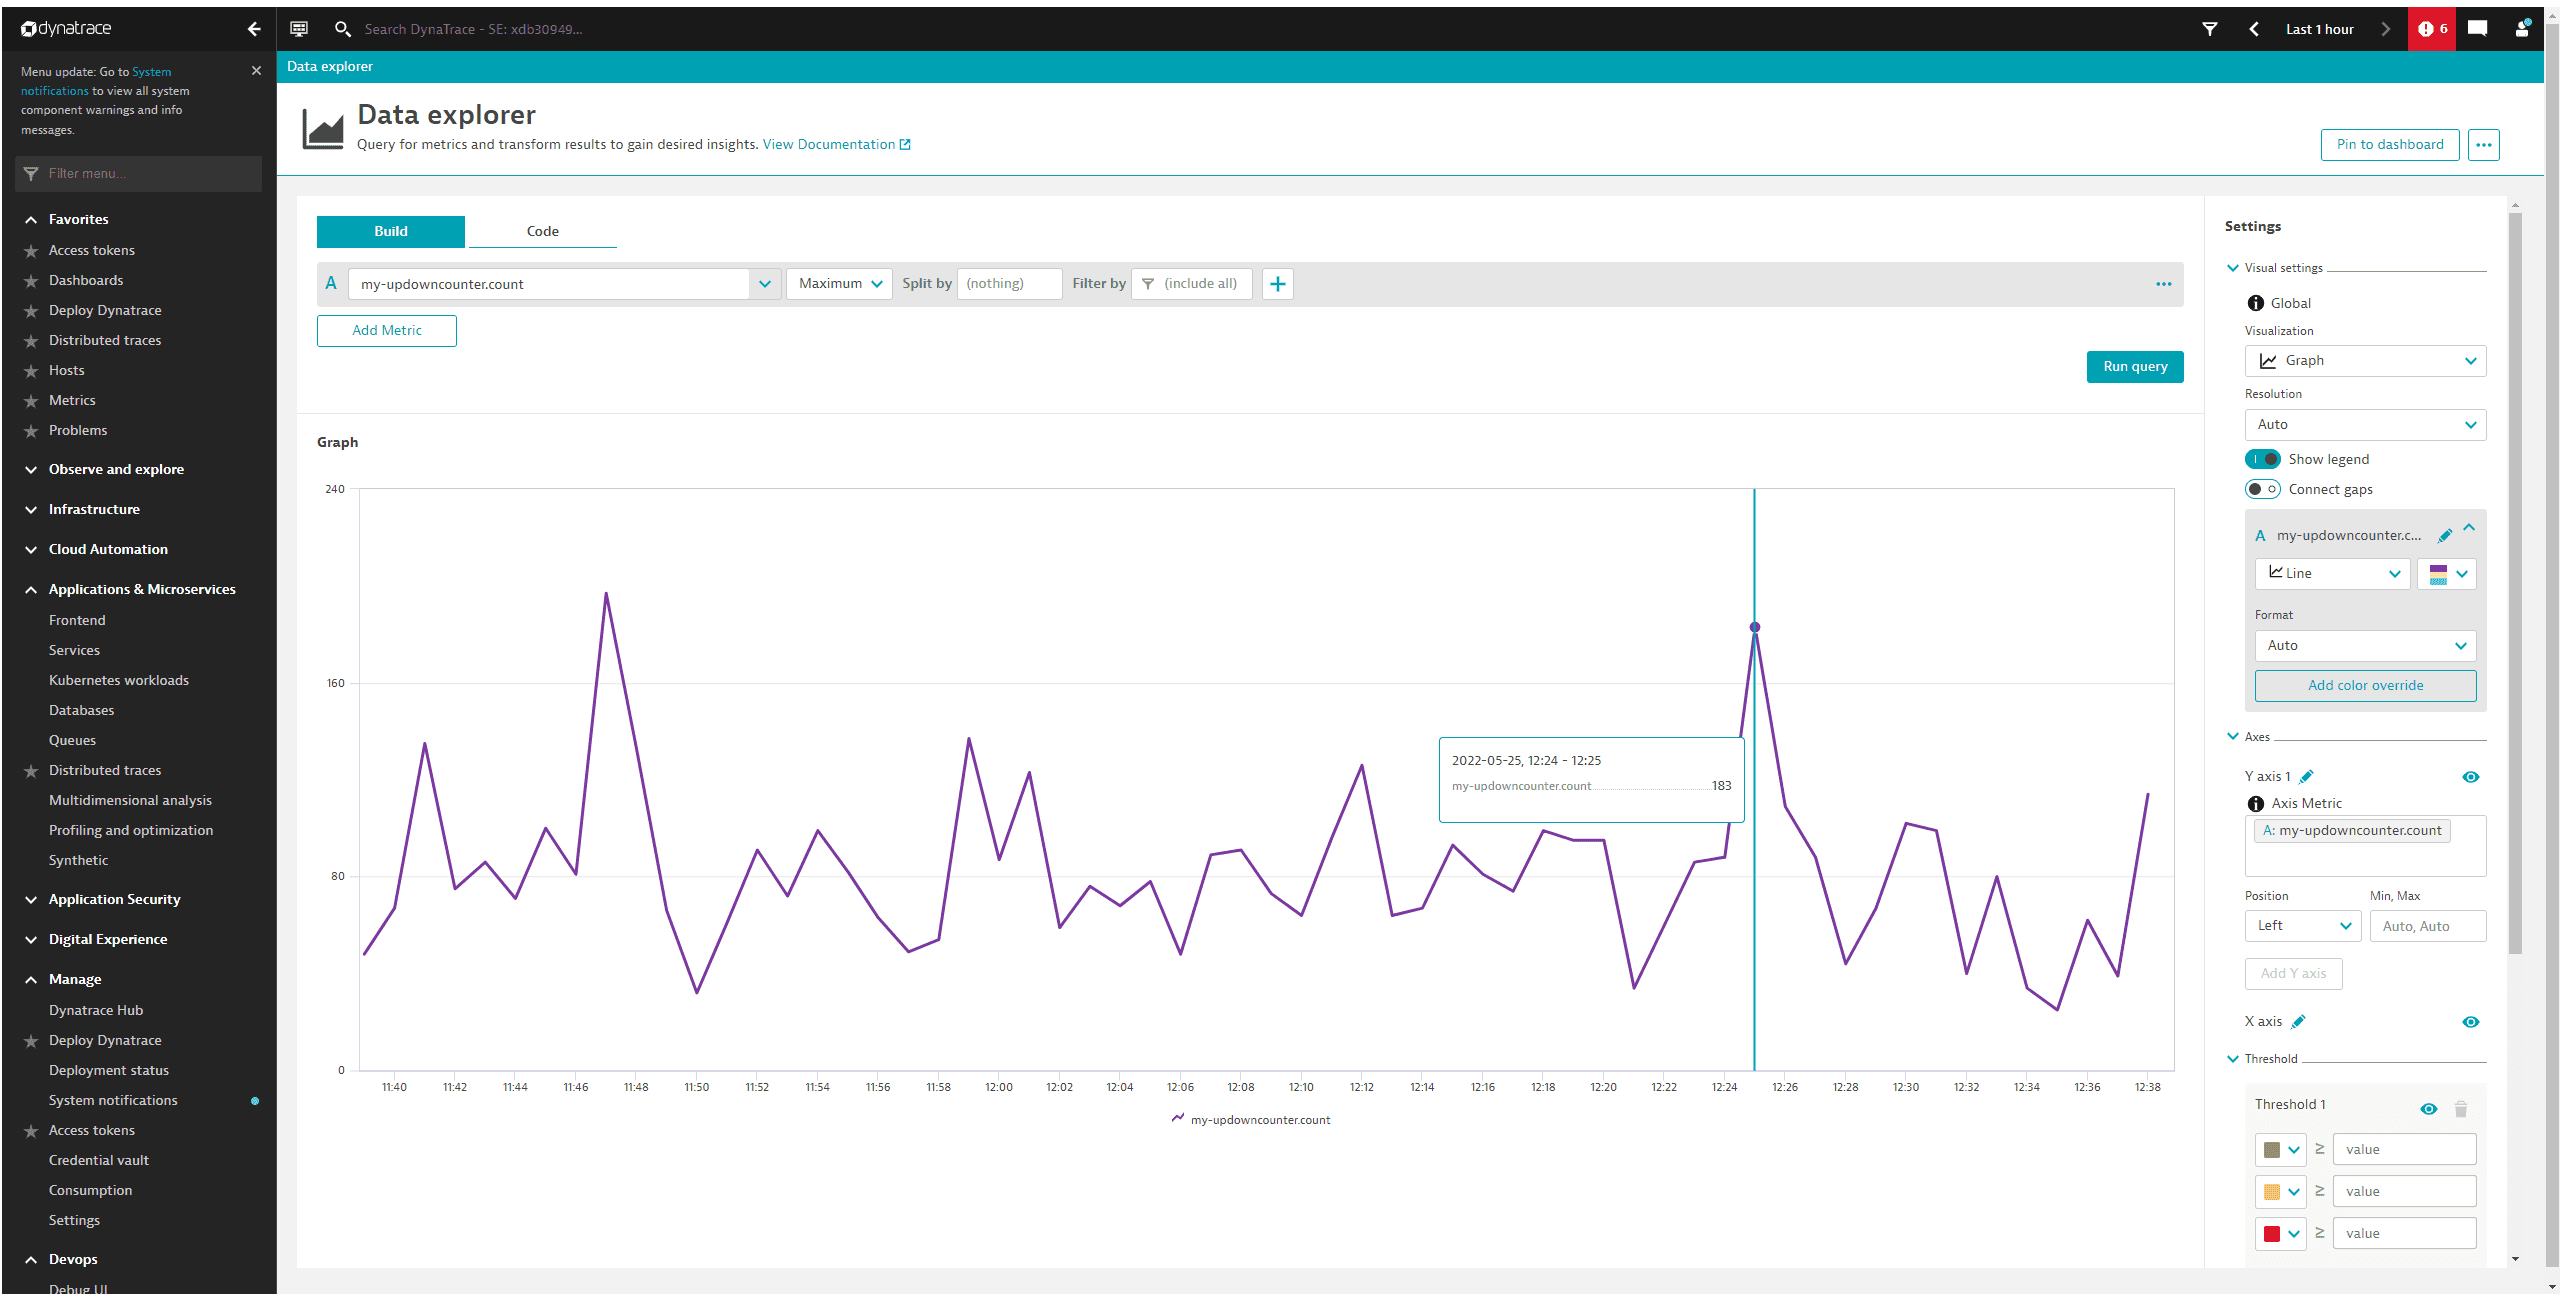
Once you split the graph along its attributes, you will see something like the following graph.
Asynchronous UpDownCounter
The asynchronous UpDownCounter is created and called the same way as the asynchronous Counter above.
private static ObservableLongUpDownCounter asyncUpDownCounter;asyncUpDownCounter = meter.upDownCounterBuilder("my-async-updowncounter").setDescription("This is my cool Asynchronous UpDownCounter").buildWithCallback(measurement -> {measurement.record(new Random().nextInt(10000), attributes);});
