Azure Service Bus (built-in)
- Latest Dynatrace
- How-to guide
- 1-min read
- Published Jul 27, 2022
Dynatrace ingests metrics from Azure Metrics API for Azure Service Bus. You can view metrics for each service instance, split metrics into multiple dimensions, and create custom charts that you can pin to your dashboards.
Prerequisites
- Dynatrace version 1.201+
- Environment ActiveGate version 1.195+
- To disable monitoring of built-in services, you need Environment ActiveGate version 1.245+ and Dynatrace version 1.247+.
Enable monitoring
To learn how to enable service monitoring, see Enable service monitoring.
View service metrics
You can view Azure service metrics in your Dynatrace environment on the Azure subscription page or on your own dashboard.
Values in the table depend upon the selected timeframe. For more details, see Troubleshoot timeframe comparison for Azure monitoring setup).
View metrics on the Azure account page
To access metrics on the Azure account page
-
Go to
 Azure Classic.
 -
Choose the Azure subscription.
-
Select the service whose metrics you want to check. Metrics for the selected service are visible under the infographic in the service section, similarly to the example below.
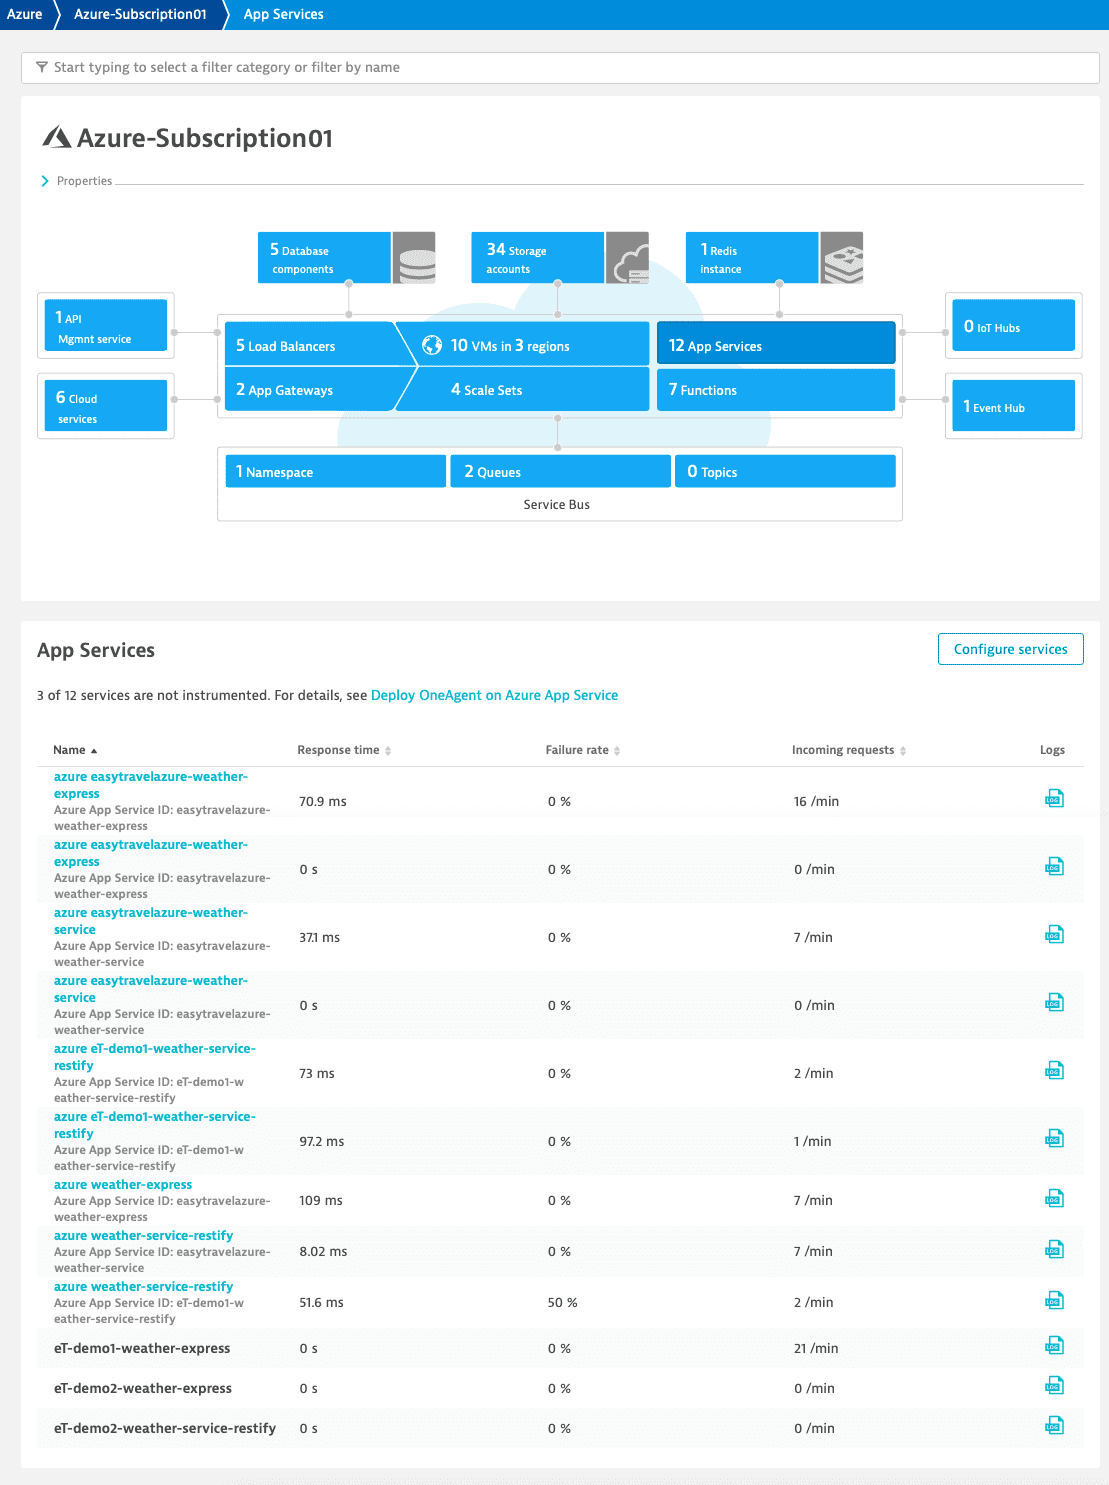 Azure service metrics
View metrics on a dashboard
You can create your own dashboard for viewing Azure service metrics. For information on how to create dashboards, see Create and edit Dynatrace dashboards.
Available metrics
| Metric key | Name | Unit | Aggregations | Monitoring consumption |
|---|---|---|---|---|
| builtin:cloud | Total active connections | Count | autoavgmaxmin | DDUs |
| builtin:cloud | Server errors | Count | autovalue | DDUs |
| builtin:cloud | User errors | Count | autovalue | DDUs |
| builtin:cloud | Count of messages | Count | autoavgmaxmin | DDUs |
| builtin:cloud | Count of active messages | Count | autoavgmaxmin | DDUs |
| builtin:cloud | Count of dead-lettered messages | Count | autoavgmaxmin | DDUs |
| builtin:cloud | Count of scheduled messages | Count | autoavgmaxmin | DDUs |
| builtin:cloud | Incoming messages | Count | autovalue | DDUs |
| builtin:cloud | Outgoing messages | Count | autovalue | DDUs |
| builtin:cloud | Incoming requests | Count | autovalue | DDUs |
| builtin:cloud | Total successful requests | Count | autovalue | DDUs |
| builtin:cloud | Throttled requests | Count | autovalue | DDUs |
| builtin:cloud | Service bus premium namespace CPU usage metric | Percent (%) | autoavgmaxmin | DDUs |
| builtin:cloud | Service bus premium namespace memory usage metric | Percent (%) | autoavgmaxmin | DDUs |
| builtin:cloud | Service bus size | Byte | autoavgmaxmin | DDUs |
| builtin:cloud | Server errors | Count | autovalue | DDUs |
| builtin:cloud | User errors | Count | autovalue | DDUs |
| builtin:cloud | Count of messages in queue | Count | autoavgmaxmin | DDUs |
| builtin:cloud | Count of active messages in a queue | Count | autoavgmaxmin | DDUs |
| builtin:cloud | Count of dead-lettered messages in a queue | Count | autoavgmaxmin | DDUs |
| builtin:cloud | Count of scheduled messages in a queue | Count | autoavgmaxmin | DDUs |
| builtin:cloud | Incoming messages | Count | autovalue | DDUs |
| builtin:cloud | Outgoing messages | Count | autovalue | DDUs |
| builtin:cloud | Incoming requests | Count | autovalue | DDUs |
| builtin:cloud | Total successful requests | Count | autovalue | DDUs |
| builtin:cloud | Throttled requests | Count | autovalue | DDUs |
| builtin:cloud | Size of an queue | Byte | autoavgmaxmin | DDUs |
| builtin:cloud | Server errors | Count | autovalue | DDUs |
| builtin:cloud | User errors | Count | autovalue | DDUs |
| builtin:cloud | Count of messages in topic | Count | autoavgmaxmin | DDUs |
| builtin:cloud | Count of active messages in a topic | Count | autoavgmaxmin | DDUs |
| builtin:cloud | Count of dead-lettered messages in a topic | Count | autoavgmaxmin | DDUs |
| builtin:cloud | Count of scheduled messages in a topic | Count | autoavgmaxmin | DDUs |
| builtin:cloud | Incoming messages | Count | autovalue | DDUs |
| builtin:cloud | Outgoing messages | Count | autovalue | DDUs |
| builtin:cloud | Incoming requests | Count | autovalue | DDUs |
| builtin:cloud | Total successful requests | Count | autovalue | DDUs |
| builtin:cloud | Throttled requests | Count | autovalue | DDUs |
| builtin:cloud | Size of a topic | Byte | autoavgmaxmin | DDUs |