Azure Front Door Standard/Premium and CDN profiles monitoring
- Latest Dynatrace
- How-to guide
- 2-min read
- Published Jun 19, 2024
The Azure Front Door Standard/Premium, and CDN profiles overview pages give you visibility into the number of served client requests, latency, and the efficiency of your routing.
Prerequisites
- Dynatrace version 1.295+
- Environment ActiveGate version 1.195+
For information regarding the previous (classic) offering of Microsoft Azure Front Door, see Azure Front Door (classic) monitoring.
Enable monitoring
To learn how to enable service monitoring, see Enable service monitoring.
View service metrics
You can view the service metrics in your Dynatrace environment either on the custom device overview page or on your Dashboards page.
View metrics on the custom device overview page
To access the custom device overview page
- Go to
 Technologies & Processes Classic.
 - Filter by service name and select the relevant custom device group.
- Once you select the custom device group, you're on the custom device group overview page.
- The custom device group overview page lists all instances (custom devices) belonging to the group. Select an instance to view the custom device overview page.
View metrics on your dashboard
If the service has a preset dashboard, you'll get a preset dashboard for the respective service containing all recommended metrics on your Dashboards page. You can look for specific dashboards by filtering by Preset and then by Name.
For existing monitored services, you might need to resave your credentials for the preset dashboard to appear on the Dashboards page. To resave your credentials, go to Settings > Cloud and virtualization > Azure, select the desired Azure instance, then select Save.
You can't make changes on a preset dashboard directly, but you can clone and edit it. To clone a dashboard, open the browse menu (…) and select Clone.
To remove a dashboard from the dashboards list, you can hide it. To hide a dashboard, open the browse menu (…) and select Hide.
Hiding a dashboard doesn't affect other users.

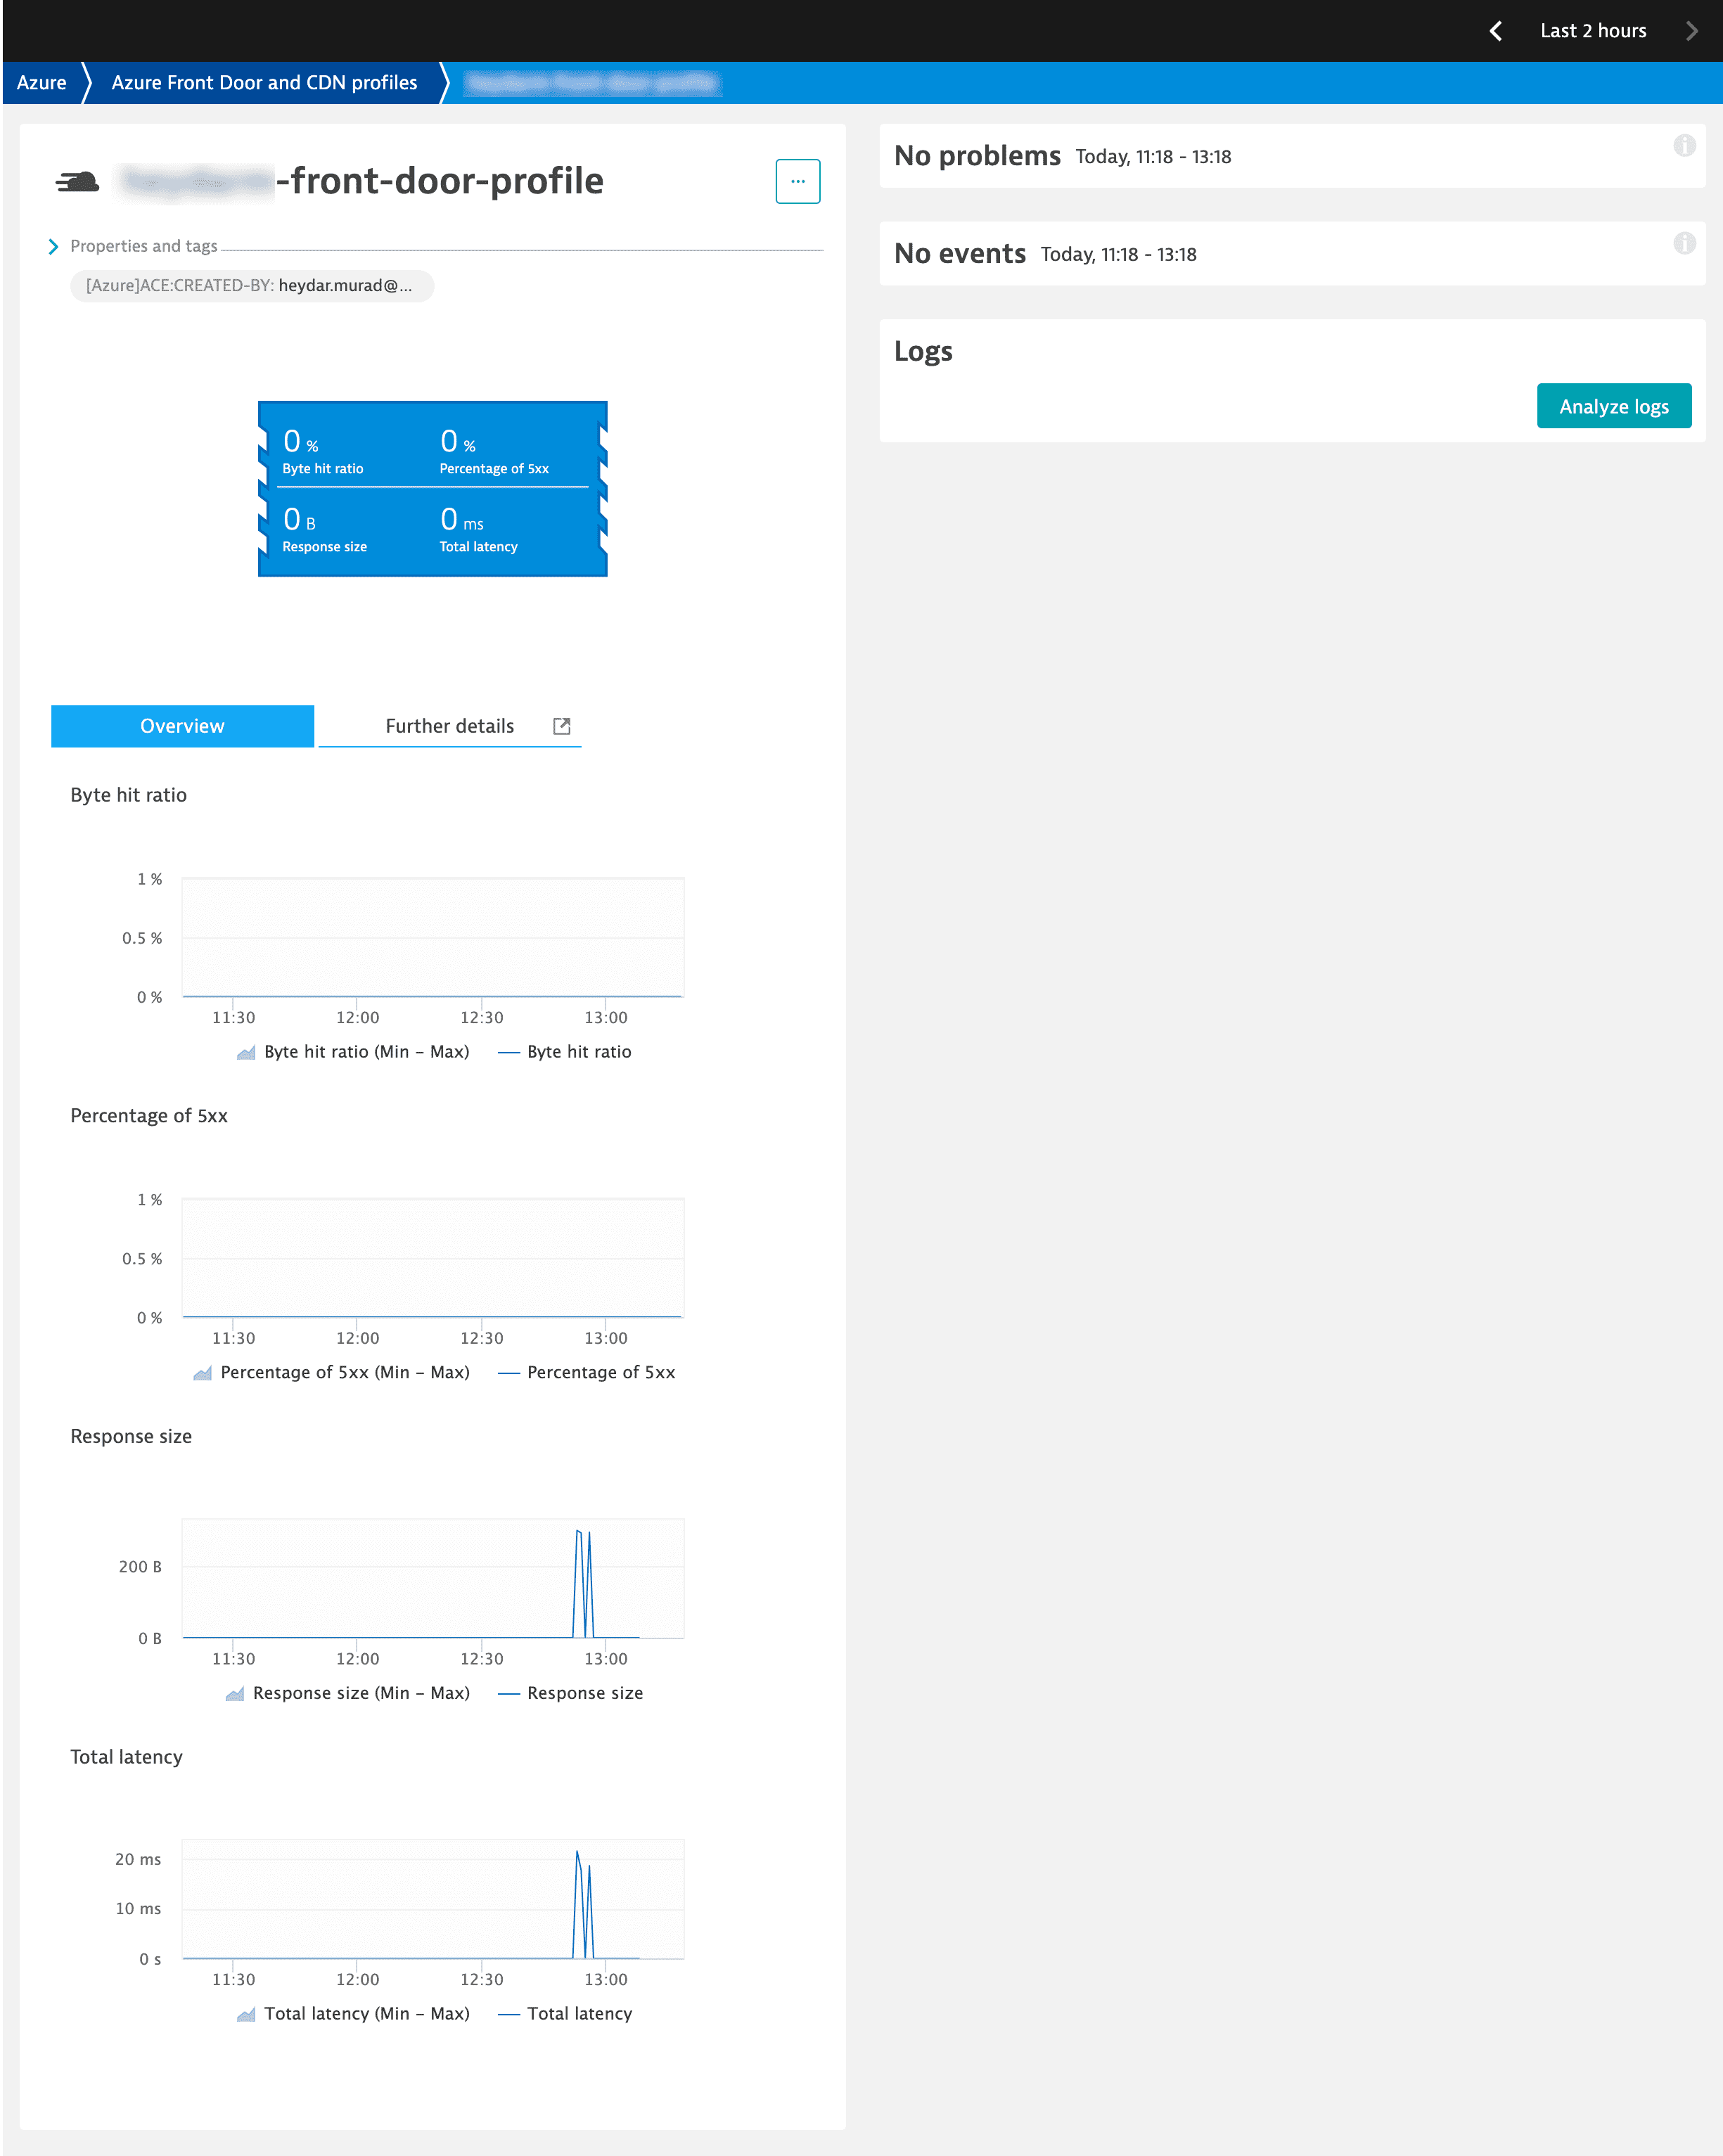
Azure Front Door Standard/Premium
Azure Front Door CDN profiles
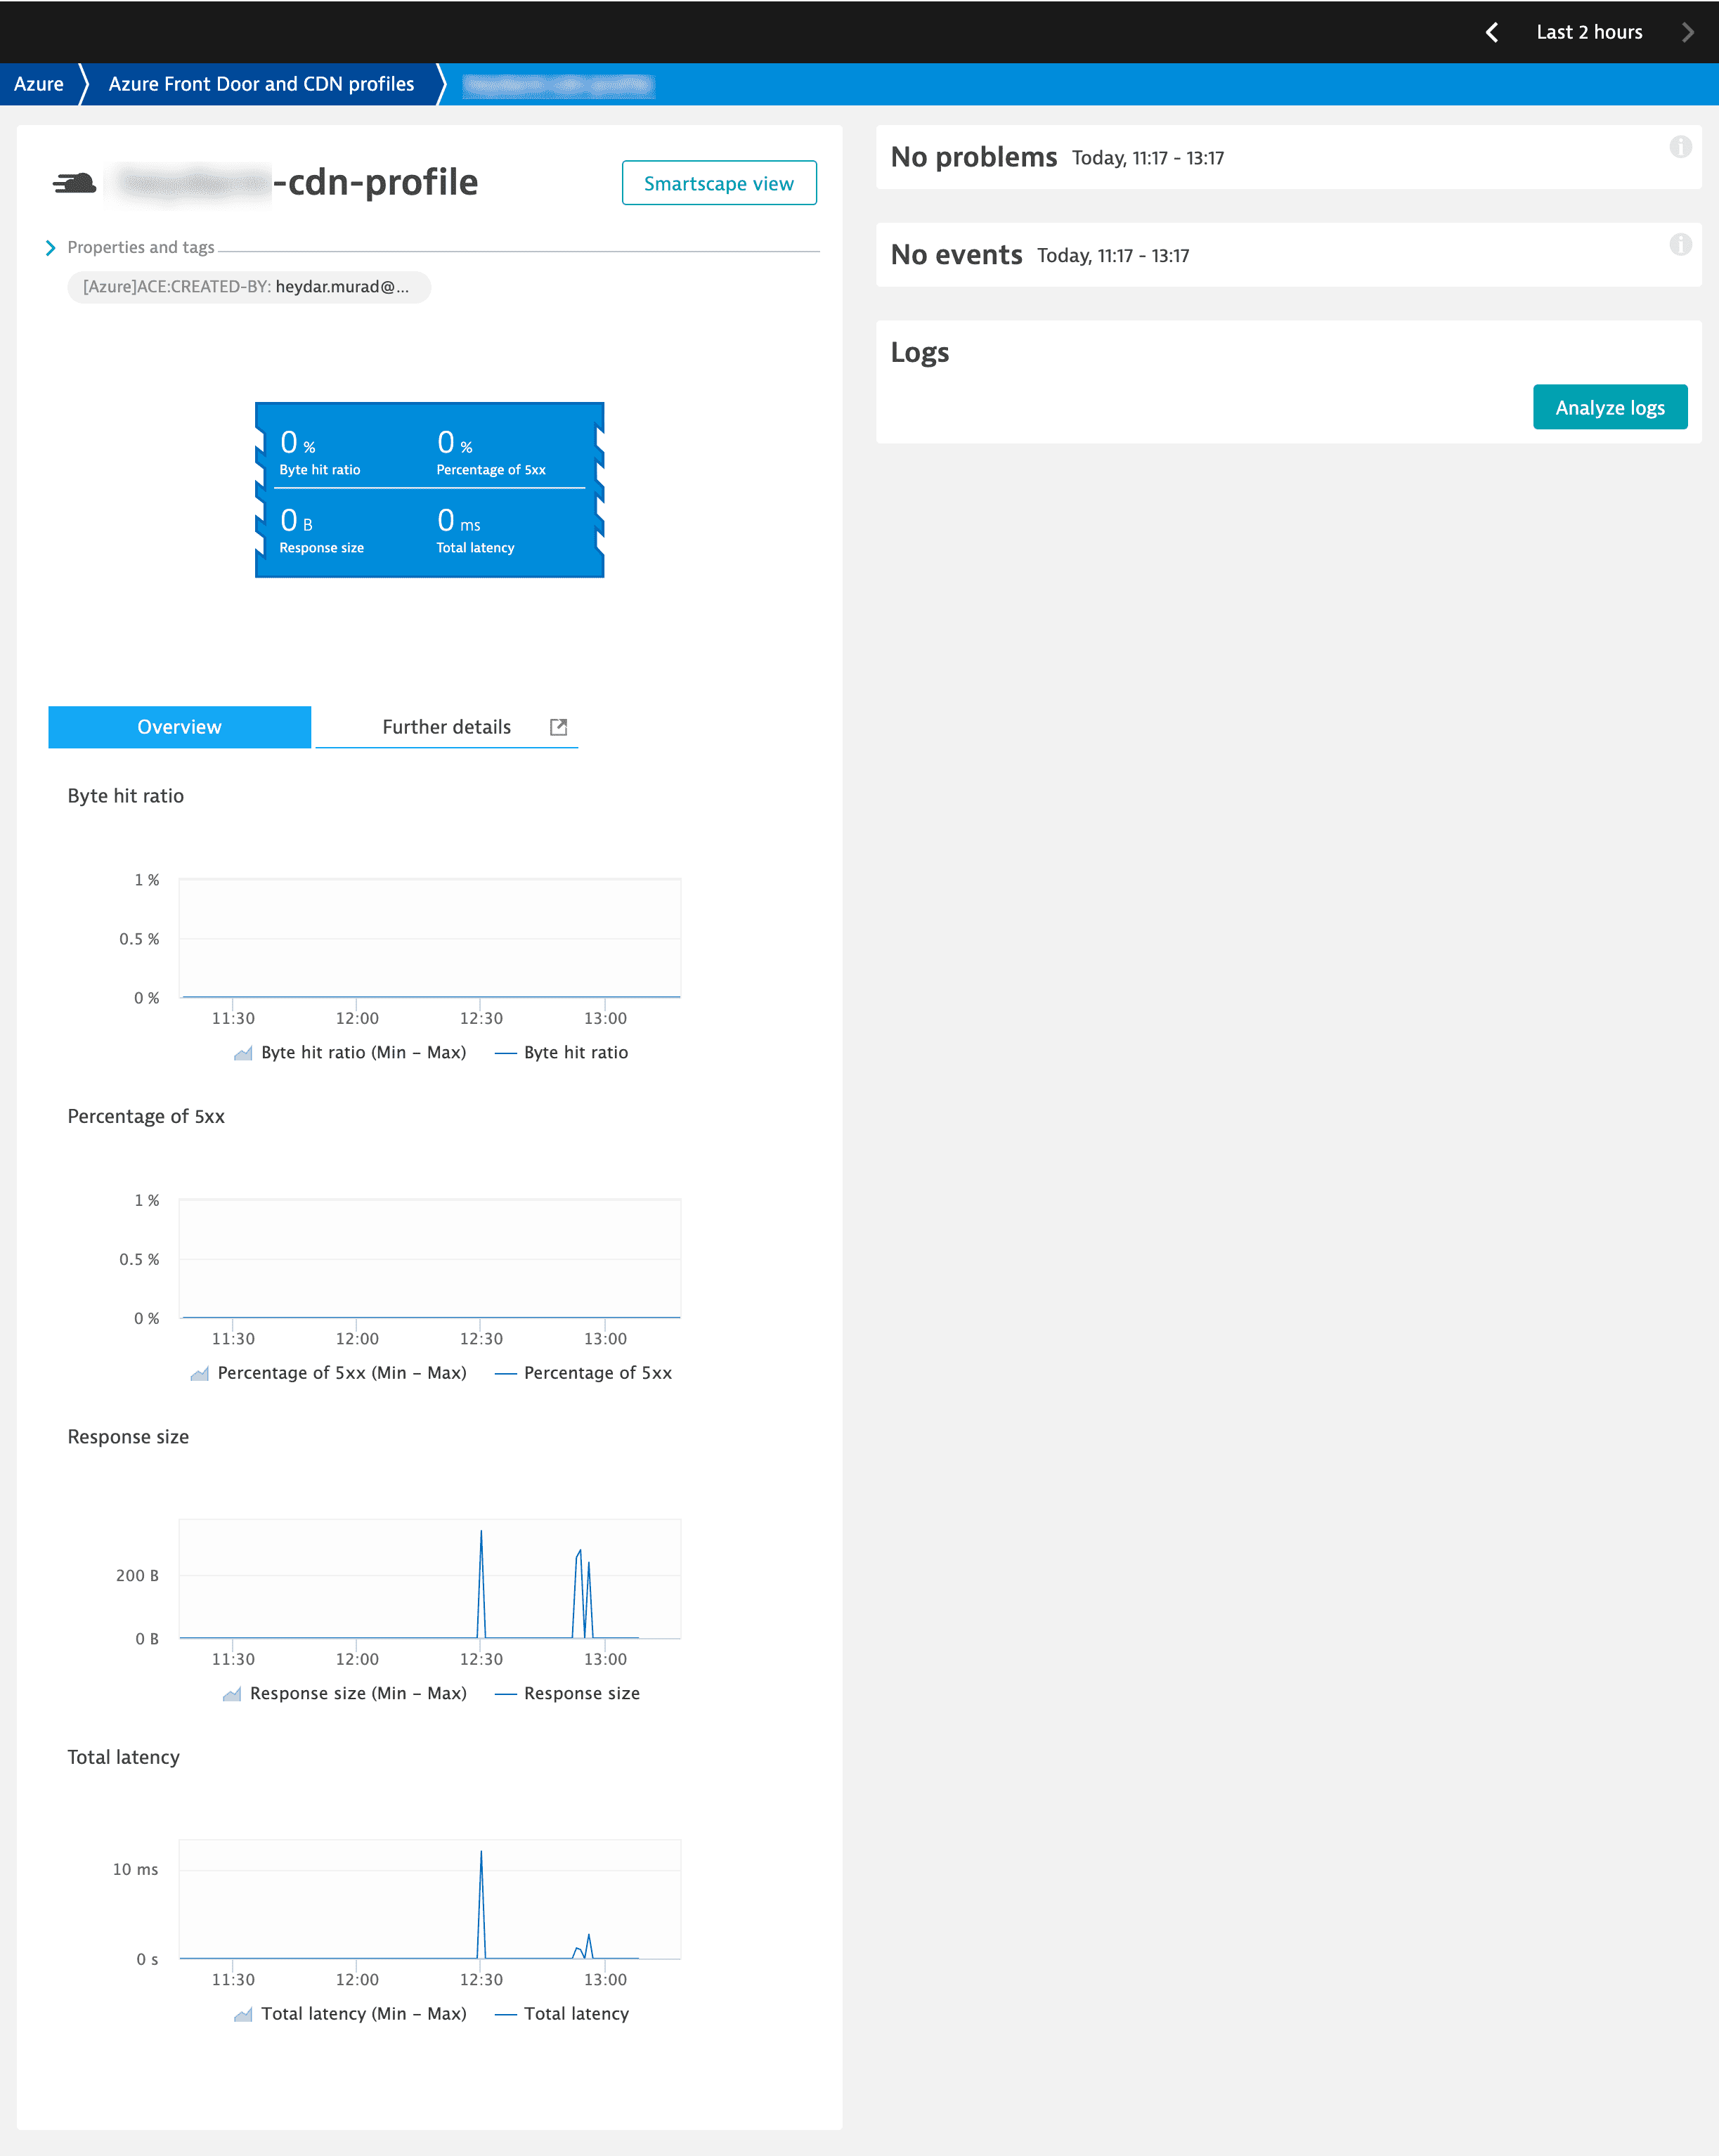
Available metrics
| Name | Description | Unit | Recommended |
|---|---|---|---|
| ByteHitRatio | This is the ratio of the total bytes served from the cache compared to the total response bytes | Percent | |
| OriginHealthPercentage | The percentage of successful health probes from AFDX to backends. | Percent | |
| OriginLatency | The time calculated from when the request was sent by AFDX edge to the backend until AFDX received the last response byte from the backend. | MilliSeconds | |
| OriginRequestCount | The number of requests sent from AFDX to origin. | Count | |
| Percentage4XX | The percentage of all the client requests for which the response status code is 4XX | Percent | |
| Percentage5XX | The percentage of all the client requests for which the response status code is 5XX | Percent | |
| RequestCount | The number of client requests served by the HTTP/S proxy | Count | |
| RequestSize | The number of bytes sent as requests from clients to AFDX. | Bytes | |
| ResponseSize | The number of bytes sent as responses from HTTP/S proxy to clients | Bytes | |
| TotalLatency | The time calculated from when the client request was received by the HTTP/S proxy until the client acknowledged the last response byte from the HTTP/S proxy | MilliSeconds | |
| WebApplicationFirewallRequestCount | The number of client requests processed by the Web Application Firewall | Count |