Extend traces using OpenTelemetry
- Latest Dynatrace
- 7-min read
OpenTelemetry is a collection of tools, APIs, and SDKs that enable you to use telemetry data (distributed traces, metrics, and logs) to get insights into your application's performance and behavior.
OpenTelemetry with the z/OS Java code module enables you to enrich or extend distributed traces.
- Enrich distributed traces with project-specific additions (for example, you can add business-relevant data to your traces or capture developer-specific diagnostics).
- Extend distributed traces (for example, you can capture a Java Transport that is not supported out of the box by Dynatrace or fill observability gaps between applications to achieve transactional insights).
OpenTelemetry metrics and logs are currently not supported by the z/OS Java code module.
- OpenTelemetry distributed traces captured by the z/OS Java code module are included in the mainframe license.
OpenTelemetry interoperability
OpenTelemetry version 1.0+
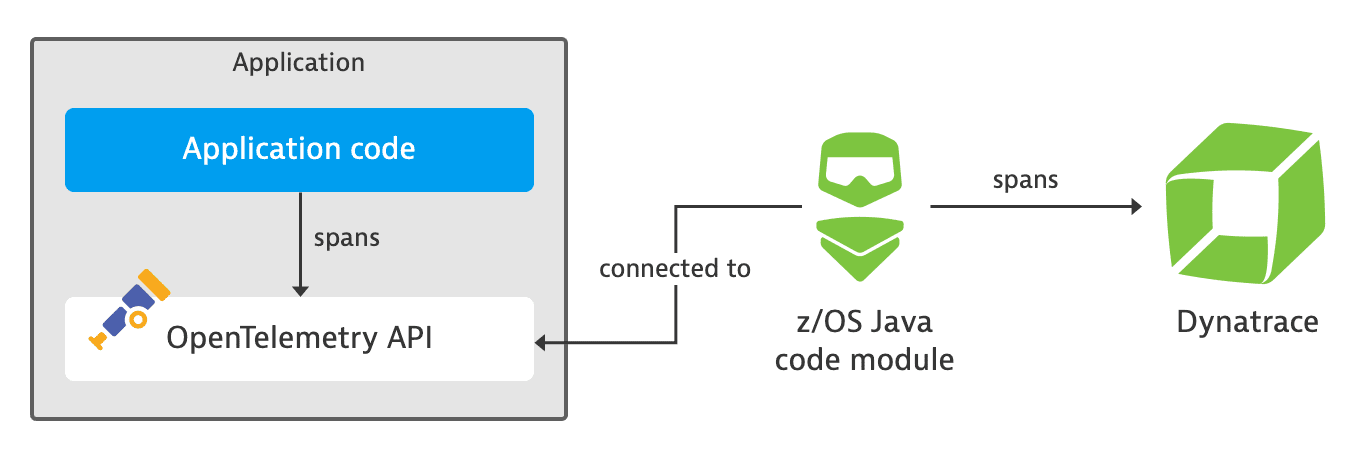
Enabling OpenTelemetry interoperability connects the z/OS Java code module to the OpenTelemetry API. When enabled, the code module redirects certain OpenTelemetry API usage (for example, GlobalOpenTelemetry) to the internal Dynatrace OpenTelemetry SDK.
The z/OS Java code module forwards the captured OpenTelemetry Spans, via the zDC subsystem and zRemote module, to your Dynatrace environment.
Recommendation: avoid using the OpenTelemetry SDK in your applications together with the Dynatrace OpenTelemetry interoperability because it could result in conflicts.
Enable OpenTelemetry interoperability
OpenTelemetry interoperability is disabled by default. To enable it, add the OpenTelemetry: EnableIntegration attribute to your dtconfig.json file as shown in the following example.
Typically, you've created the dtconfig.json file during the z/OS Java code module installation and have set the attributes Tenant, ClusterID, and zdcName to your environment.
{"OpenTelemetry": {"EnableIntegration": true}}
Alternatively, you can add the open-telemetry-enable-integration option to the JVM argument of the z/OS Java code module:
-javaagent:/PATH_TO/dynatrace-oneagent-zos-java.jar=open-telemetry-enable-integration=true
OpenTelemetry instrumentation samples
To support various use cases, OpenTelemetry enables you to add vendor-neutral custom instrumentation to your applications. Instrumenting applications with OpenTelemetry requires programming knowledge and access to the application’s code. To learn how to instrument your application, refer to OpenTelemetry documentation and OpenTelemetry Java documentation.
See the examples below for using OpenTelemetry Java.
Enrich traces with project-specific additions
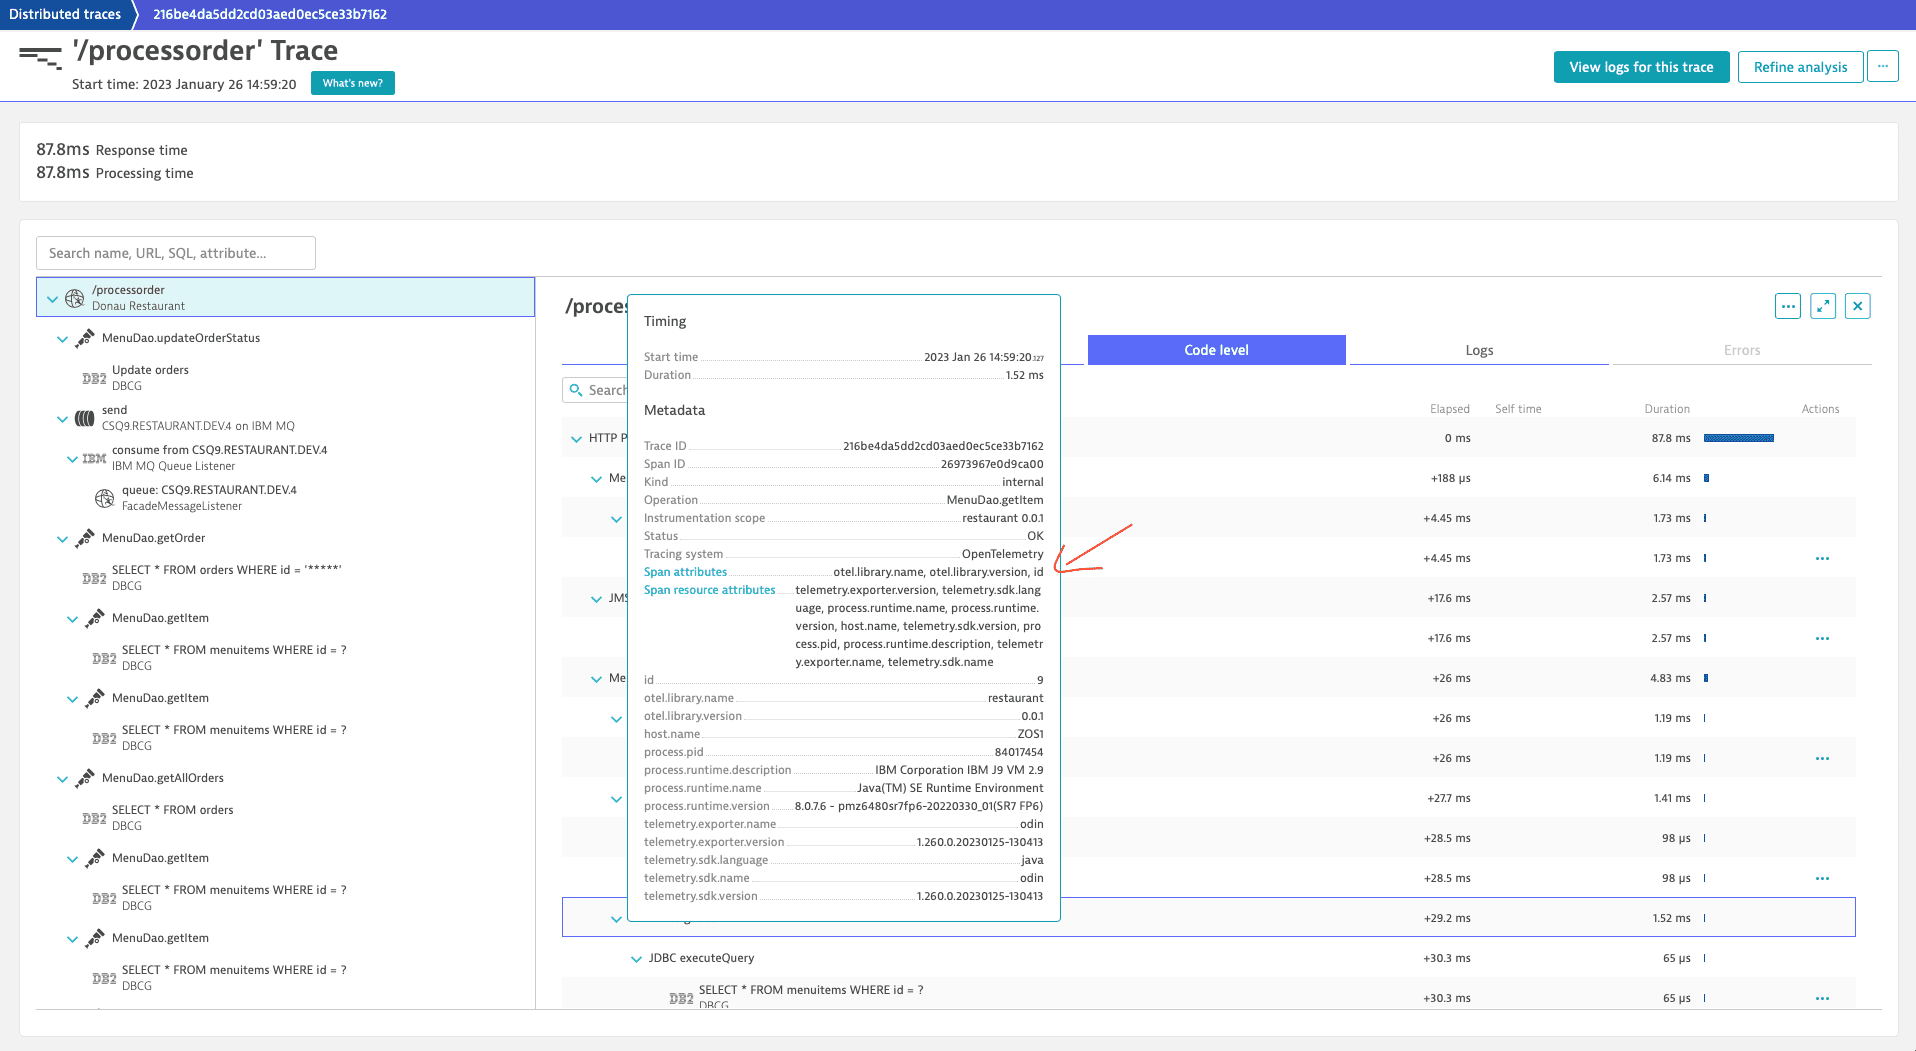
This example shows how you can capture an additional operation in a Java application running on a WebSphere Application Server monitored by Dynatrace.
- Define a
Tracer.import io.opentelemetry.api.GlobalOpenTelemetry;import io.opentelemetry.api.trace.Tracer;public final class RestaurantOpenTelemetry {public static Tracer getTracer() {return GlobalOpenTelemetry.getTracer("restaurant", "0.0.1");}} - Use the
Tracerto capture an operation including some attributes.import io.opentelemetry.api.trace.Span;import io.opentelemetry.api.trace.SpanKind;import io.opentelemetry.context.Scope;public class MenuDao {public Order newOrder(String customer) {// OpenTelemetry: create a span and define it's scopeSpan span = RestaurantOpenTelemetry.getTracer().spanBuilder("MenuDao.newOrder").setSpanKind(SpanKind.INTERNAL).setAttribute("customer", customer).startSpan();try (Scope scope = span.makeCurrent()) {// Your application code: create a new orderOrder order = new Order();order.setCustomer(customer);order.setStatus("pending");// OpenTelemetry: add order ID to the spanspan.setAttribute("newOrderId", order.getId());return order;} finally {// OpenTelemetry: close the spanspan.end();}}}
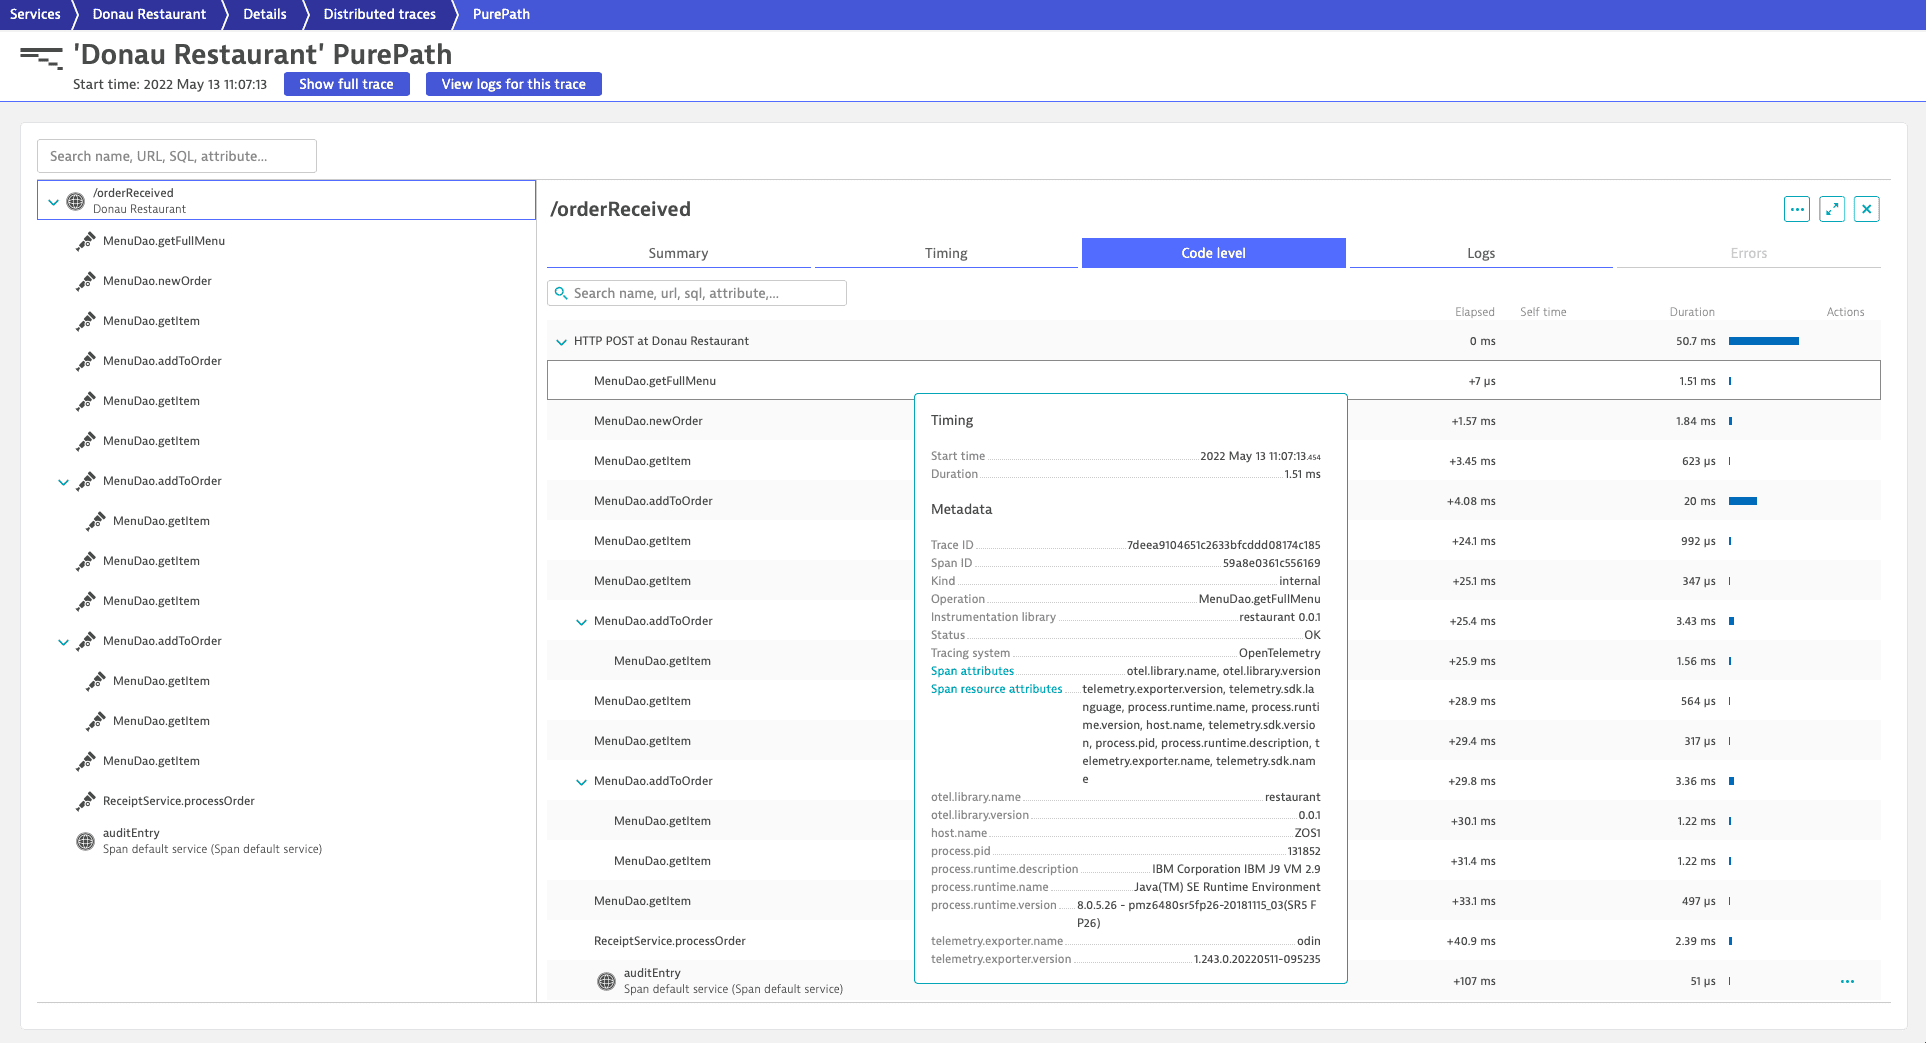
The MenuDao.newOrder operation is displayed as a span on the Code level tab in the Dynatrace web UI with the captured span attributes (customer, newOrderId) and measured execution time.
Extend end-to-end traces
This example shows how you can trace an audit service running on a WebSphere Application Server (monitored by Dynatrace) that uses a Java transport that is not supported out of the box. We use Java serialization (object output streams) as an example for such an unsupported Java transport.
To learn more about context propagation, refer to the official OpenTelemetry Context Propagation documentation.
Service A writes an audit entry to the ObjectOutputStream:
import io.opentelemetry.api.GlobalOpenTelemetry;import io.opentelemetry.context.Context;import io.opentelemetry.context.propagation.TextMapPropagator;public class AuditService {public static void sendAuditEntry(Order order) {// Your application code: declare an audit entryMap<String, String> auditEntry = new HashMap<>();auditEntry.put("name", order.getId().toString());auditEntry.put("description", order.getCustomer());// OpenTelemetry: Inject current context of audit entry and propagate itTextMapPropagator propagator = GlobalOpenTelemetry.getPropagators().getTextMapPropagator();propagator.inject(Context.current(),auditEntry,Map::put);// Your application code: write audit entry to objectOutputStream (Socket)Socket socket = new Socket(host, port);ObjectOutputStream objectOutputStream = new ObjectOutputStream(socket.getOutputStream())) {objectOutputStream.writeObject(auditEntry);}}
Service B reads an audit entry from the ObjectInputStream:
import io.opentelemetry.api.GlobalOpenTelemetry;import io.opentelemetry.api.trace.Span;import io.opentelemetry.api.trace.SpanKind;import io.opentelemetry.context.Context;import io.opentelemetry.context.Scope;import io.opentelemetry.context.propagation.TextMapGetter;public class AuditService {private static void receivedAuditEntry(Map<String, String> auditEntry) {// OpenTelemetry: declare the tracer, create a span and define it's scopeSpan span = GlobalOpenTelemetry.getTracer("auditing-center", "0.0.1").spanBuilder("auditEntry").setSpanKind(SpanKind.SERVER).setAttribute("auditName", auditEntry.get("name")).startSpan();try (Scope scope = span.makeCurrent()) {// Your application code: process audit entry// ...}span.end();}public static void readAuditEntryFromSocket(Socket socket) {ObjectInputStream objectInputStream = new ObjectInputStream(socket.getInputStream());Object input = objectInputStream.readObject();// OpenTelemetry: extract context of audit entryContext context = GlobalOpenTelemetry.getPropagators().getTextMapPropagator().extract(Context.current(),input,new TextMapGetter<Map<String, String>>(){ /* ... */ });try (Scope scope = context.makeCurrent()) {receivedAuditEntry((Map<String, String>) input);}// ...}}
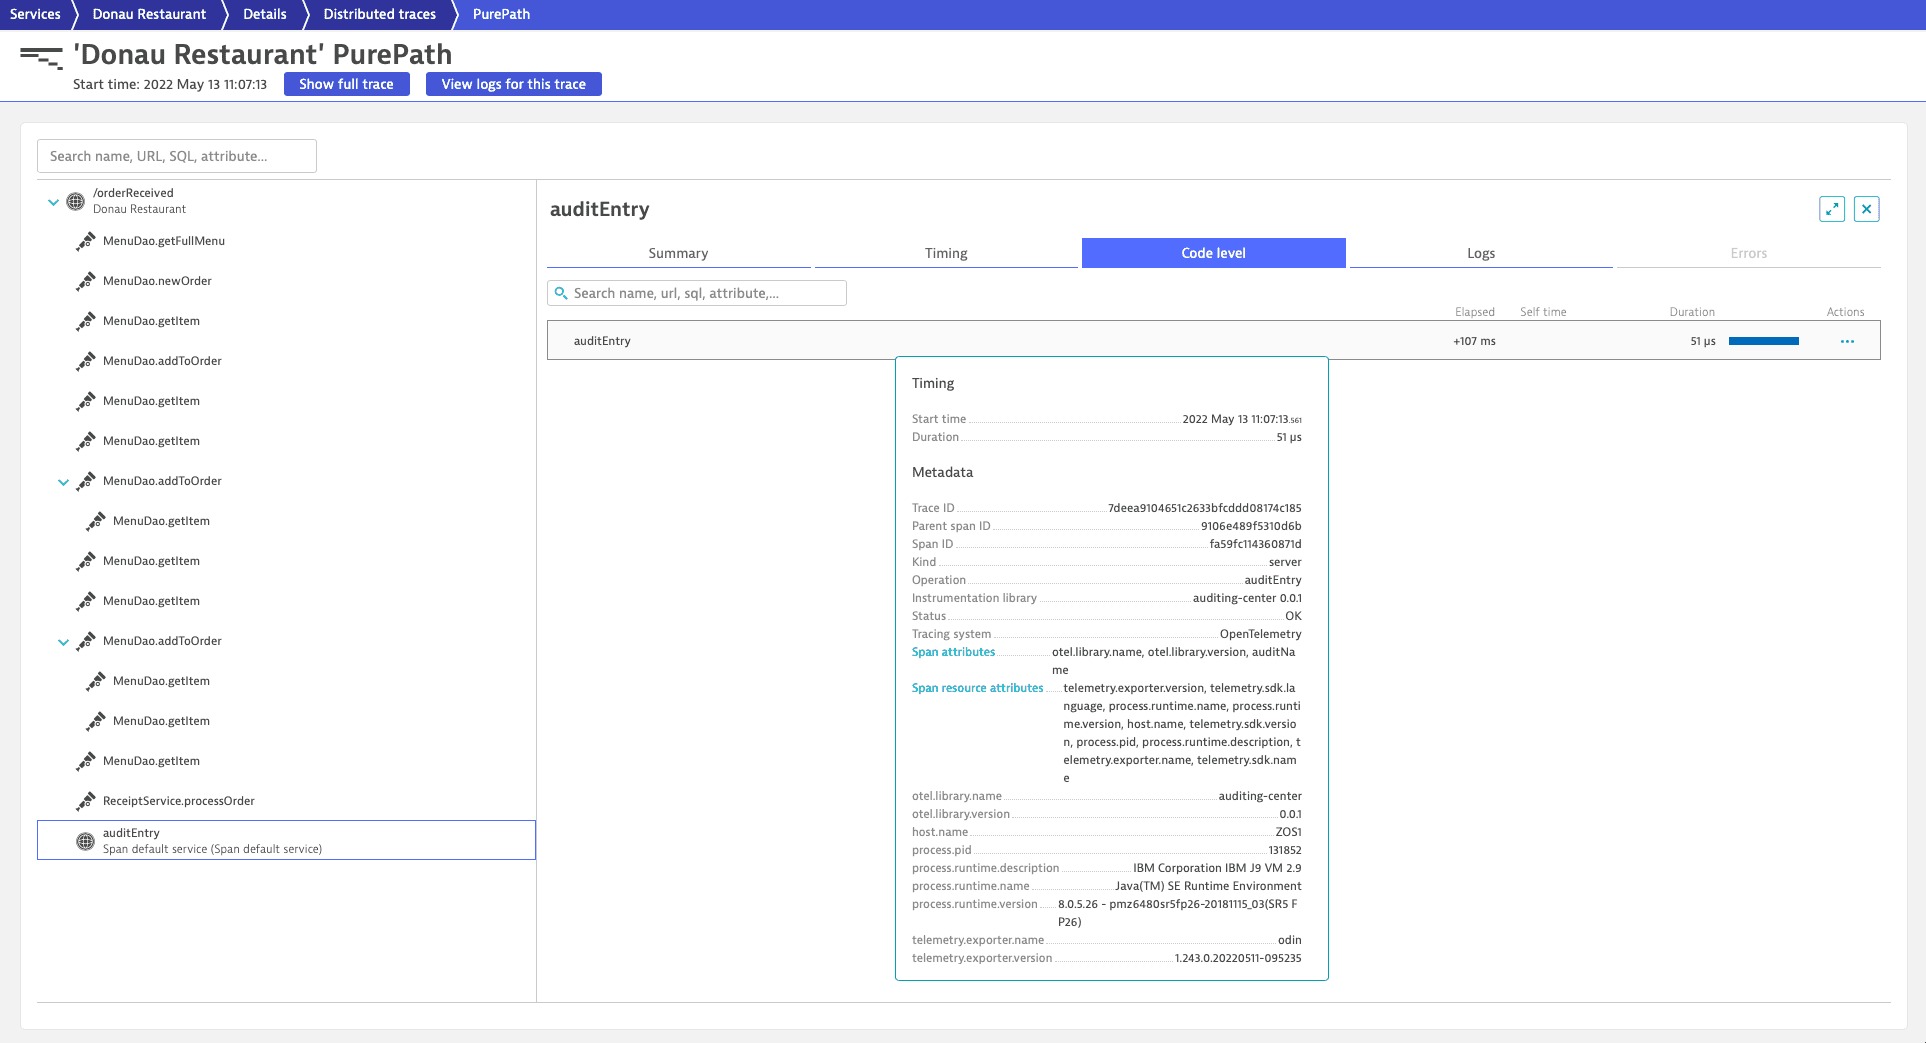
Dynatrace displays the full end-to-end trace as a distributed trace that contains the auditEntry as a service method which includes the captured attributes and measured execution time. The auditEntry service method is the result of the traced receivedAuditEntry method with its new span. The fact that it is displayed as a child of the /orderReceived service method is the result of the inject and extract calls of the TextMapPropagator.
Suppress spans from specific instrumentations
You can suppress spans coming from a particular instrumentation scope/library. To do so, add the library name to the OpenTelemetry: DisabledSensors parameter in name via the dtconfig.json file. You can use an asterisk (*) to exclude all instrumentation scope/library names starting with the preceding string. You can't use asterisk at the beginning or in the middle of a library name.
{"OpenTelemetry": {"EnableIntegration": true,"DisabledSensors": ["com.example.MyLib","opentelemetry.urllib3*"]}}
Alternatively, you can add the open-telemetry-disabled-sensors option to the JVM argument of the z/OS Java code module:
-javaagent:/PATH_TO/dynatrace-oneagent-zos-java.jar=open-telemetry-disabled-sensors=com.example.MyLib:opentelemetry.urllib3*
If you specify exclusions in the command line, the exclusions in the dtconfig.json file ignored.
Use colon : as the separator for instrumentation scope/library names in the command line.
The examples above suppress spans from the com.example.MyLib instrumentation scope/library and spans from all libraries starting with the name opentelemetry.urllib3.
Rules for spans that Dynatrace will report
Depending on the SpanKind, Dynatrace will suppress some OpenTelemetry spans:
- A span needs to either be of kind
SpanKind.SERVERorSpanKind.CONSUMERor it needs to have another span (SpanContext) as a non-remote parent. Usually, this is handled by the Dynatrace Servlet sensor, which creates aSERVERspan and sets it as the current, active span. - Child spans of spans of kind
SpanKind.CLIENTorSpanKind.PRODUCERwill be suppressed. For example, after Dynatrace creates a span of kindSpanKind.CLIENTfor a synchronous outgoing HTTP call, all spans created in the thread will be suppressed until the HTTP call, and thus the HTTP Span, is finished. You can of course create new spans in the called service which will be linked correctly.
Suppressed spans will not be visible in distributed traces.
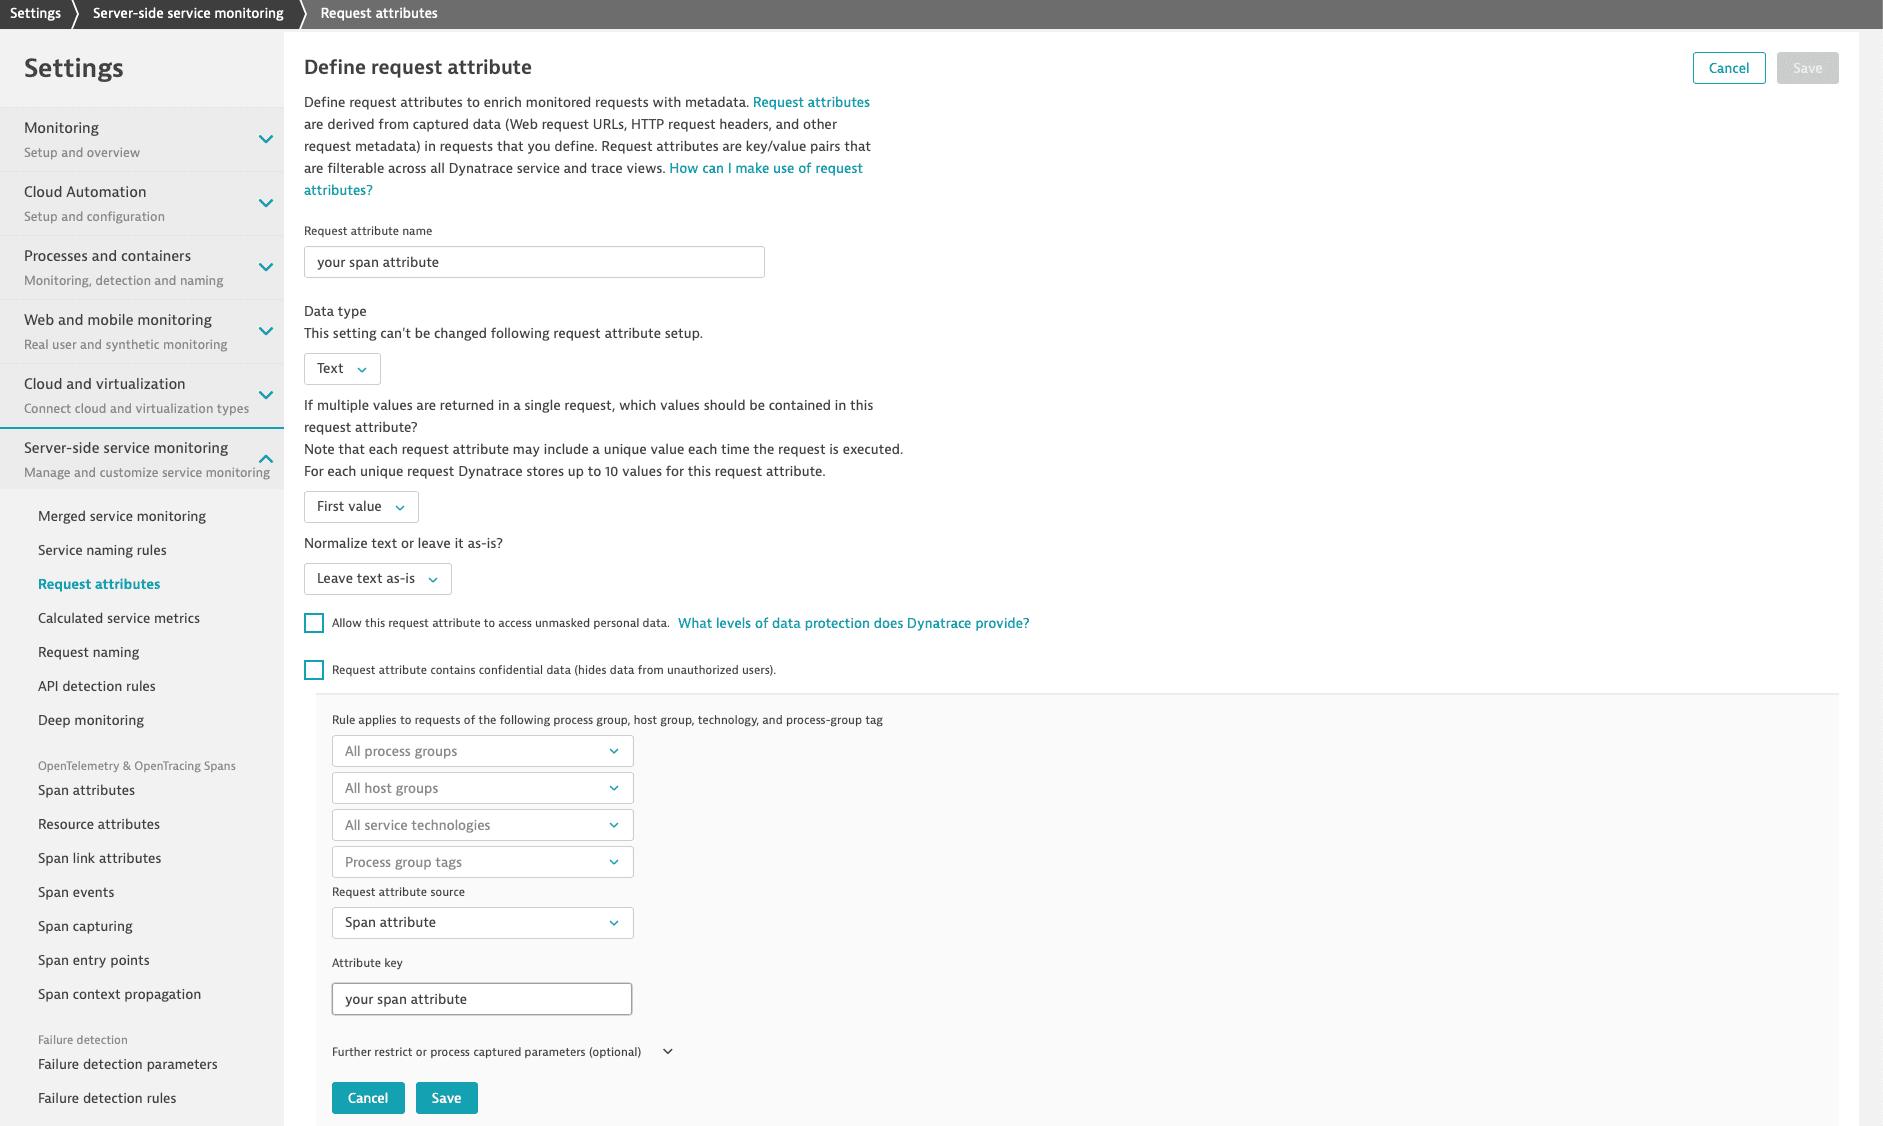
Define a request attribute for span attributes
You can define a request attribute for any captured span attribute. To do so
- Go to Settings > Server-side service monitoring > Request attributes.
- Select Define a new request attribute and enter the name and data type of your request attribute.
- Select Add new data source and select
Span attributeas the Request attribute source. - Enter your Attribute key.
- Select Save.
To learn more details about span attributes and how to capture them, see Span settings.
You can find the Attribute key of your spans on the Distributed traces page in the Code level tab under Span attributes.
