What is a monitoring environment?
- Latest Dynatrace
- 4-min read
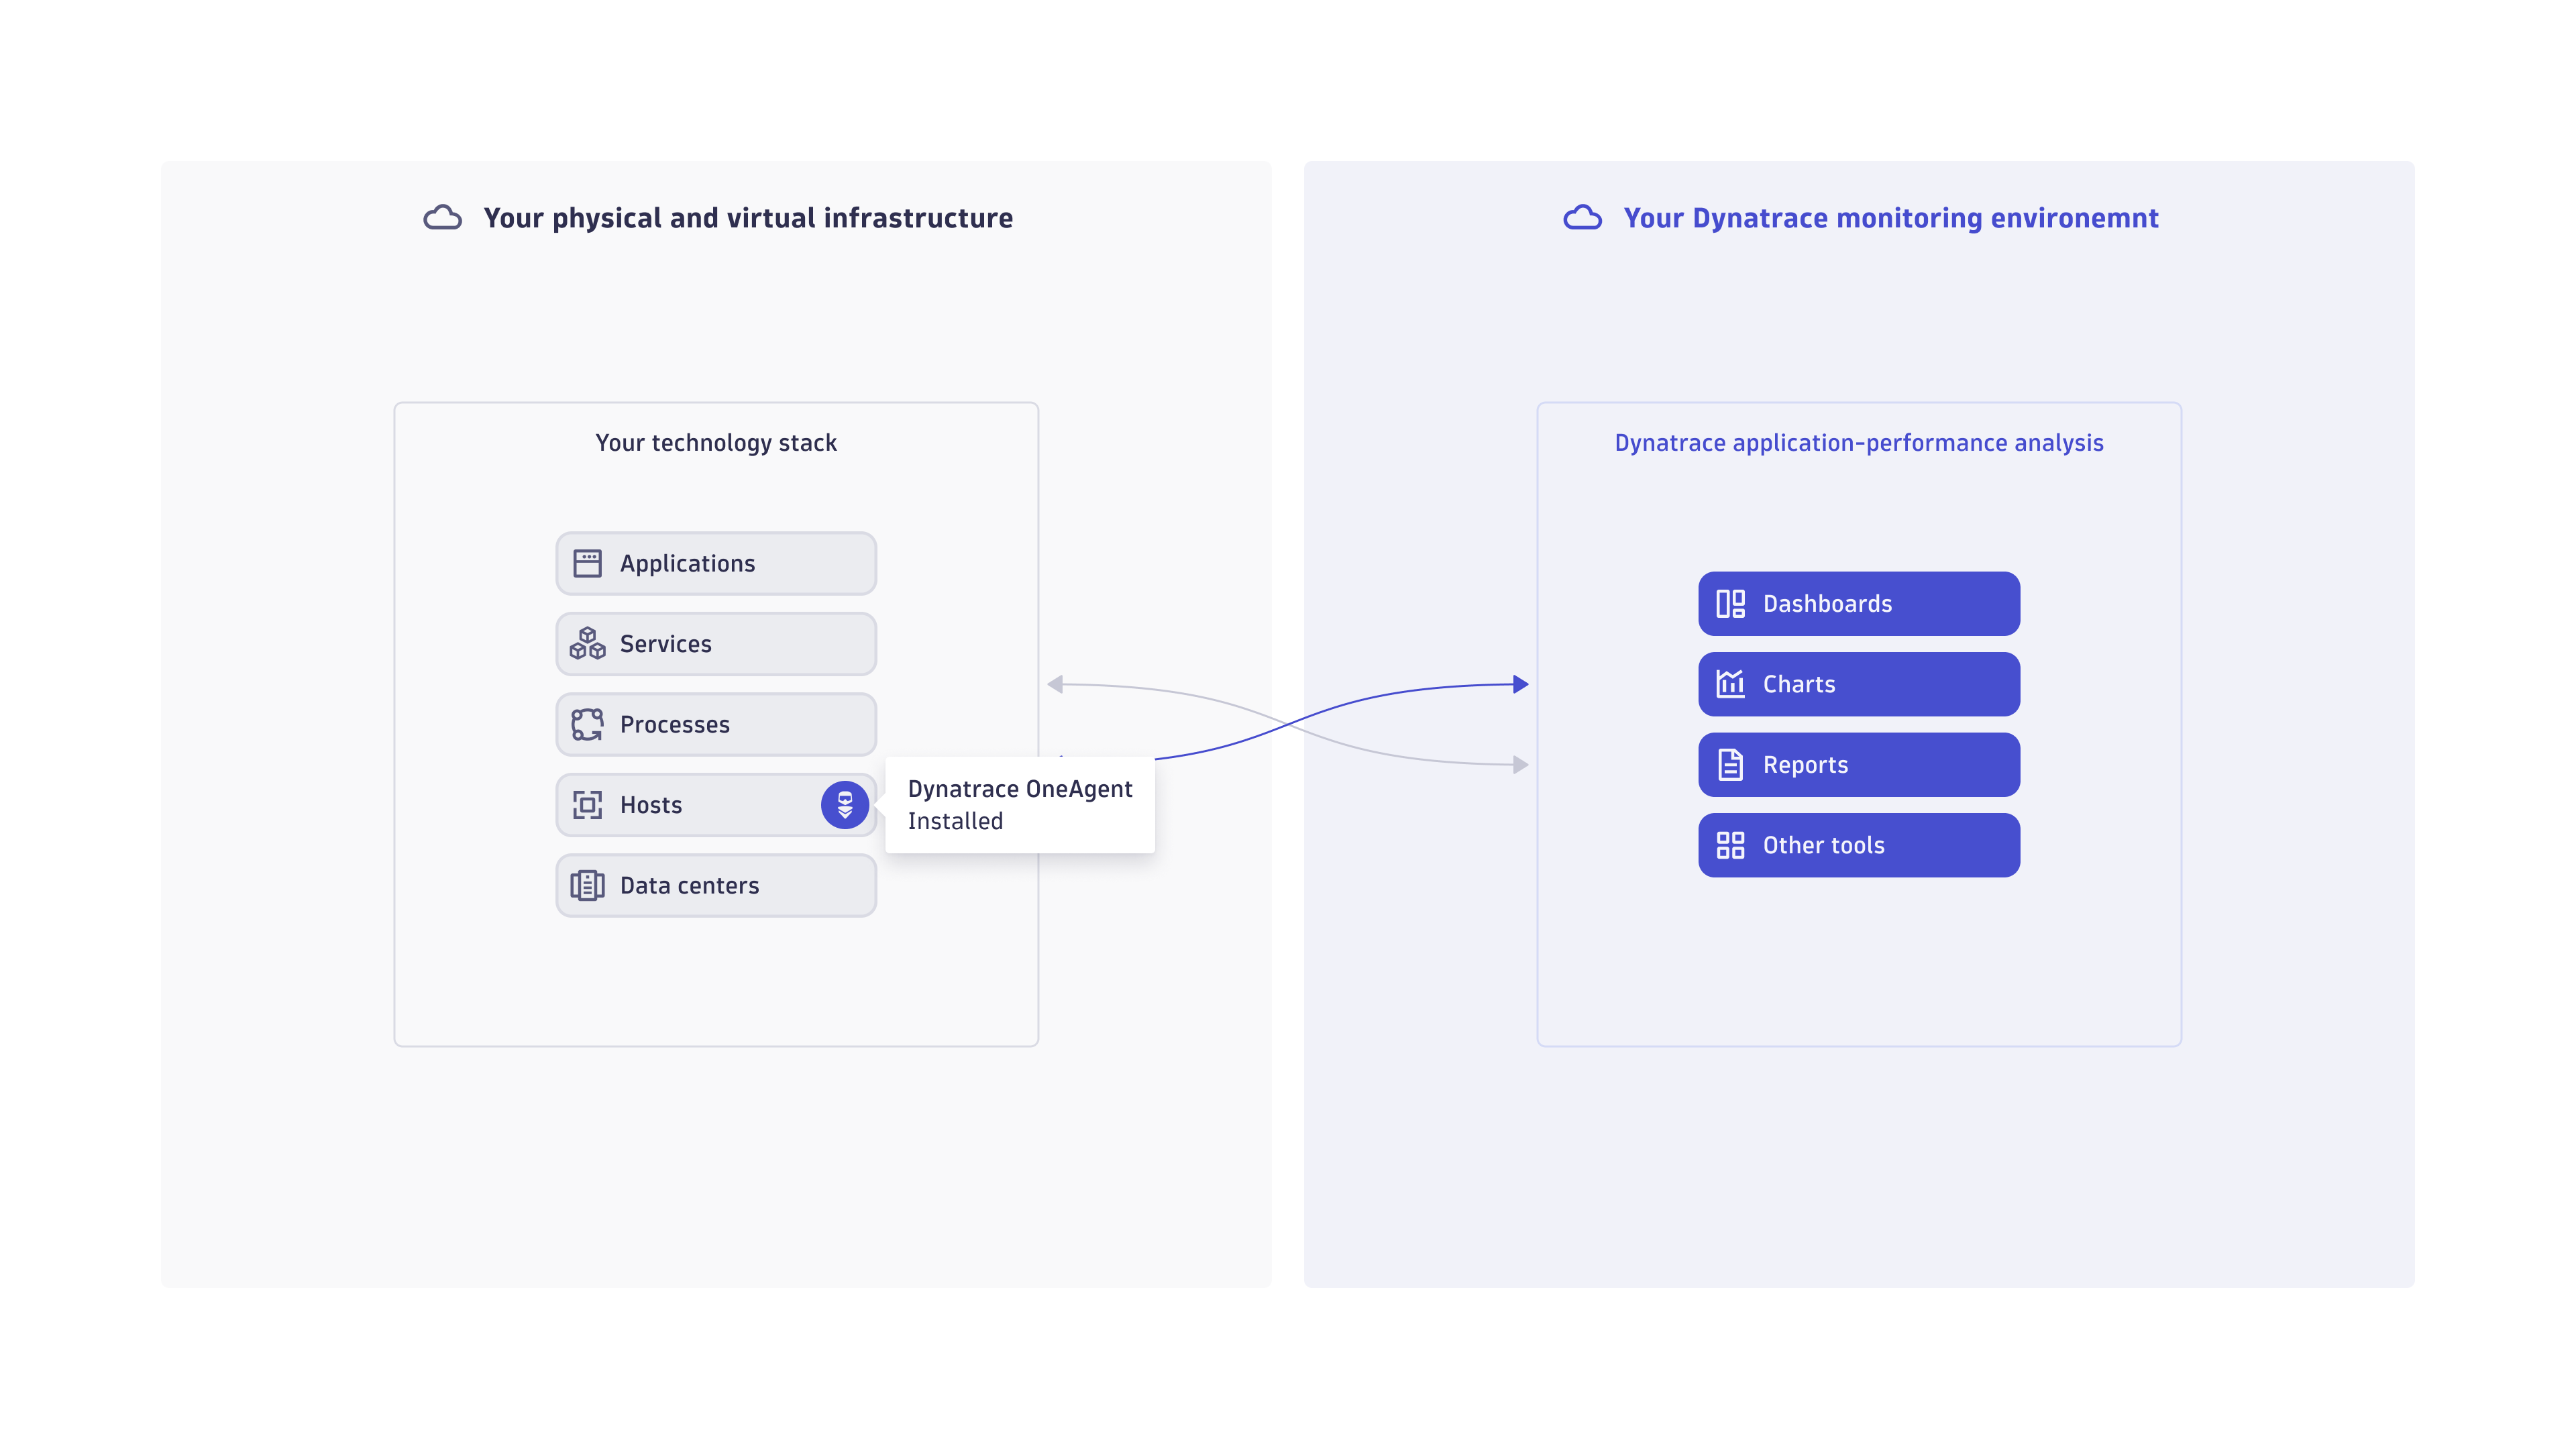
Your Dynatrace monitoring environment is where all your Dynatrace performance analysis takes place. Dynatrace OneAgent sends all captured monitoring data to your monitoring environment for analysis. A monitoring environment is analogous to an analysis server that provides all Dynatrace application-performance analysis functionality, including all dashboards, charts, reports and other tools.

Monitoring environment location
Your monitoring environment location depends on your deployment type.
| Deployment type | Monitoring environment location |
|---|---|
Standard SaaS | In the Dynatrace cloud |
On-premises | In your own data center |
Dynatrace for Government | In the cloud with FedRAMP moderate authorization |
Environment ID
All external access to your Dynatrace monitoring environment relies on two credential types: an environment ID and an access token.
Each environment that you monitor with Dynatrace is identified with a unique character string—the environment ID. The Dynatrace API relies heavily on environment IDs to ensure that it pulls monitoring data from and pushes relevant external events to the correct Dynatrace environments.
Your environment ID is the first part of your Dynatrace environment's URL:
https://{your-environment-id}.live.dynatrace.com/
For example, for the Dynatrace environment https://abc123a.dynatrace.com, the environment ID is abc123a.
You can also find your environment ID in Account Management.
- Go to Account Management. If you have more than one account, select the account you want to manage.
- Select Settings > Environments. You can find the environment ID in the Environment column.
Multiple monitoring environments
You can set up and monitor separate Dynatrace monitoring environments with a single Dynatrace account.
When you set up multiple monitoring environments:
- Each monitoring environment shares the same user base and other account settings.
- The data collected from each monitoring environment is kept separate.
- It's easy to switch between monitoring views for separate environments to track the performance and availability of each environment.
Use cases
There are several reasons people choose to create separate monitoring environments.
For example:
- You may want to monitor your organization's development, staging, and production environments separately.
- You may want to maintain a separate monitoring environment for each of your organization's data centers.
Set up multiple monitoring environments
How you set up different monitoring environments depends on whether you use Dynatrace SaaS, Dynatrace Managed, or Dynatrace for Government.
| Deployment type | How set up different monitoring environments |
|---|---|
SaaS | Contact a Dynatrace product expert via live chat within your Dynatrace environment; the product expert will make sure you get the assistance you need. |
Managed | You can use the Cluster Management Console. For details, see Managed - managed-monitoring-environment. |
Dynatrace for Government | Contact your Dynatrace representative. |
Connect my multiple environments
With multiple environments, monitoring data is strictly separated by design. Environments do not automatically receive information one from another.
In some scenarios, however, you might need to connect your environments. For example:
- To trace calls between services monitored in different Dynatrace environments, you can configure cross-environment tracing. For details, see Set up cross-environment tracing.
- To display metrics from remote environments on your local environment's dashboards, you can set up cross-environment dashboard tiles. For details, see Create remote/multi-environment Dynatrace dashboards.