Instrument your Ruby application with OpenTelemetry
- Latest Dynatrace
- How-to guide
- 4-min read
This walkthrough shows how to add observability to your Ruby application using the OpenTelemetry Ruby libraries and tools.
| Feature | Supported |
|---|---|
| Automatic instrumentation | Yes |
| Traces | Yes |
| Metrics | No |
| Logs | No |
Prerequisites
- Dynatrace version 1.222+
- For tracing, W3C Trace Context is enabled
- Go to Settings > Preferences > OneAgent features.
- Turn on Send W3C Trace Context HTTP headers.
 Get the Dynatrace access details
Determine the API base URL
For details on how to assemble the base OTLP endpoint URL, see Dynatrace OTLP API endpoints. The URL should end in /api/v2/otlp.
Get API access token
The access token for ingesting traces, logs, and metrics can be generated under Access Tokens.
Dynatrace OTLP API endpoints has more details on the format and the necessary access scopes.
 Choose how you want to instrument your application
OpenTelemetry supports on Ruby automatic and manual instrumentation, or a combination of both.
It's a good idea to start with automatic instrumentation and add manual instrumentation if the automatic approach doesn't work or doesn't provide enough information.
 Initialize OpenTelementry
-
Add the following dependencies to your Gemfile.
gem 'opentelemetry-sdk'gem 'opentelemetry-exporter-otlp' -
Add the following
requiredeclaration.require 'opentelemetry/sdk'require 'opentelemetry/exporter/otlp' -
Add the
init_opentelemetryfunction to startup code and provide the variablesDT_API_URLandDT_API_TOKENwith the values for the Dynatrace URL and access token.DT_API_URL = ENV['DT_API_URL']DT_API_TOKEN = ENV['DT_API_TOKEN']def init_opentelemetryOpenTelemetry::SDK.configure do |c|c.service_name = 'ruby-quickstart' #TODO Replace with the name of your applicationc.service_version = '1.0.1' #TODO Replace with the version of your application# TODO: add automatic instrumentation here (step 3 - optional)for name in ["dt_metadata_e617c525669e072eebe3d0f08212e8f2.properties", "/var/lib/dynatrace/enrichment/dt_metadata.properties", "/var/lib/dynatrace/enrichment/dt_host_metadata.properties"] dobeginc.resource = OpenTelemetry::SDK::Resources::Resource.create(Hash[*File.read(name.start_with?("/var") ? name : File.read(name)).split(/[=\n]+/)])rescueendendc.add_span_processor(OpenTelemetry::SDK::Trace::Export::BatchSpanProcessor.new(OpenTelemetry::Exporter::OTLP::Exporter.new(endpoint: DT_API_URL + "/v1/traces",headers: {"Authorization": "Api-Token " + DT_API_TOKEN})))endendThe file read operations, parsing the
dt_metadatafiles in the example code, attempt to read the OneAgent data files to enrich the OTLP request and ensure that all relevant topology information is available within Dynatrace.Exporting to OneAgentThe Ruby SDK uses content compression by default, which is not supported by OneAgent yet.
When exporting to OneAgent, add
compression: "none"to theExporter.new()call to disable that feature. Otherwise, export to ActiveGate instead. -
Call
init_opentelemetryas early as possible during the startup of your application to ensure OpenTelemetry is initialized right from the start.
 Automatically instrument your application Optional
-
Add the following dependency to your Gemfile.
gem 'opentelemetry-instrumentation-all' -
Add the following
requiredeclaration.require 'opentelemetry/instrumentation/all' -
Add the following line after
c.service_versionin theinit_opentelemetryfunction.c.use_all
 Manually instrument your application Optional
Add tracing
-
To create new spans, we first need a tracer object.
tracer = OpenTelemetry.tracer_provider.tracer('my-tracer') -
With
tracer, we can now usestart_span()to create and start new spans.span = tracer.start_span("Call to /myendpoint", kind: :internal)OpenTelemetry::Trace.with_span(span) do |span, context|span.set_attribute("http.method", "GET")span.set_attribute("net.protocol.version", "1.1")# TODO your code goes hereendrescue Exception => espan&.record_exception(e)span&.status = OpenTelemetry::Trace::Status.error("Unhandled exception of type: #{e.class}")raise eensurespan&.finishIn the above code, we:
- Create a new span and name it "Call to /myendpoint"
- Add two attributes, following the semantic naming convention, specific to the action of this span: information on the HTTP method and version
- Add a
TODOin place of the eventual business logic - Call the span's
finish()method to complete the span (in anensureblock to ensure the method is called)
Process logs with technology bundle parsers
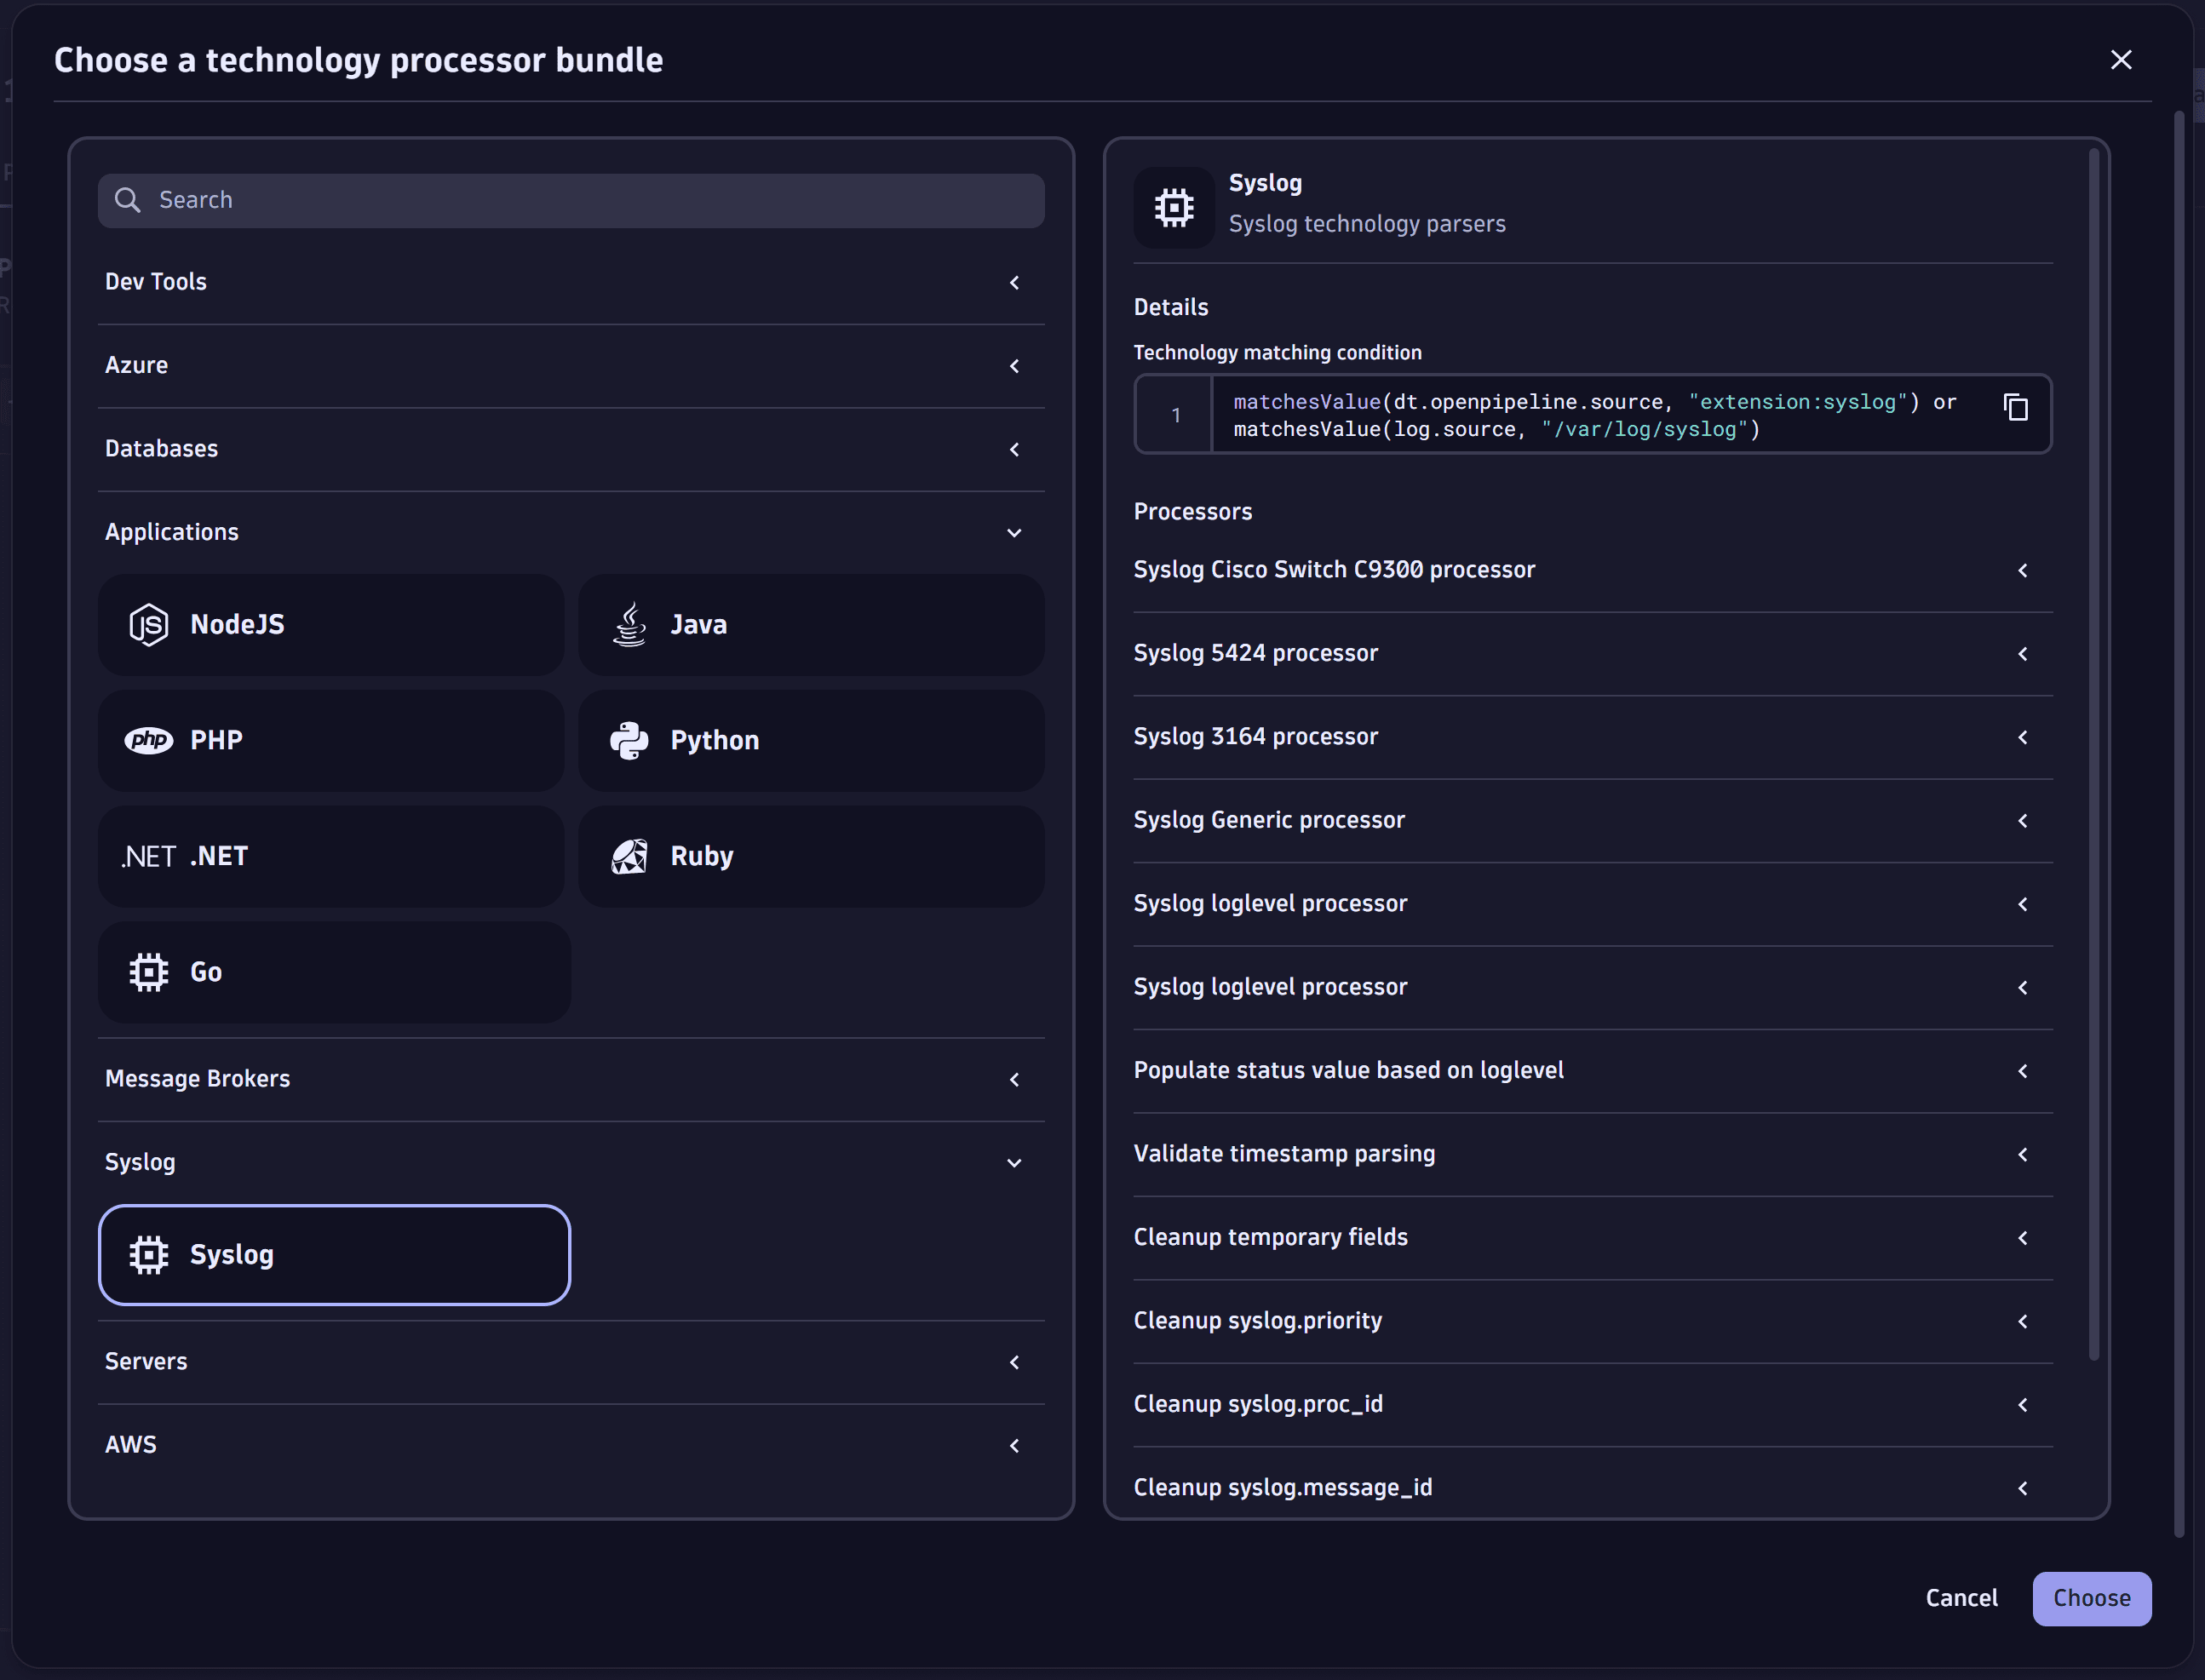
Through OpenPipeline, you can use and configure technology bundles. A technology bundle is a library of parsers (processing rules) that process logs from various technologies, such as Java, .NET, and Microsoft IIS.
Parsers help you to improve filtering, troubleshooting, metrics, alerts, and dashboards by efficiently extracting log levels and relevant attributes. You can also use technology bundles to structure logs from technologies that are not supported by Dynatrace out of the box.

For more information, see Process logs with technology bundle parsers.
Collect metrics
No example yet, as OpenTelemetry for Ruby does not have stable support for metrics yet.
Connect logs
No example yet, as OpenTelemetry for Ruby does not have stable support for logs yet.
Depending on the status of the OpenTelemetry SDK, the pre-release version may nonetheless already allow the ingestion of your logs.
Ensure context propagation Optional
Context propagation is particularly important when network calls (for example, REST) are involved.
If you are using automatic instrumentation and your networking libraries are covered by automatic instrumentation, this will be automatically taken care of by the instrumentation libraries. Otherwise, your code needs to take this into account.
Extracting the context when receiving a request
The following example uses the default propagator's extract() method to extract and recreate the context from the request, in parent_context. We can then pass that context to a start_span call to continue the previous trace with our spans.
parent_context = OpenTelemetry.propagation.extract(env,getter: OpenTelemetry::Common::Propagation.rack_env_getter)span = tracer.start_span("hello world", with_parent: parent_context)OpenTelemetry::Trace.with_span(span) do |span, context|span.set_attribute("my-key-1", "my-value-1")# ... expansive queryendensurespan&.finishend
Injecting the context when sending requests
The following example uses Ruby's standard Net:HTTP library to call an instrumented third-party service. To add the necessary trace headers, we use the default propagator's inject() method.
request = Net::HTTP::Get.new(uri.request_uri)OpenTelemetry.propagation.inject(request)response = http.request(request)
 Configure data capture to meet privacy requirements Optional
While Dynatrace automatically captures all OpenTelemetry attributes, only attribute values specified in the allowlist are stored and displayed in the Dynatrace web UI. This prevents accidental storage of personal data, so you can meet your privacy requirements and control the amount of monitoring data stored.
To view your custom attributes, you need to allow them in the Dynatrace web UI first. To learn how to configure attribute storage and masking, see Attribute redaction.
 Verify data ingestion into Dynatrace
Once you have finished the instrumentation of your application, perform a couple of test actions to create and send demo traces, metrics, and logs and verify that they were correctly ingested into Dynatrace.
To do that for traces, go to Distributed Tracing (previous Dynatrace) or 
For metrics and logs, go to Metrics or Logs (previous Dynatrace) or  Logs & Events Classic.