WMI tutorial - metric metadata
- Latest Dynatrace
- How-to guide
- 1-min read
- Published Mar 30, 2022
With just the data source present in the extension, metric collection is rather raw: all metrics are referenced by key and everything appears without any measurement unit, which can make it confusing.
The metrics section of the extension is there to define additional metadata for metrics. We can define the following:
displayName- Human-readable name of metricdescription- A description of what this metric actually representsunit- Measurement unit of the metrictags- How we can easily find this metric in the Metrics catalogmetricPropertiesminValue- The minimum possible value for the metricmaxValue- The maximum possible value for the metricimpactRelevant- Whether this metric depends on other metric anomalies to form the root cause of a ProblemrootCauseRelevant- Whether this metric on its own can be the root cause of a ProblemvalueType- Whether high values are good (score) or bad (error)
Define metadata
- Add the
metricssection to yourextension.yamlusing the template below. - Define metadata for every metric collected.
- At minimum, define
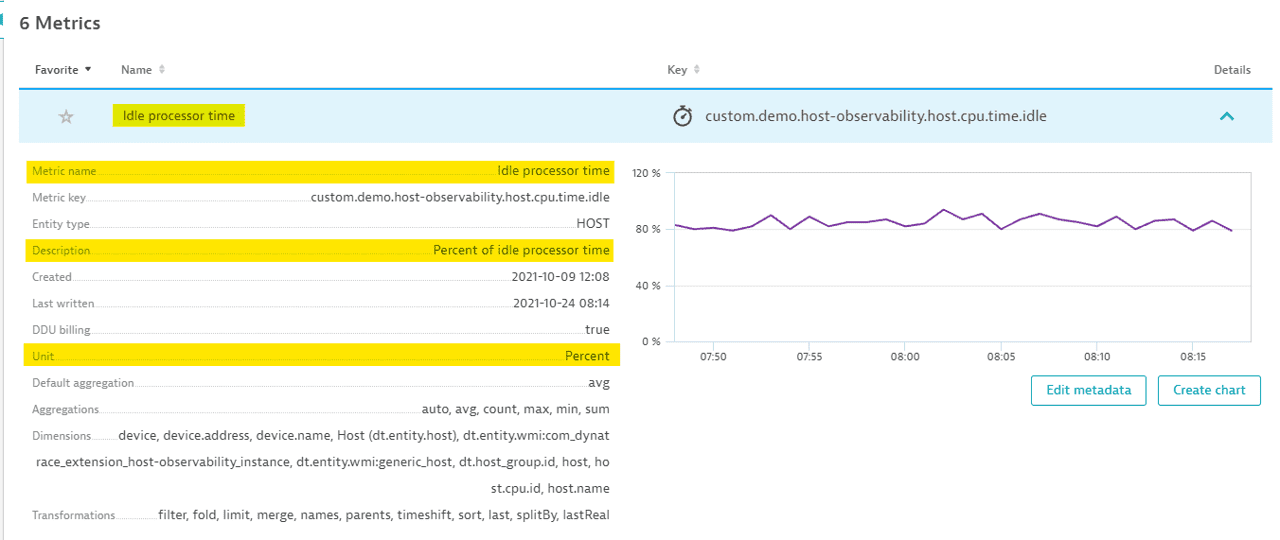
displayName,description, andunit - Package and upload a new version of your extension
- Validate metadata.
metrics:- key: custom.demo.host-observability.network.bytes.persecmetadata:displayName: Traffic bytes/sdescription: Network traffic bytes per secondunit: BytePerSecond## add content here, for all other metrics#
For more information on the WMI data source syntax, see WMI data source reference.
Results
You should now see the metadata reflected in the Metrics browser:

Next step: Custom topology
Related tags ExtensionsInfrastructure Observability
 ExtensionsInfrastructure Observability