Observe Argo CD deployment and application health with Dashboards and SDLC events
- Latest Dynatrace
- Tutorial
- 5-min read
- Preview
In this tutorial, you'll
- Integrate Argo CD and Dynatrace.
- Use
 Dashboards to observe Argo CD deployments and application health.
 - Use this information to optimize deployments with Argo CD.
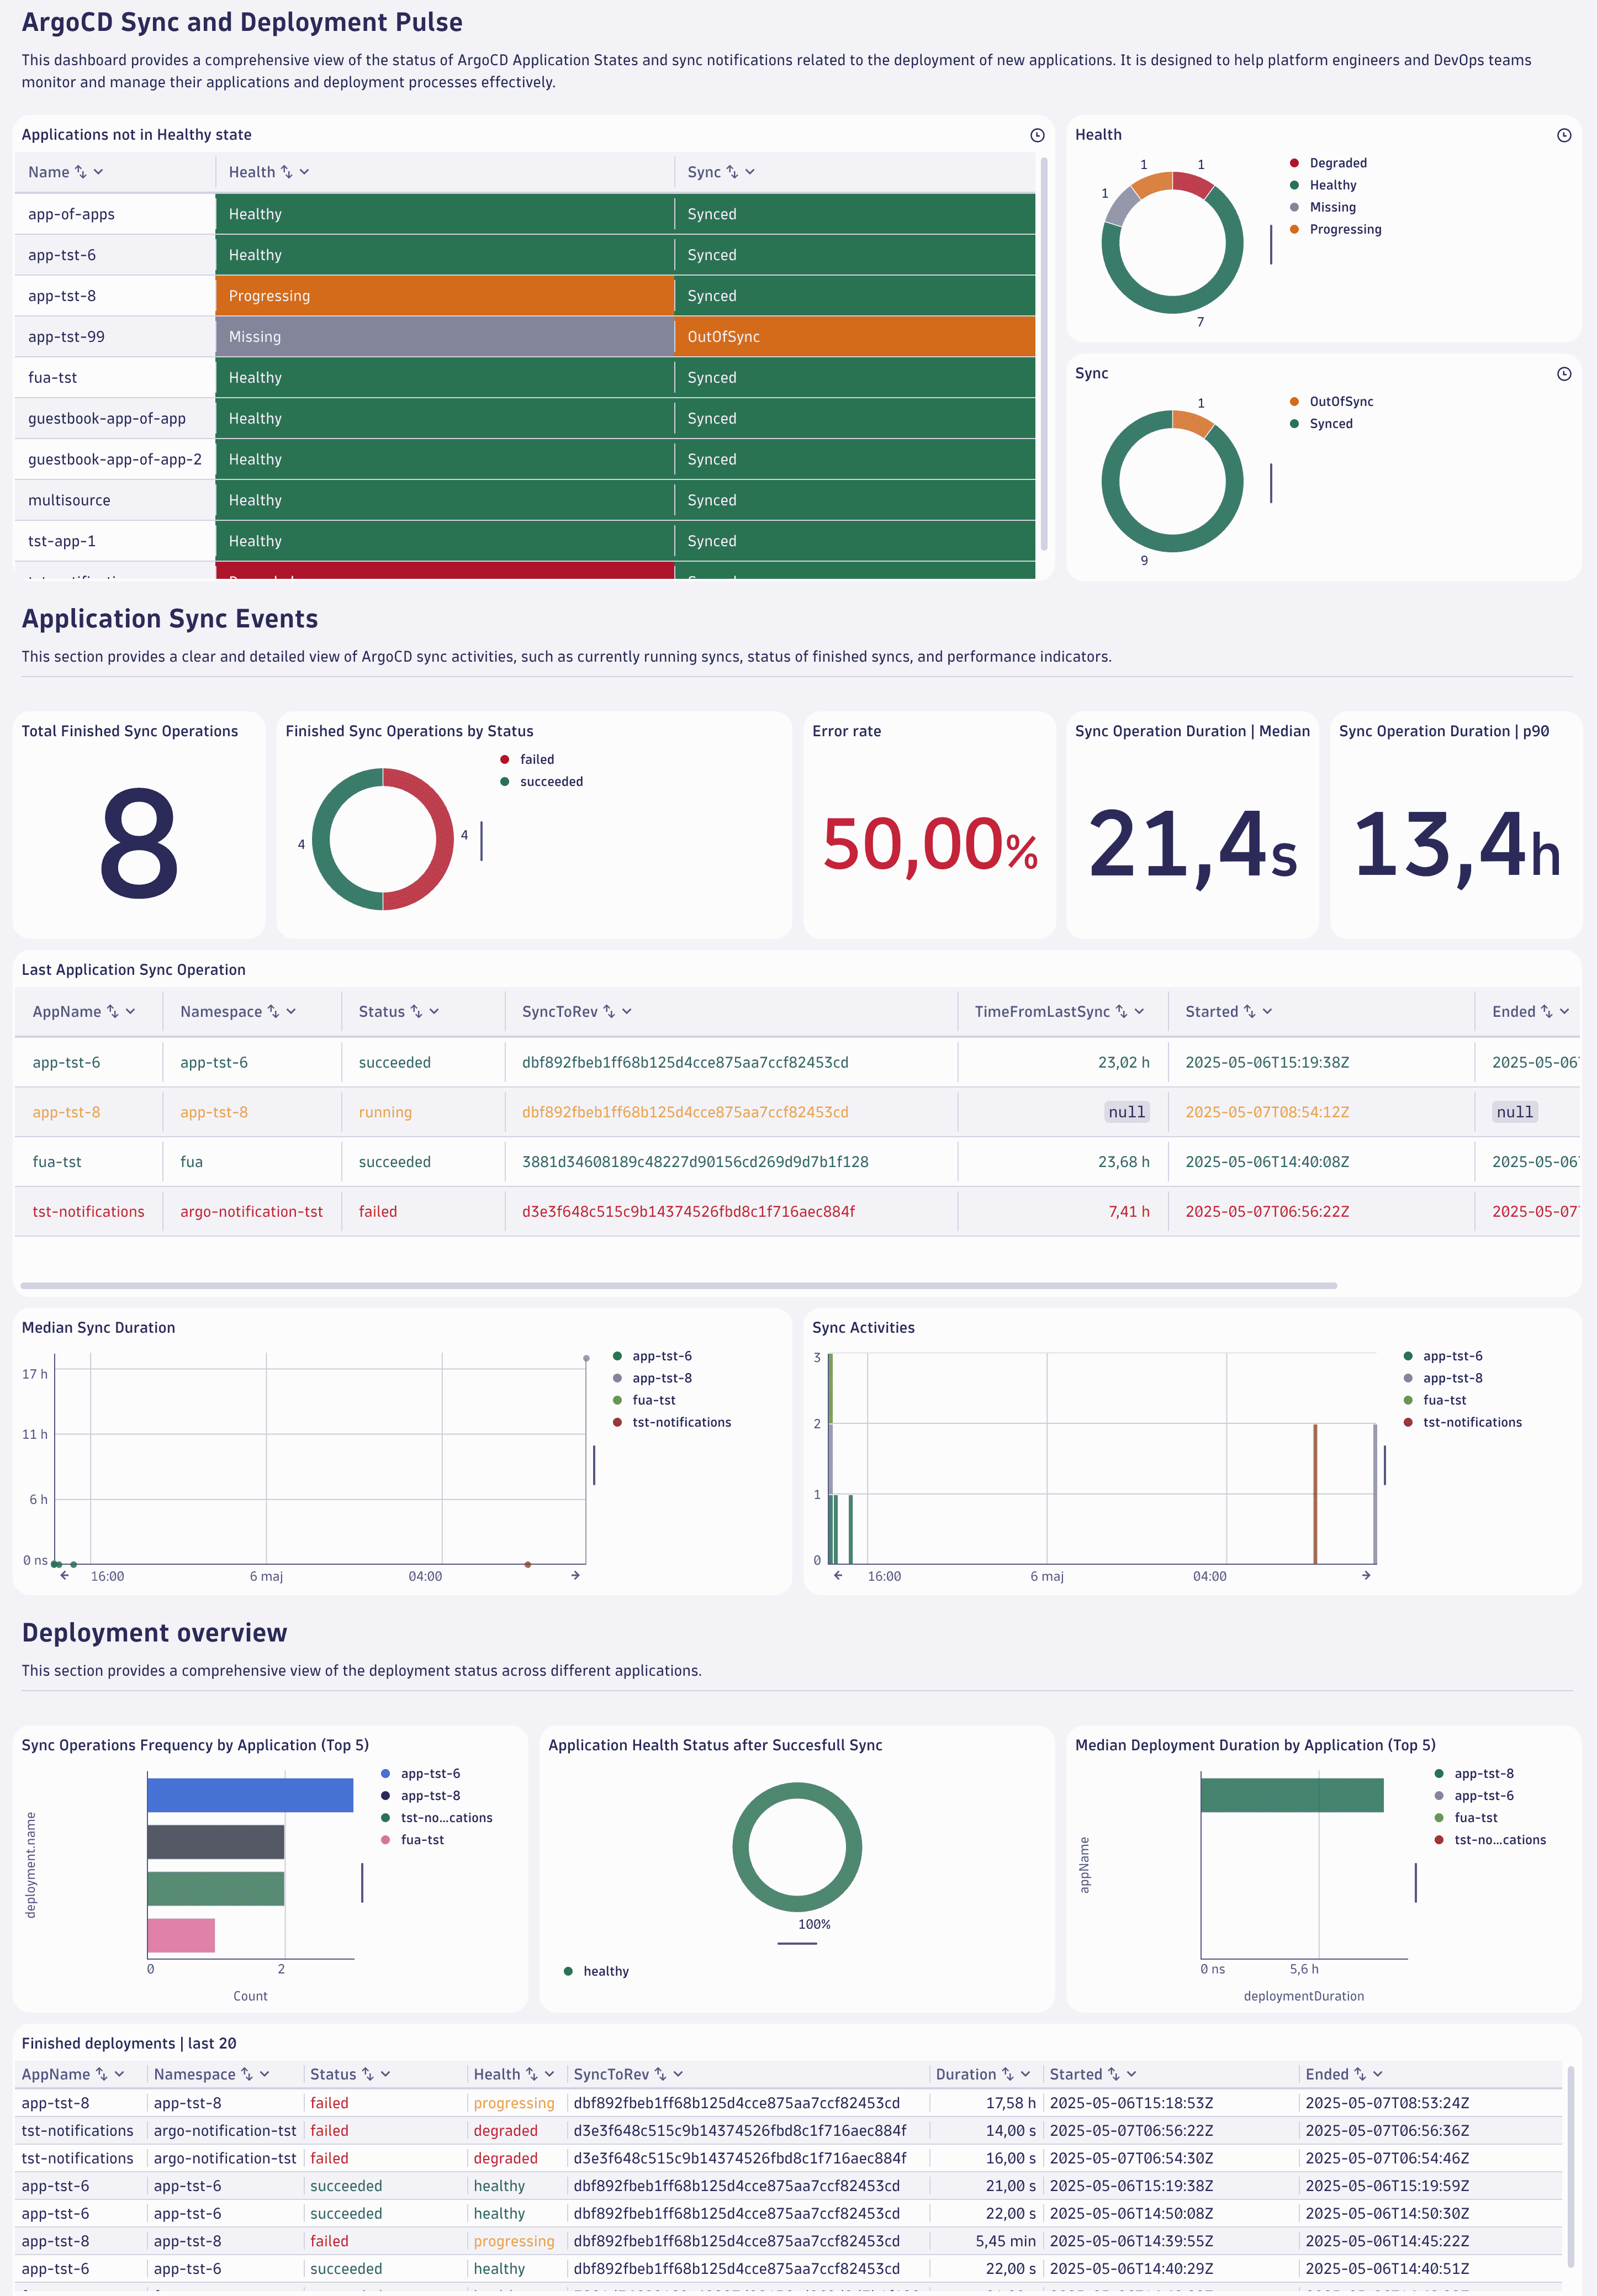
Below is an example of what your Argo CD dashboard could look like.
Concepts
- Software Development Lifecycle (SDLC) events
SDLC events are events with a separate event kind in Dynatrace that follow a well-defined semantics for capturing data points from a software component's software development lifecycle. The SDLC event specification defines the semantics of those events.
- Why were Argo CD notifications changed into SDLC events?
The main benefits are data normalization, tool agnosticism, and avoiding reliance on specific tools. As a result,
Dashboards, apps, and  Workflows can build on SDLC events with well-defined properties rather than tool-specific details.
Target audience
This tutorial is intended for platform engineers who manage the Internal Development Platform (IDP), including Argo CD, in GitOps-based deployments.
Learning outcome
In this tutorial, you'll learn how to
- Forward Argo CD notifications to Dynatrace.
- Send Prometheus metrics to Dynatrace.
- Normalize the ingested event data.
- Use Dashboards to analyze the data and identify opportunities for improvement.
Prerequisites
Install the Configuration As Code tool of your choice. Either install the Terraform CLI or install the Monaco CLI. Depending on the tool you choose, pick the correct setup section below.
Observe Argo CD deployment and application health with Dashboards and SDLC events
1. Setup: Prepare the configuration
-
Create a new platform token with the following permissions and store it in a secure place:
- Run apps:
app-engine:apps:run. - View OpenPipeline configurations:
settings:objects:read. - Edit OpenPipeline configurations:
settings:objects:write. - Create and edit documents:
document:documents:write. - View documents:
document:documents:read.
- Run apps:
-
Clone the Dynatrace configuration as code sample repository using the following command.
git clone https://github.com/Dynatrace/dynatrace-configuration-as-code-samples.git
2. Setup: Configuration as Code
You can choose between two options:
- Terraform.
- Monaco.
Set up Terraform.
-
Prepare the Terraform configuration.
The configuration consists of:
- Dashboards to analyze Argo CD activities.
- OpenPipeline configuration to normalize Argo CD notifications into SDLC events.
-
Move to the
argocd_observability_terraformdirectory with the following command.cd dynatrace-configuration-as-code-samples/argocd_observability_terraform -
Store the retrieved platform token in an environment variable.
$env:DYNATRACE_PLATFORM_TOKEN='<YOUR_PLATFORM_TOKEN>' -
Store your Dynatrace environment URL in an environment variable. Make sure to replace
<YOUR-DT-ENV-ID>with your Dynatrace environment ID, e.g.abc12345.$env:DYNATRACE_ENV_URL='https://<YOUR-DT-ENV-ID>.apps.dynatrace.com'
This configuration uses static routing, so there is no need to download and merge the dynamic routing configuration.
-
Apply the Terraform configuration.
Run this command to verify the provided Terraform configuration.
terraform planRun this command to apply the provided Terraform configuration.
terraform apply
3. Setup: Create a Dynatrace access token
To receive events processed by OpenPipeline, you need an access token with the following OpenPipeline scopes:
openpipeline.events_sdlc.openpipeline.events_sdlc.custom.
To generate an access token:
- Go to
 Access Tokens.
 - Select Generate new token.
- Enter a name for your token.
Dynatrace doesn't enforce unique token names. You can create multiple tokens with the same name. Be sure to provide a meaningful name for each token you generate. Proper naming helps you to efficiently manage your tokens and perhaps delete them when they're no longer needed. - Select the required scopes for the token.
- Select Generate token.
- Copy the generated token to the clipboard. Store the token in a password manager for future use.
You can only access your token once upon creation. You can't reveal it afterward.
-
Select these scopes:
- OpenPipeline - Ingest Software Development Lifecycle Events (Built-in) (
openpipeline.events_sdlc) - OpenPipeline - Ingest Software Development Lifecycle Events (Custom) (
openpipeline.events_sdlc.custom)
- OpenPipeline - Ingest Software Development Lifecycle Events (Built-in) (
-
Save the generated token securely for subsequent steps. We refer to it as
<YOUR-ACCESS-TOKEN>.
4. Setup: Configure Argo CD notifications
Argo CD notifications provide a flexible way to alert users about essential changes in the state of their applications managed by Argo CD. To configure the Argo CD notifications, you need to create a notification secret, apply the configuration, and subscribe applications to notifications.
-
Create a notification secret.
-
Update the
argocd-notifications-secretwith:apiVersion: v1kind: Secretmetadata:name: argocd-notifications-secretstringData:dt-base-url: https://{your-environment-id}.live.dynatrace.comdt-access-token: <YOUR-ACCESS-TOKEN> -
Apply the configuration.
kubectl apply -f <secret_file_name>.yaml -n argocd
-
-
Create a notification template and trigger.
-
If you don't have any notification configurations, create a new configuration map called
argocd-notification-cmas shown below. Otherwise, extend your config map configuration by adding the example's service, template, and trigger sections.apiVersion: v1kind: ConfigMapmetadata:name: argocd-notifications-cmdata:service.webhook.dynatrace-webhook: |url: $dt-base-urlheaders:- name: "Authorization"value: Api-Token $dt-access-token- name: "Content-Type"value: "application/json; charset=utf-8"template.dynatrace-webhook-template: |webhook:dynatrace-webhook:method: POSTpath: /platform/ingest/custom/events.sdlc/argocdbody: |{"app": {{toJson .app}}}trigger.dynatrace-webhook-trigger: |- when: app.status.operationState.phase in ['Succeeded'] and app.status.health.status in ['Healthy', 'Degraded']send: [dynatrace-webhook-template]- when: app.status.operationState.phase in ['Failed', 'Error']send: [dynatrace-webhook-template]- when: app.status.operationState.phase in ['Running']send: [dynatrace-webhook-template]Here is an explanation for the naming in the configuration.
dynatrace-webhookis the name of the service,$dt-access-tokenrefers to the Dynatrace access token, and$dt-base-urlis a reference to the Dynatrace event ingest endpoint stored in theargocd-notifications-secret secret.dynatrace-webhook-templateis the template's name, anddynatrace-webhookrefers to the service created above.dynatrace-webhook-triggeris the trigger's name, anddynatrace-webhook-templaterefers to the template created above.
-
Apply the configuration with this command.
kubectl apply -f <config_map_file_name>.yaml -n argocd -
Subscribe to notifications.
Modify the annotations of the Argo CD application by using either the Argo CD UI or the Argo CD application definition with the following annotations:
apiVersion: argoproj.io/v1alpha1kind: Applicationmetadata:annotations:notifications.argoproj.io/subscribe.dynatrace-webhook-trigger.dynatrace-webhook: ""The added
notifications.argoproj.ionotification annotation subscribes the Argo CD application to the notification setup you created above.
-
5. Setup: Send Argo CD Prometheus metrics to Dynatrace
Argo CD exposes different sets of Prometheus metrics for different services. Configure your Argo CD services to expose this information so Dynatrace can collect it. You can use either Dynatrace ActiveGate, which is installed on the Kubernetes cluster that hosts Argo CD, or the OTel Collector for ingesting telemetry into Dynatrace.
To use Dynatrace ActiveGate
-
Allow Prometheus metrics monitoring.
- Go to Kubernetes and select the monitored cluster with Argo CD installation.
- In the upper-right corner, go to > Connection settings.
- Choose Monitoring Settings.
- Allow Monitor annotated Prometheus exporters.
- Save.
-
In your Argo CD installation namespace, add the following two annotations for each of the services listed in the table below. Replace
{METRICS_PORT}with the corresponding port number.metrics.dynatrace.com/port: {METRICS_PORT}metrics.dynatrace.com/scrape: 'true'Service Metrics Port argocd-applicationset-controller
8080
argocd-metrics
8082
argocd-server-metrics
8083
argocd-repo-server
8084
argocd-notifications-controller-metrics
9001
argocd-dex-server
5558
View the histogram data ingest by going to
 Settings > Metrics > Histograms. The Ingest complete explicit bucket histograms setting you need is already allowed.
6. Unlock enhanced deployment insights with Argo CD
Now that you've successfully configured Argo CD and Dynatrace, you can use Dashboards and SDLC events to observe your Argo CD deployments.
Analyze
In Dynatrace, open the ArgoCD Application Lifecycle dashboard to
- Investigate running syncs and hotspots of many sync operations.
- Analyze the duration of sync operations.
- See deployment status and application health.
To try out, go to Dynatrace Playground.
Optimize
Use these insights for the following improvement areas:
-
Increase CI/CD pipeline efficiency.
Observing workflow executions lets you identify bottlenecks and inefficiencies in your CI/CD pipelines.
Knowing about these bottlenecks and inefficiencies helps optimize build and deployment processes, leading to faster and more reliable releases.
-
Improve developer productivity.
Automated pipelines reduce the manual effort required for repetitive tasks, such as running tests and checking coding standards. This automation allows developers to focus more on writing code and less on administrative tasks.
-
Get data-driven development insights. Analyzing telemetry data from CI/CD pipelines provides valuable insights into the development process. You can use the telemetry data to make informed decisions and continuously improve the development flows.
Continuous improvements
Check and adjust your CI/CD pipelines regularly to make sure they're running smoothly.
In Dynatrace, adjust the timeframe of the relevant dashboards to monitor the long-term impact of your improvements.
Call to action
We highly value your insights on pipeline observability. Your feedback is crucial in helping us enhance our tools and services. Visit the Dynatrace Community page to share your experiences, suggestions, and ideas directly on the Feedback channel for CI/CD Pipeline Observability.
Further reading
Dashboards OpenPipeline