Analyze log patterns
- Latest Dynatrace
- How-to guide
- 5-min read
- Published May 18, 2026
- Preview
Pattern analysis in ![]() Logs groups log records that share similar structure into a single pattern. This helps you understand the shape of your log data without reading individual messages, and collapses large volumes of similar logs into a compact, scannable list.
Logs groups log records that share similar structure into a single pattern. This helps you understand the shape of your log data without reading individual messages, and collapses large volumes of similar logs into a compact, scannable list.
Pattern analysis runs on the content field of log records stored in Grail that match your current filters and timeframe, using a Dynatrace Intelligence specialized log pattern model. Pattern analysis outcome is not re-ingested or stored, as it is a read-time view of the data.
Use cases
- Error overview: Pattern analysis shows you which error logs are similar and occur most often. This helps you decide which logs are most important to react and continue investigation.
- Explore logs: When you filter for a log source, Kubernetes namespace, or service tag for analysis, pattern analysis shows the kinds of messages being produced without requiring you to scroll through individual logs or write a DQL query.
- Find outliers: Pattern analysis shows you variable parts of otherwise similar log messages (tokens). A quick overview of tokens lets you find outlier values like error codes, IP addresses, user IDs, or other values.
- Reduce mass data: When a query returns thousands of logs that look similar, pattern analysis helps you identify if these are, for example, only 10 recurring message patterns.
Turn on pattern analysis
Log pattern analysis is an alternative query mode in ![]() Logs.
Logs.
- Regular Logs query mode lets you query individual log records.
- Patterns (Preview) query mode lets you detect patterns in logs and see the results grouped by status and pattern.
Start log pattern analysis
- Go to
 Logs.
Logs. - Set the scope of your analysis:
- Use
 Segments to apply global reusable filters
 - Use facets and the filter field to narrow down the log records.
- Set a timeframe.
- Use
- Select Patterns (Preview) to toggle query mode.
- Select Run query.
Pattern analysis is applied to the records matched by your current filters and timeframe. If you change filters or timeframe, rerun the query to refresh the pattern results.
If your query returns more than 50,000 log records, pattern analysis uses data sampling to improve the responsiveness. In case of sampled data, log patterns with a small number of matching logs may be left out of the result. Reduce the dataset by adding filters or narrowing timeframe to eliminate the effects of sampling:
- Apply a filter with Grail primary field or primary tag, and optionally use additional filters.
- Use a 30-minute timeframe.
- Choose only one status filter to, for example, focus only on errors.
View and share detected patterns
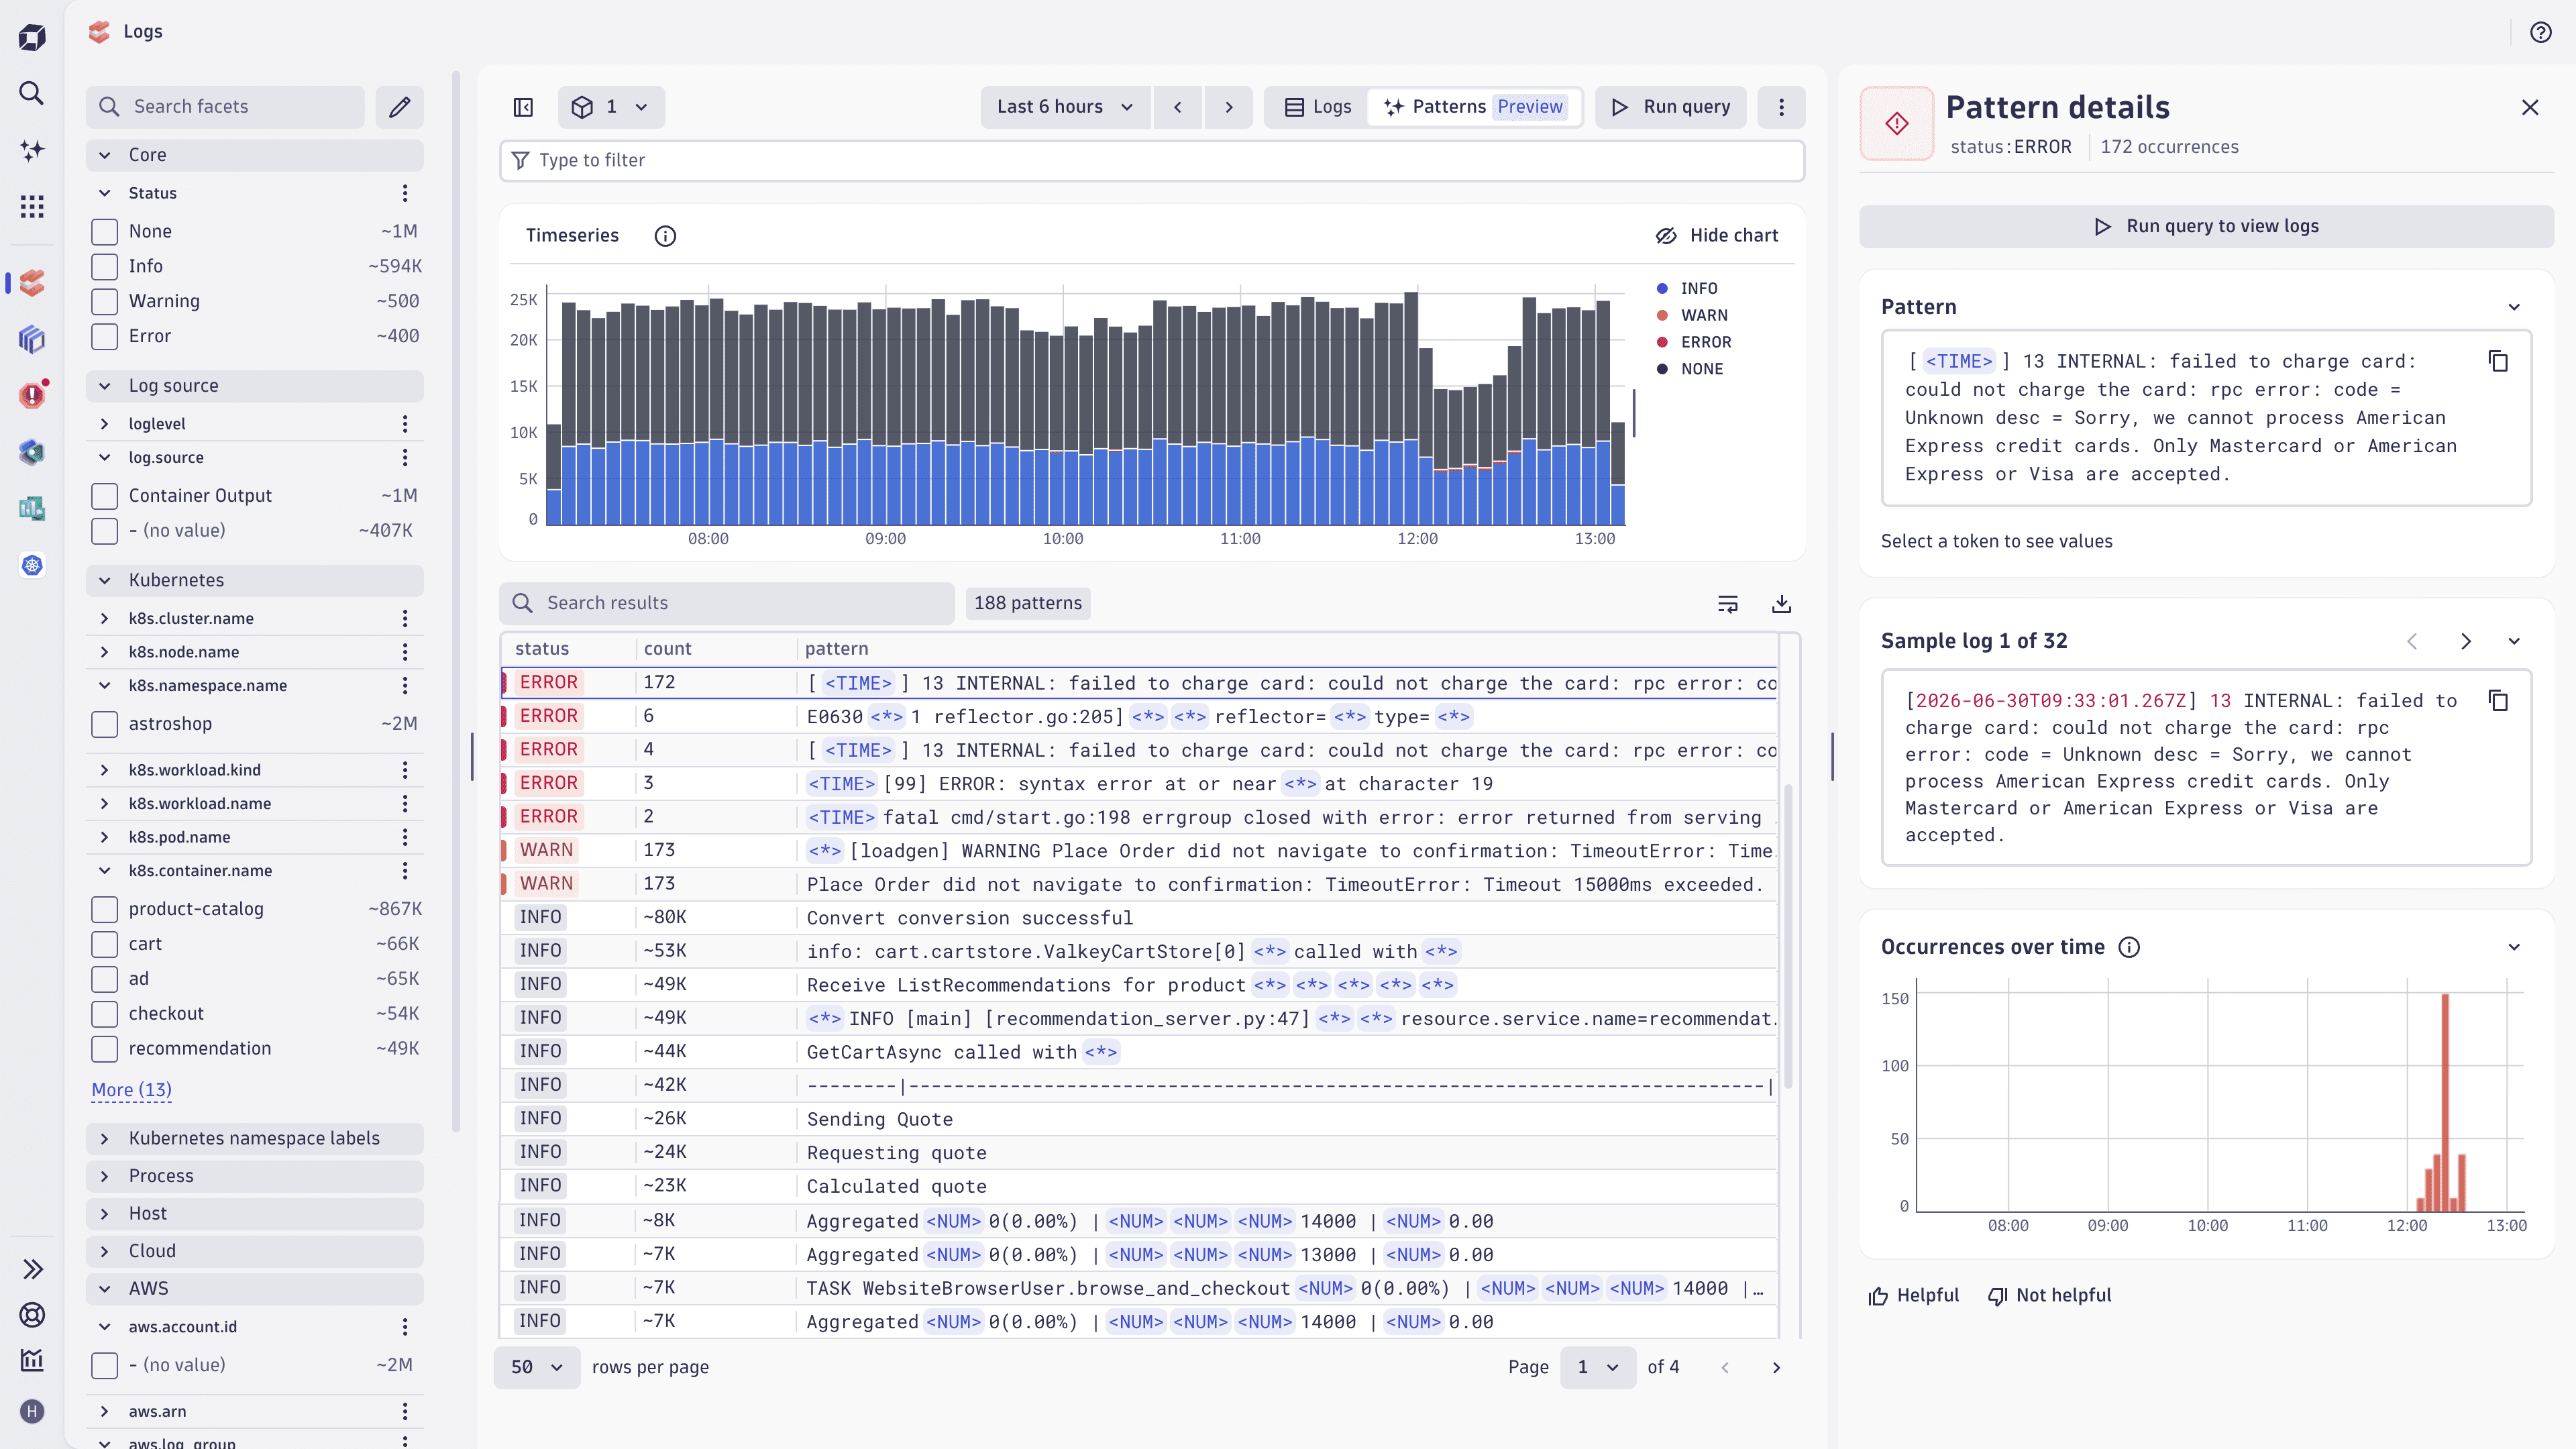
- Observe the list of detected patterns with the following fields:
- Status—The severity of the logs matched by this pattern. Patterns are grouped by status, with higher severity data presented first.
- Count—How many log records in your current scope match this pattern. Patterns are sorted by the number of records matching each pattern.
- Pattern—A representative message, with the variable parts shown as tokens.
- Note that tokens or the variable parts of the log message in a pattern are highlighted.
- Use Enable line wrap and Disable line wrap to improve readability of multi-line patterns.
To share the list of patterns detected, share the URL of the result from the browser address bar. Your recipient can execute pattern analysis to see the same outcome, if they have access to the underlying app and data.
Inspect a pattern
To inspect a pattern, select it in the list and review its details in the sidebar.
- The pattern description is displayed in full, with enough space to read long messages.
- Select a token (for example,
<IP>) to see the distribution of values for that token across the matched logs. Values are sorted according to occurrence counts and relative relevance, for example:10.130.0.6— 1810.130.0.7— 10
- Select to copy the DPL syntax of a pattern
- Select a token (for example,
- Review a Sample log to see an original log record that matched this pattern. Select to copy the log message.
- Select Helpful or Not helpful to provide feedback.
Simplified pattern representation
The Dynatrace Intelligence specialized log pattern model used in ![]() Logs outputs the patterns in DPL syntax, making the pattern reusable across Dynatrace, for example, in a DQL statement.
Logs outputs the patterns in DPL syntax, making the pattern reusable across Dynatrace, for example, in a DQL statement.
These patterns are displayed as a simplified representation to make them more readable. The following token placeholders are displayed in the simplified pattern representation instead of DPL matchers.
| Token placeholders | DPL matchers | Example value |
|---|---|---|
|
|
|
|
|
|
|
|
|
|
|
|
|
| Free-form text or other types |
Access DPL syntax pattern
Pattern analysis displays a simplified pattern representation. You can access and copy the full DPL syntax of a pattern:
- Start log pattern analysis via the steps described above.
- In the relevant row, select > Copy DPL.
- Inspect a pattern via the steps described above.
- In the Pattern text field, select .
Limits
The following limitations apply:
- If the original query result exceeds 50,000 records or 100 MB in data volume, pattern analysis samples the data.
- Log pattern analysis uses the
contentfield as the input field. Log records with acontentfield larger than 1,500 characters are excluded from pattern analysis. - JSON structures in
contentare detected as JSON tokens, without detecting individual tokens inside a JSON structure. - A DQL editor is not available in Patterns (Preview) query mode. Switch back to Logs query mode to view or edit DQL for the same scope.
- Pattern results are not cached across mode changes. When you switch between Logs and Patterns (Preview), the patterns are re-fetched the next time you run the query.
Give feedback
Log pattern analysis is under active development and your feedback helps shape the future of this feature.
To let us know about the value log pattern analysis brings to you, or which aspects you find missing:
- Select any pattern in the list of results.
- Select the I'm satisfied or I'm not satisfied.
- In the text field that appears, add any additional context.
- Select Send to submit feedback.
We appreciate feedback about any topic, including:
- Use case: did the pattern analysis help you achieve what you are working on?
- Pattern detection: were similar messages grouped correctly? Were patterns split that should have been one?
- Token detection: were variable parts of the patterns detected with correct types?
- Level of detail: did the details view for patterns provide you enough information for daily troubleshooting and exploration?