Configure a Top list visualization
- Latest Dynatrace
- How-to guide
- 2-min read
- Published Sep 28, 2026
Use this visualization when you want to:
- Rank entities by a metric. For example, to identify the top 10 hosts by CPU usage or the bottom 5 services by availability.
Examples
Example 1
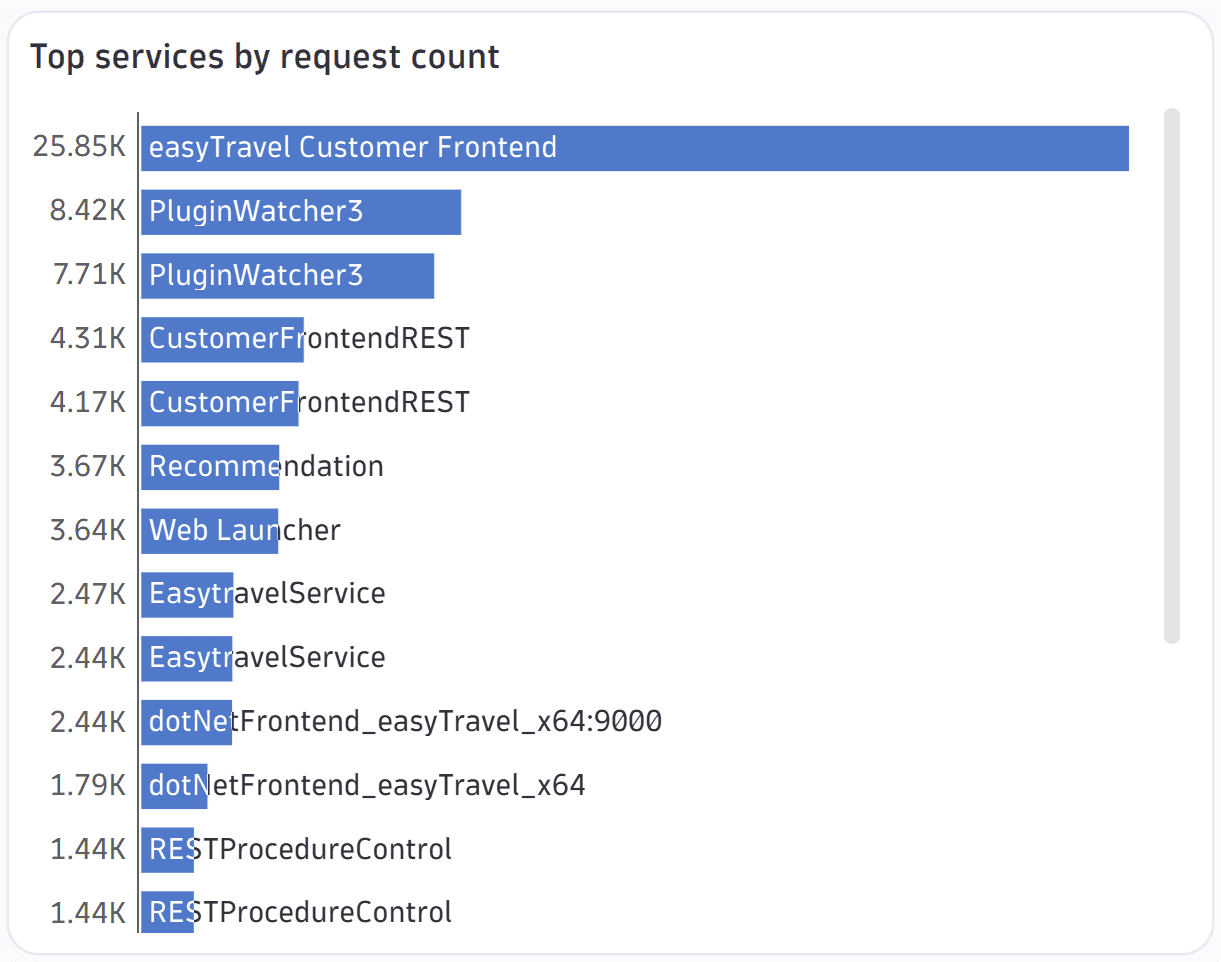
The visualization above is based on the following query.
timeseries sum = sum(dt.service.request.count, scalar: true), by:{ dt.smartscape.service }| fieldsAdd dt.smartscape.service.name = getNodeName(dt.smartscape.service)| sort sum desc| limit 20
Chart interactions
Selection interactions
- Hover to display a tooltip showing details.
- Select to pin the displayed tooltip open; you can then hover over the tooltip to display a menu of selection-specific options.
Available menu options vary according to your data and the selected visualization.
-
Copy series—copy the category name of the selected bar.
-
Copy y-value—copy the value of the selected bar.
-
Fields—a section with a submenu for each query field. A field submenu offers field-specific options such as:
- Copy value—copy the value of the field.
- Explain value—use AI to explain the field.
- Add command to query—a section of field-specific commands that you can automatically add to your query.
- Up to three recommended apps may be listed per field.
-
Visual options—opens the edit panel so you can change visualization options for the selected item.
-
Set color—opens the edit panel so you can change the color of the selected item.
-
Filter dashboard by—a section listing field values for the selected bar. Select a value to apply it as a dashboard filter. To undo or adjust a filter setting, use the filter bar added to the top of the dashboard.
-
Add link—for details, see Links.
-
Recommended apps may be listed based on the selected entity. Select an app to open it for the selected entity.
-
Open with lets you select a target app. For details, see Open with.
Title
Use the title field at the top of the options panel (initially Untitled tile or Untitled section) to add a title to your dashboard tile or notebook section.
- You can use emojis such as 😃 and 🌍 and ❤️.
- You can use variables.
Example:
- Define variables called
StatusandEmojiin your dashboard. - Set the title to
Current $Emoji status is $Status. - Set
StatustoGood. - Set
Emojito🌍.
The title will be displayed as Current 🌍 status is Good.
Visualization
If you aren't sure that you chose the right visualization, use the visualization selector to try different visualizations.
To learn about options quickly and decide what works best for you, turn options on and off and see the effect immediately on your chart. For example, does it look best with a label or without? Turn that option on and off and see for yourself.
Data mapping
The data mapping section shows how a column of your result is mapped to the visualization.
Expand the Data mapping section of your visualization settings to see how data in your result is mapped to your visualization, and to adjust those settings if needed.
- Mandatory fields are marked with an asterisk (
*). - Data types are displayed next to field names in dropdowns and mapped fields.
- Units are displayed when there's only one assigned.
- Result fields are grouped into Suitable and Unsuitable. Fields are marked as unsuitable if they cannot be used to display data in the visualization.
- Data mapping defaults are set automatically and may change.
- If you don't modify the default data mapping settings manually, these settings might change automatically if a new execution of the tile/section modifies the results and there are fields missing or new fields that better suit the data mapping.
- If you modify them manually, your settings are preserved regardless of any future changes to the query result.
For a Top list visualization, the data mapping section includes:
-
Category (required): the label for each bar. Select a string or numerical field.
-
Value (required): the numeric value that determines bar length. Select a numerical field.
Labels and tooltip
- Text truncation: determines how to truncate text when the full text can't be displayed.
- A…: trim from the right end of the text (when the right end is less important).
- A…B: trim from the middle of the text (when the middle is less important).
- …B: trim from the left end of the text (when the left end is less important).
Bars
-
Show labels: turn on to display text on each bar, then select what to show:
- All: displays both the category label and the value on each bar.
- Category (default): displays the category label on the bar.
- Value: displays the value on the bar.
-
Sort order: determines the sort direction of the bars.
- Descending (default): largest value at the top.
- Ascending: smallest value at the top.
Colors
General color settings that apply to all charts except maps, which have their own color settings.
The color settings for a visualization are displayed in rows.
Each row associates a color scheme with a condition/value related to a selected field displayed in the visualization.
To adjust the settings for a row, there are two menus of settings that will be used in combination to determine which color is displayed:
- The first menu in a row displays the selected color or color palette. Open this menu to display three tabs of color options:
- Palettes: select a color palette to use for this row.
- Colors: select a color to apply uniformly when this rule matches.
- Custom: specify a precise hex color code (for example,
#134FC9) or use the color picker to select a color visually.
- The second menu in a row displays the condition under which this row's color will be displayed. Select the current setting to change the field, operator, and value as needed to evaluate the condition.
Colors: additional actions
- To add a row, select and configure it as described above.
- To move a row up or down in the table, select and drag .
- opens a menu of further options:
- Move up and Move down move the row up or down one row.
- Duplicate creates a copy of the selected row.
- Delete removes the row.
Units and formats
To override the default units and formats in a dashboard or notebook visualization
-
Select to edit the visualization tile.
-
Select the Visual tab.
-
Expand Units and formats.
The Units and formats section lists all available unit settings for the document (dashboard or notebook). Some units may already be added automatically when querying metrics from their metadata.
Each row has two menus:
- The left menu displays unit settings.
- The right menu displays field mapped to that unit.
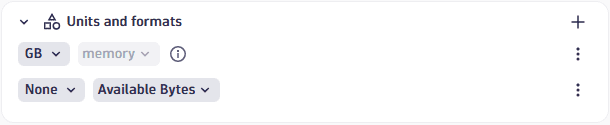 Example rows in "Units and formats" settings
-
To edit unit settings, open the left menu and review/set the following settings:
-
Unit: The base unit in which the values were captured. It's
Noneif it was not included in the DQL result, or its automatically defined by the unit passed from the DQL result. This field doesn't lead to any conversion but modifies the suffix to correspond to the unit. -
Convert: You can turn on Convert for conversion. For example, if the DQL result defined your numeric value in the result as
Bytes, Convert now offers a suitable list of byte conversions such asKilobyteandMegabyte.Only linear and static conversions are supported. For example, you cannot convert
Degree Celsius(°C)intoDegree Fahrenheit(°F), or convertUsd(US$)intoEur(€).
The Format section determines how the unit is displayed:
- Decimals: displays the default number of decimals (degree of precision) to display. To see it in action, change the Decimals selection and observe the change in the visualization.
- Custom suffix: displays the suffix to display after the unit. To see it in action, turn on Custom suffix, enter a string, and observe the change in the visualization. When you don't find the unit you're looking for, you can use Custom suffix to display the desired unit.
- Abbreviate large numbers: displays large figures in abbreviated form. For example,
1053becomes1.1K. - Multiple units: displays more than one unit. Turn this on and select the number of units to display. For example,
90 secondsbecomes1m 30sif multiple units is enabled and 2 units are selected.
-
-
To choose a different field for a row, open the right menu in that row and select a field from the available fields.
Units and formats: Additional actions
- To add a row, select (Add) and configure it as described above.
- (Actions) opens a menu of further options:
- Duplicate creates a copy of the selected row.
- Delete removes the row.
- Reset resets the settings in the selected row to default/metadata values.
Units and formats: Examples
Chart average CPU across all hosts
This example uses a line chart, but the options apply to other visualizations.
-
In
 Dashboards, create a dashboard.
-
Select and, in the Library section of the menu, select Chart average CPU across all hosts.
-
In the edit panel, select the Visual tab and select Line.
-
Expand Units and formats.
One row is already defined based on metadata from
avg(dt.host.cpu.usage). -
To override the unit settings for that field, open the left menu in that row to display the unit settings.
-
Define an override for the displayed metric. You can observe your changes in the Y-axis of the chart.
-
Unit displays
Percent, which is the default unit for the selected metric. -
Turn on Convert to try conversions settings. For example, change
AutotoOneto display the result as a fraction of 1. -
Decimals displays the default number of decimal points (degree of precision) to display. For example, enter
Pctand review the dashboard to seePctinstead of%displayed after the percentage value. -
Turn on Custom suffix to try different suffixes to display after the unit. For example, change the Decimals selection and review the dashboard to see the change in the number of decimal points in the percentage value.
-
To reset to defaults (discard override settings for the selected metric), open the (Actions) menu for that row and select Reset.
Links
Use the Links section to manage custom links from your dashboard or notebook.
Add a link
To add a link
- Open the Links section in the visualization tab of your selected visualization.
- Select to open Add link.
- Configure the link:
- Name: Enter a descriptive name such as "Go to Host" to display in the menu.
- Icon: Select an icon such as "Logs" to represent the link in the menu.
- URL: Use dynamic placeholders to insert data fields or variables. For example, select Insert placeholder and add the
:nameplaceholder to your URL likehttps://myhost/host={{:name}} - Use the Preview section at the bottom to see how placeholders will be replaced with actual data and to test your link.
- Select Add link to save. The link will now appear in the visualization's tooltip menu.
Links: Additional actions
- To add a row, select and configure it as described in Add a link.
- To move a row up or down in the table, select and drag .
- opens a menu of further options:
- Edit displays link fields for editing as described in Add a link.
- Duplicate creates a copy of the selected row.
- Delete removes the row.
For details, see Link from visualization via custom links
Query limits
Use the Query limits section to check and adjust the Grail query limits per notebook section or dashboard tile. These settings determine the maximum limits when fetching data. Exceeding any limit will generate a warning.
Dashboard tiles and notebook sections created in Dynatrace earlier than version 1.296 are not affected. Those existing tiles/sections will return the same results as before.
-
Read data limit (GB)
The limit in gigabytes for the amount of data that will be scanned during a read.
-
Record limit
The maximum number of result records that this query will return. Default: 1,000 records. To see more records, you need to increase the value of Record limit.
-
If your query has no
limit, such asfetch logsthe value of Record limit is applied. By default, you will see up to 1,000 records.
-
If your query also includes a
limit, such asfetch logs| limit 2000the lower of the two values (either
limitin your query, or Record limit in the web UI) is applied.In the example above, you would still see only 1,000 records unless you increased the value of Record limit.
-
-
Result size limit
The maximum number of result bytes that this query will return. For better performance with typical queries and smaller documents, the default is set to 1 MB.
-
Sampling (Logs and Spans only)
Results in the selection of a subset of Log or Span records.