Ready-made dashboards
- Latest Dynatrace
- Reference
- 9-min read
- Published Jul 08, 2022
Dynatrace ready-made dashboards offer preconfigured data visualizations and filters designed for common scenarios like troubleshooting and optimization.
- Use them right out of the box
- Save a copy and customize your copy
-
In Dynatrace, go to
 Dashboards.
 -
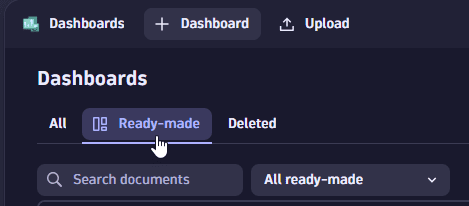
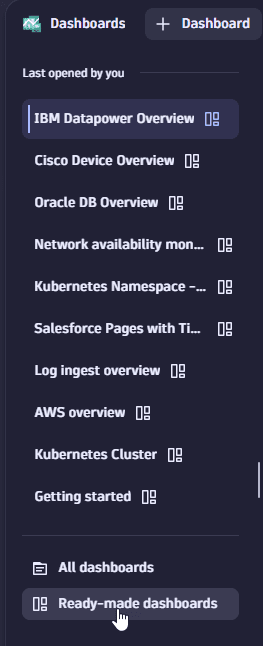
Choose a way to list all ready-made dashboards.
-
Select the ready-made dashboard you want to use.
Try the Explore in Playground links below to see them in action.
When you open a document (dashboard or notebook) for which you don't have write permission, you can still edit the document during your session. After you're finished, you have two options:
- Save your changes to a new document
- Discard your changes
Example:
-
Go to
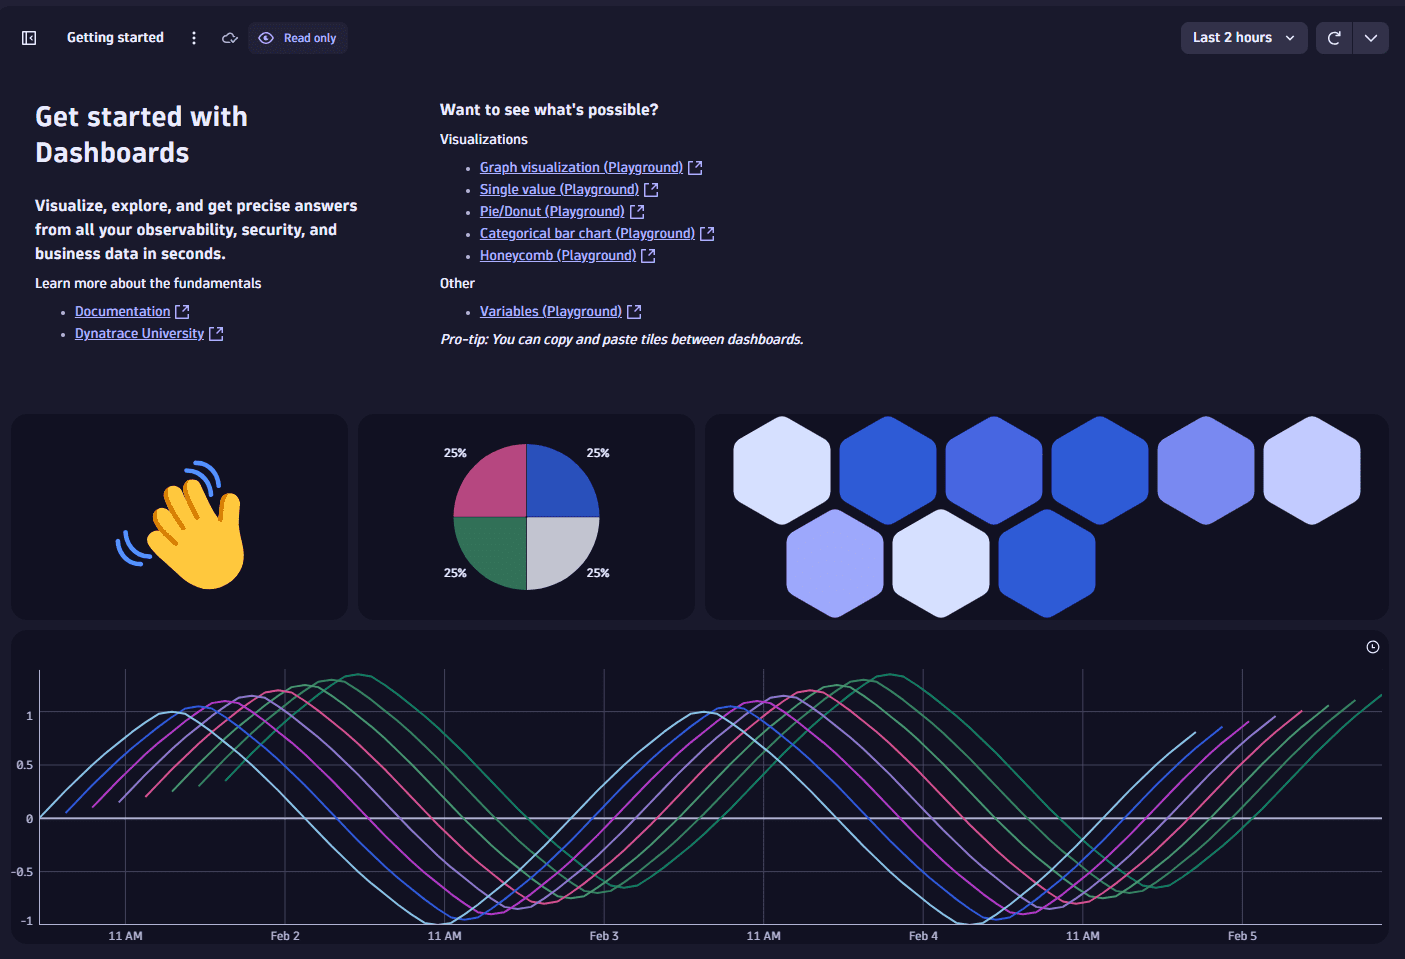
 Dashboards, list the ready-made dashboards, and select the Getting started dashboard.
It says Ready-made in the upper-left corner, next to the document name.
-
Select the Pie chart tile and then select Edit.
-
Change the visualization from Pie to Donut.
Now you are offered two buttons: Save as new and Discard changes.
-
Use the updated dashboard as needed. You have full edit access for this session.
-
When you're finished, select what to do with your changes:
- Save as new—saves your changes in a new copy of the edited dashboard.
- Discard changes—discards your changes and returns you to the unedited read-only dashboard.
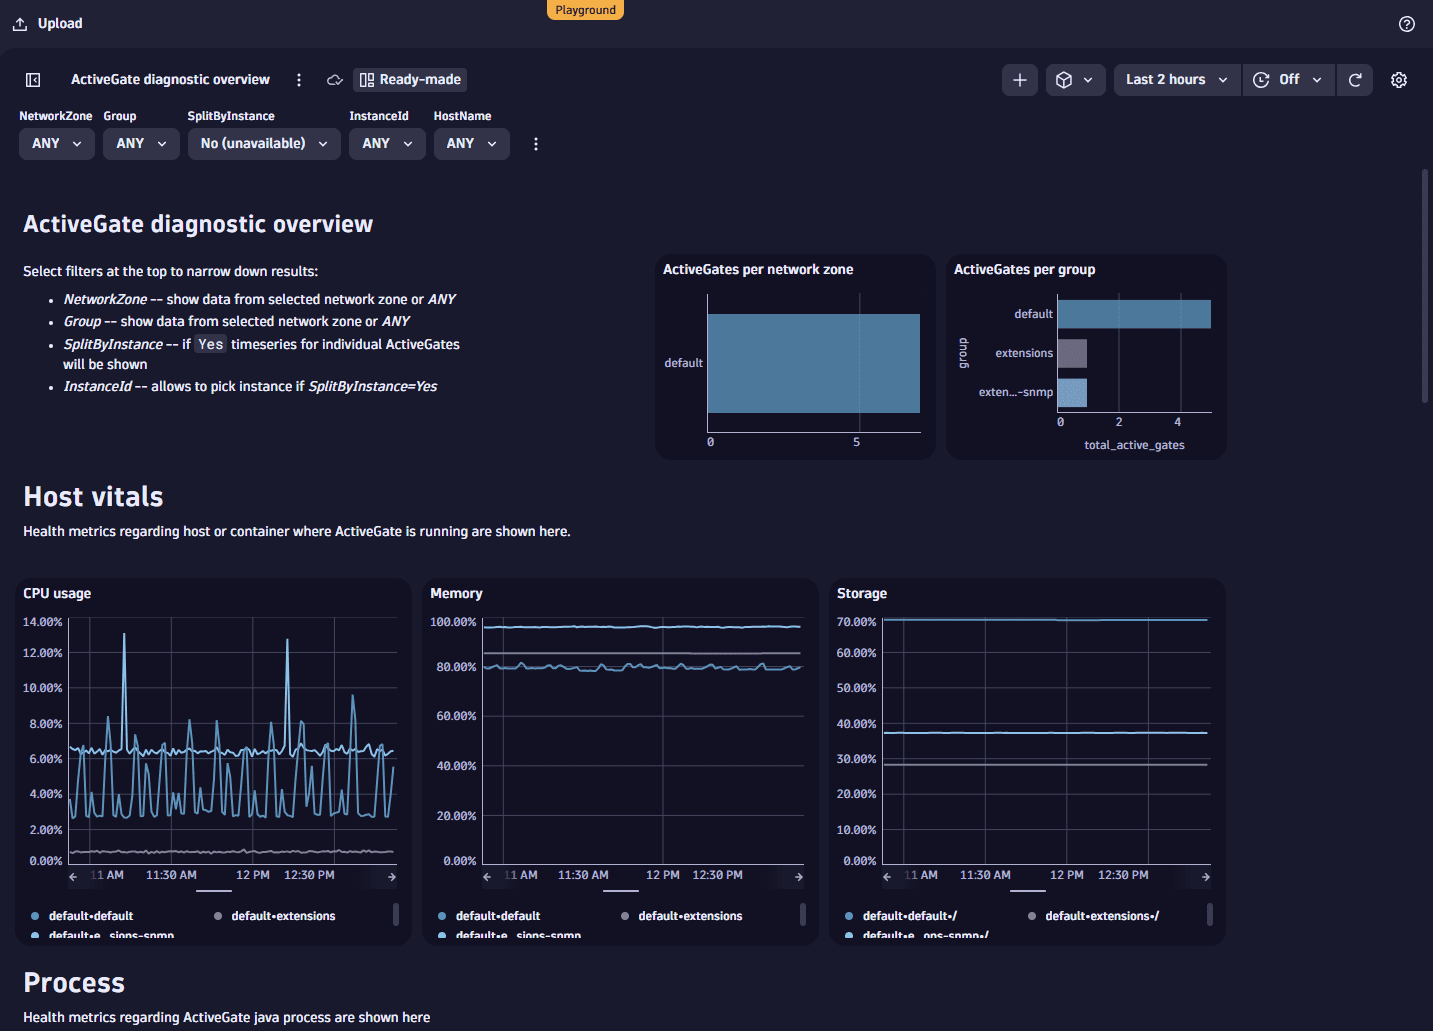
ActiveGate diagnostic overview
Offers a filterable diagnostic overview of ActiveGate with sections for:
- Host vitals—Health metrics regarding host or container where ActiveGate is running.
- Process—Health metrics regarding ActiveGate Java process.
- Networking—Incoming and outgoing network traffic.
- REST.API—API calls, errors, request size, and response size.
Related Dynatrace app: Dynatrace ActiveGate
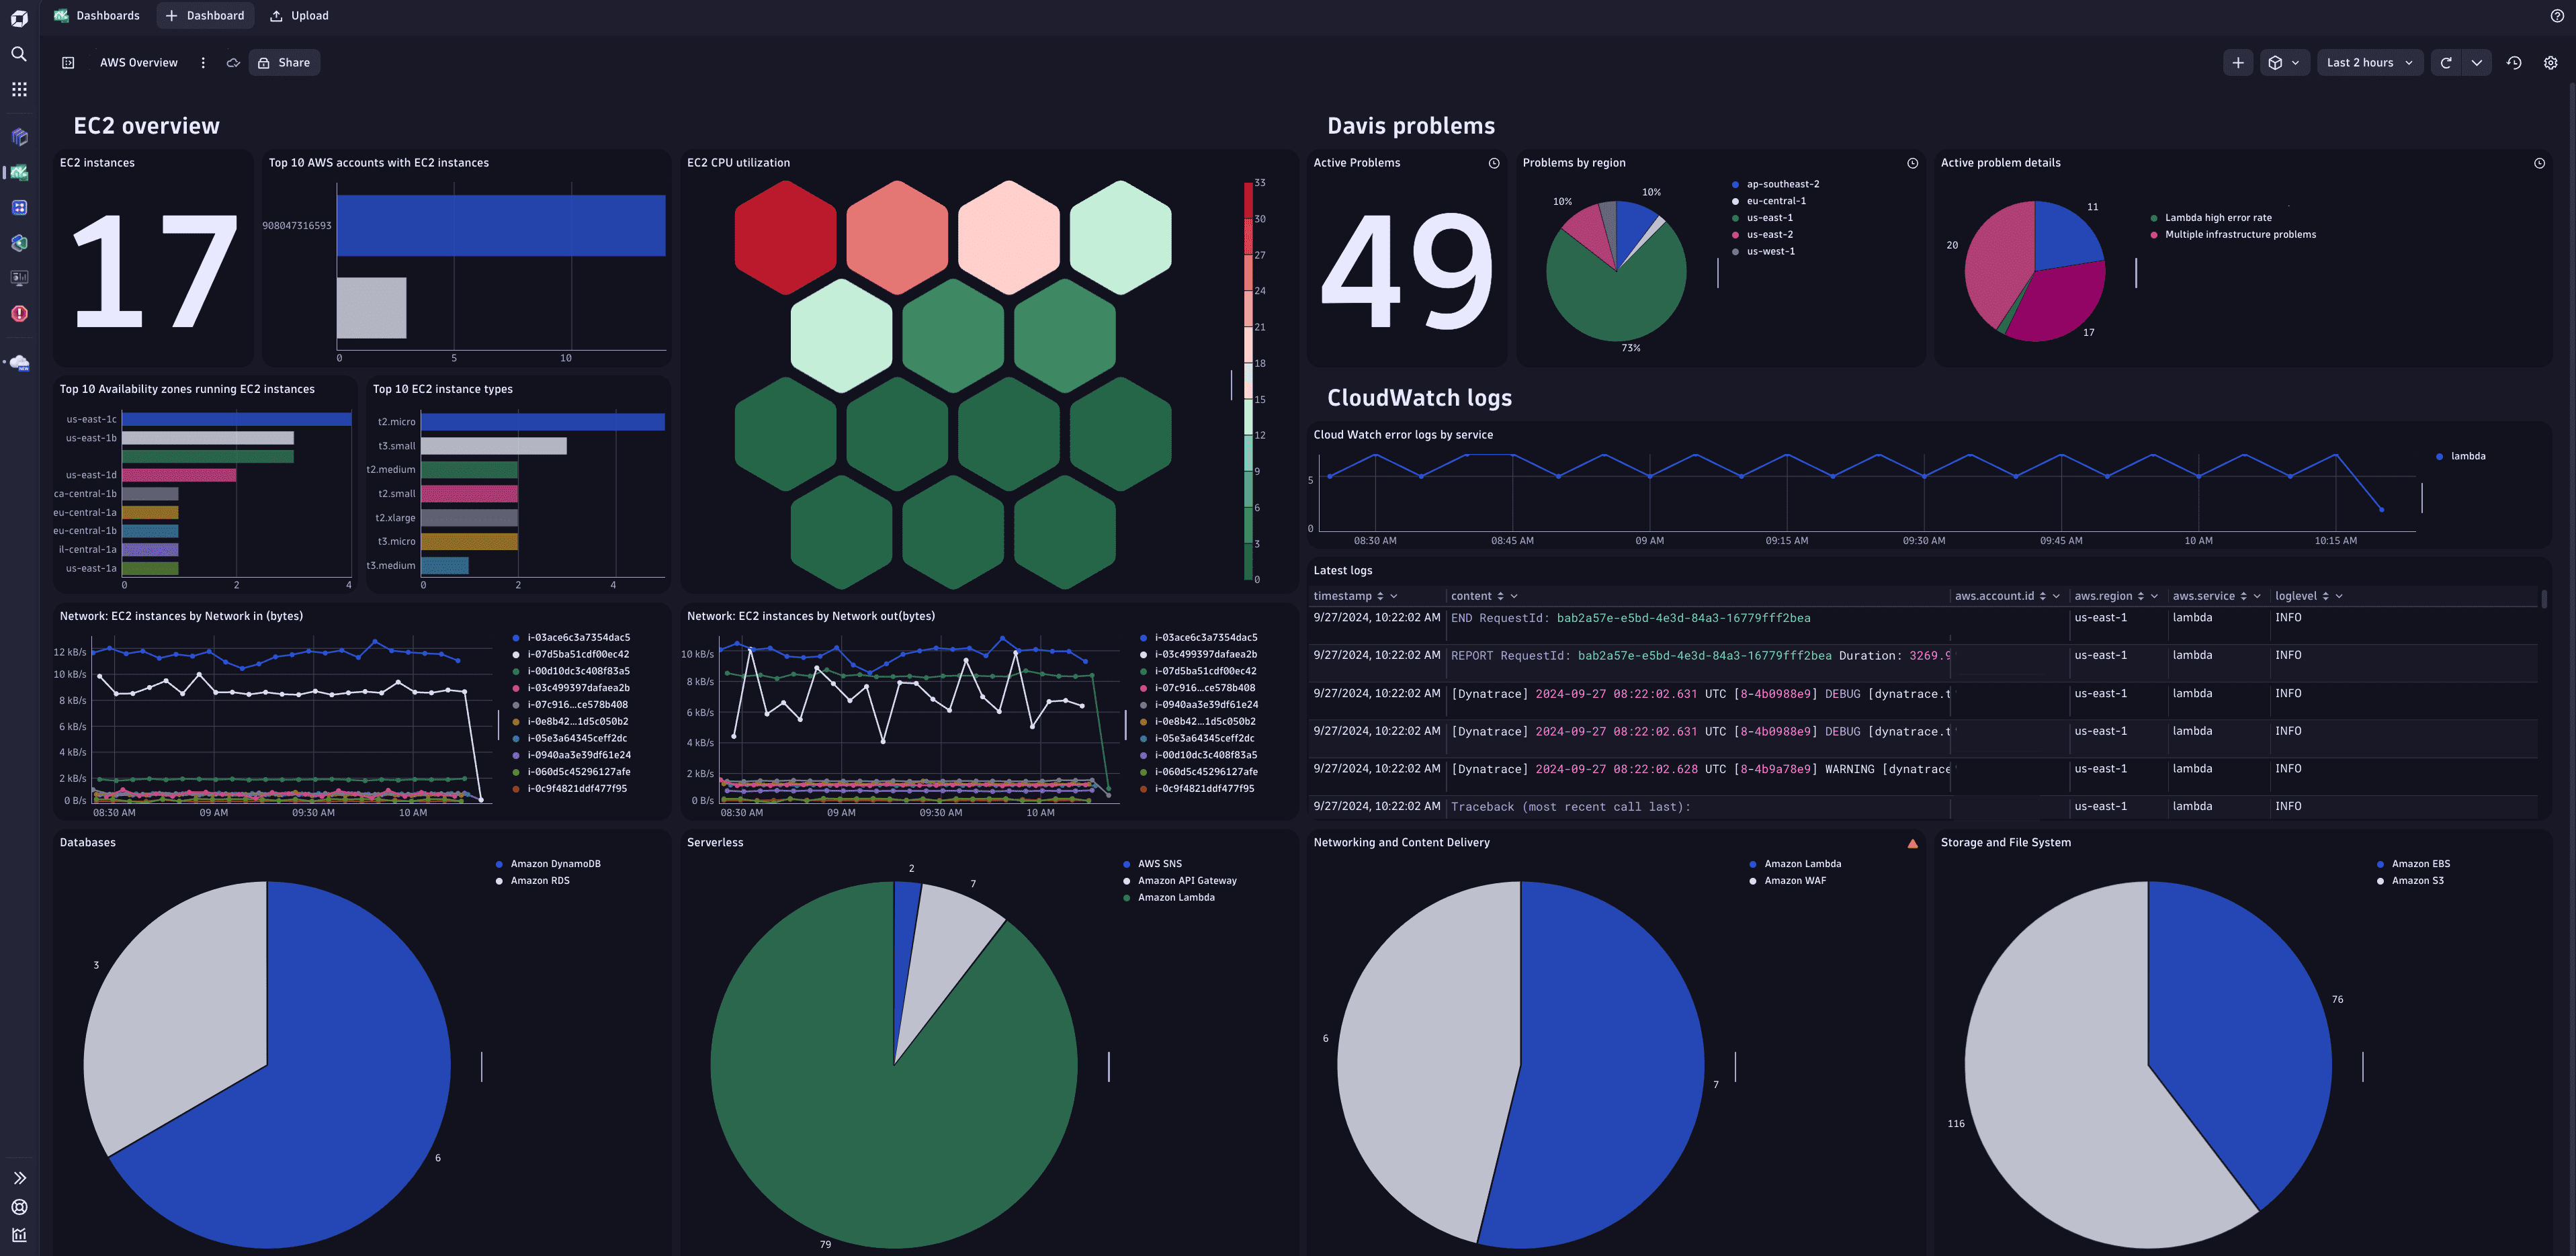
AWS Overview
Get broad visibility into the status of your monitored AWS Environments.
Related Dynatrace app:  Clouds
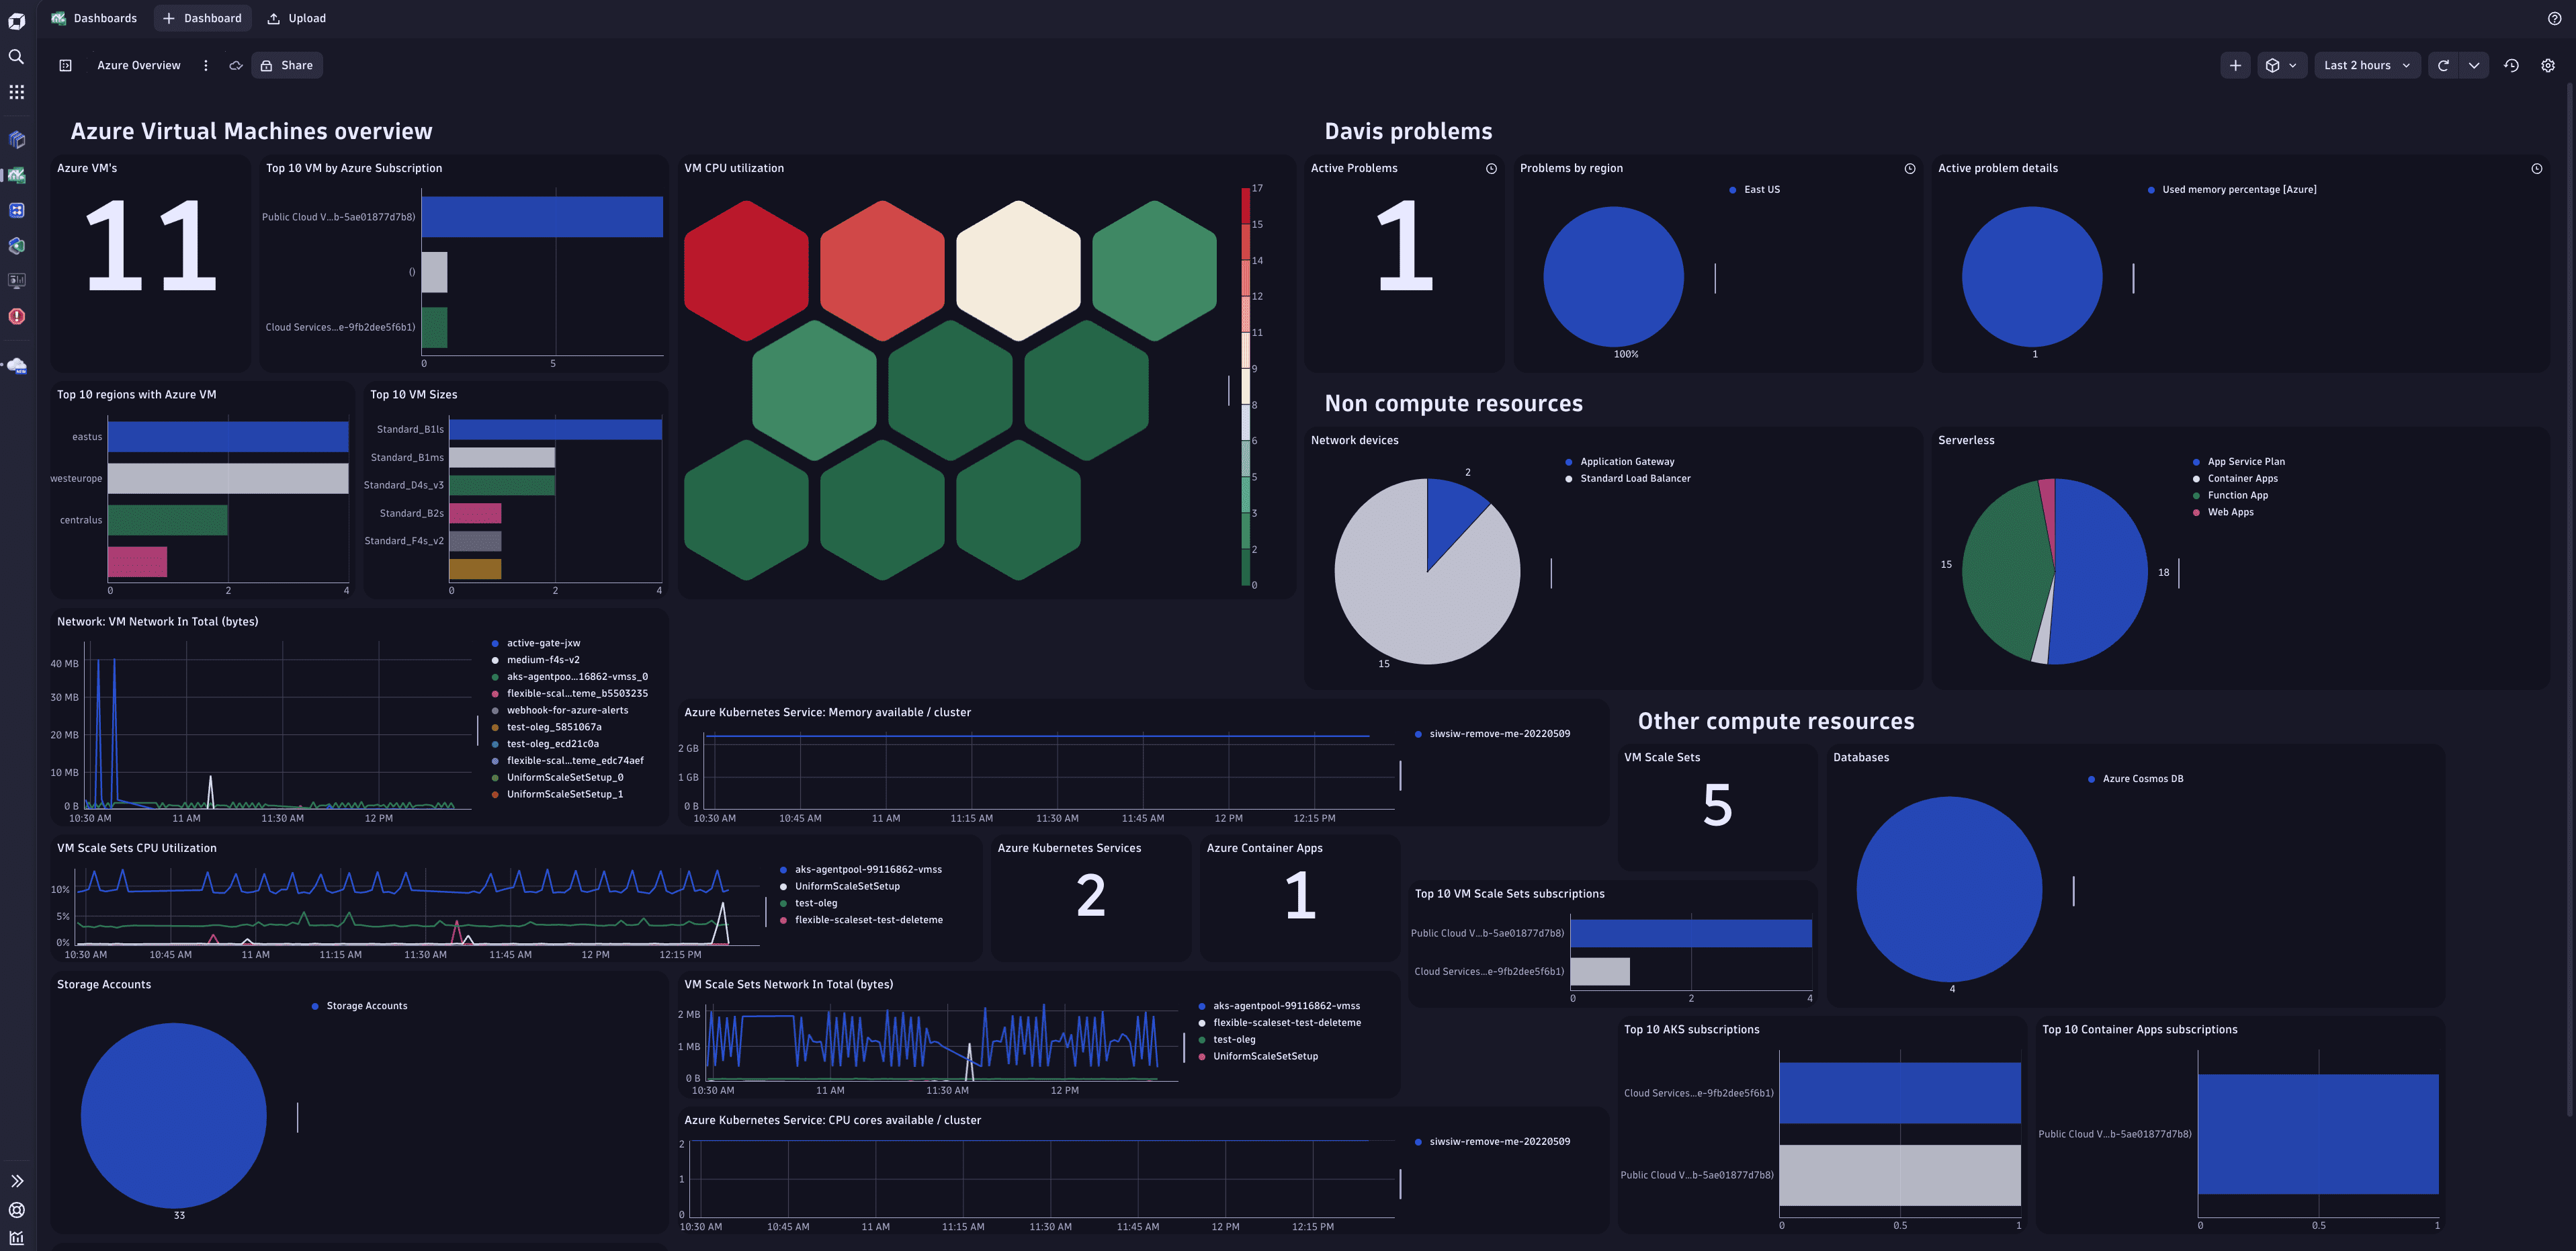
Azure Overview
Get broad visibility into the status of your monitored Azure Environments.
Related Dynatrace app:  Clouds
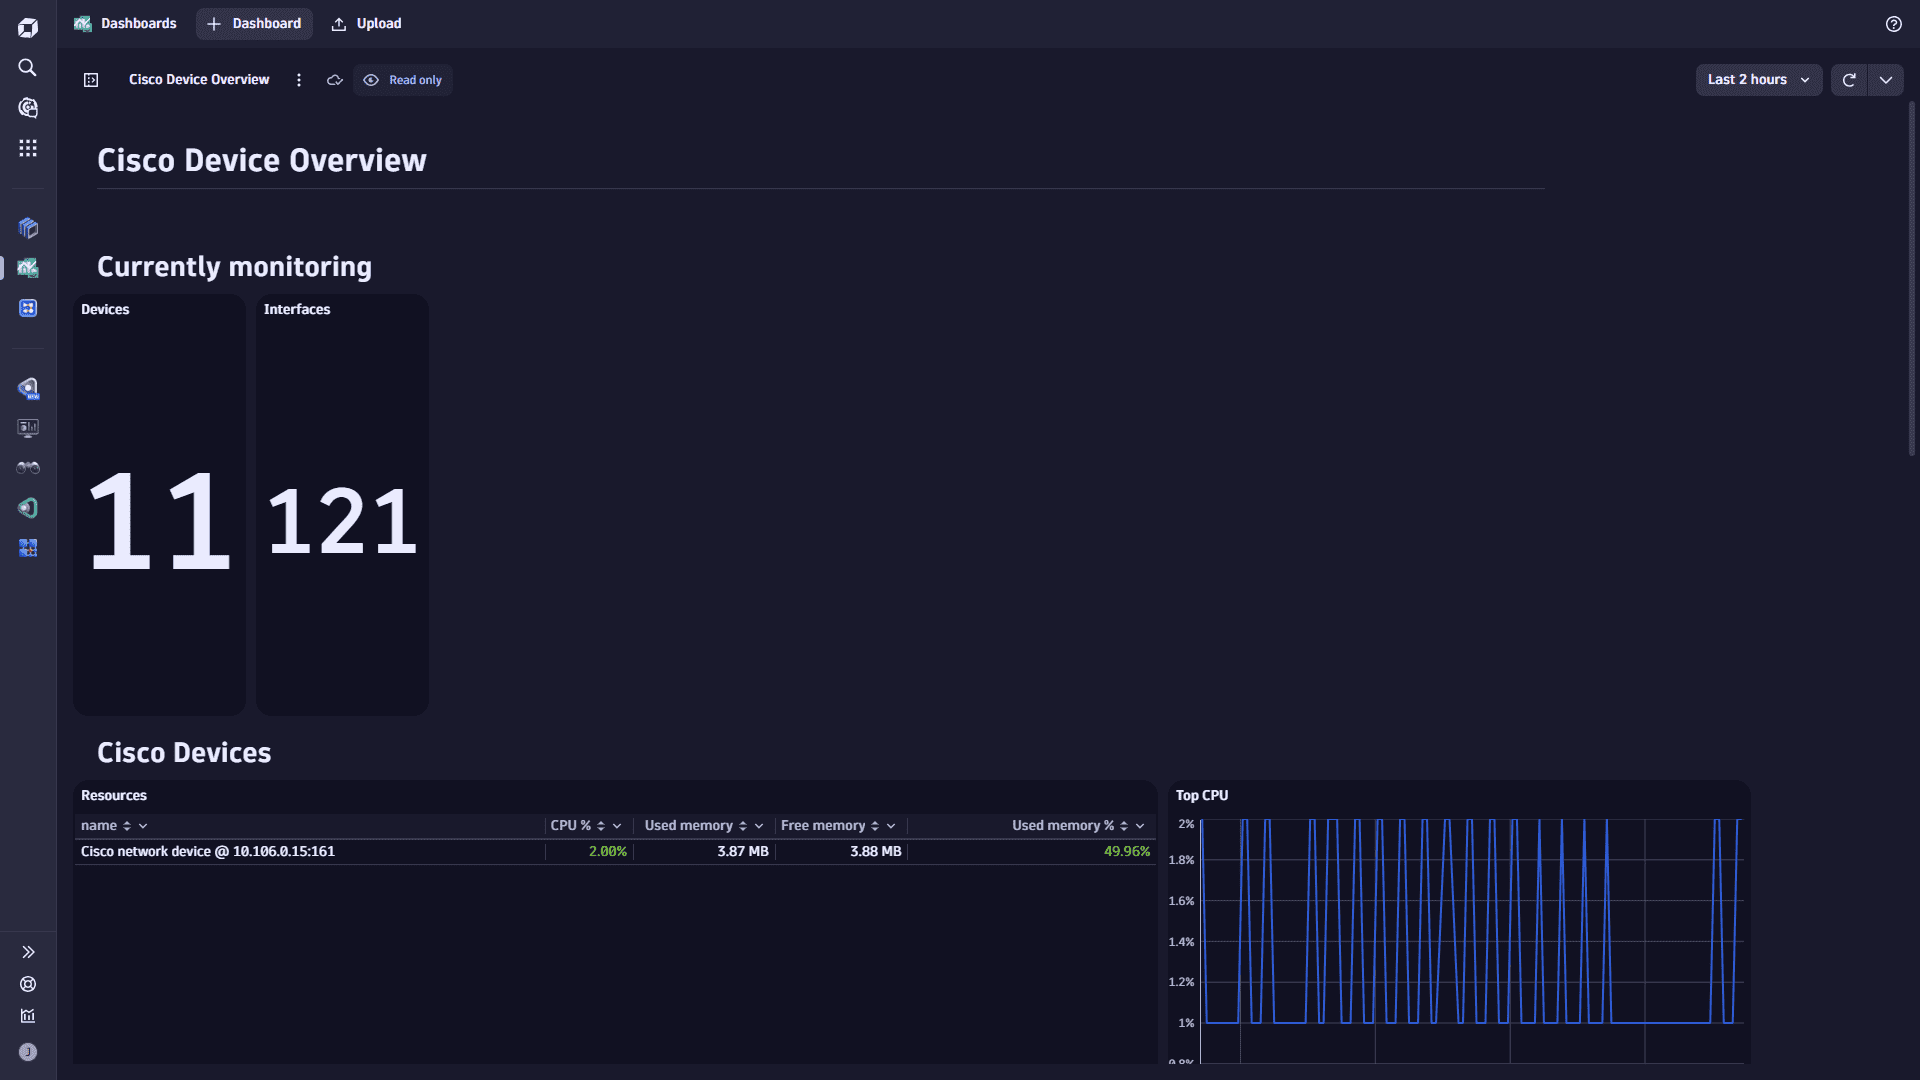
Cisco Device Overview
Display select key metrics for Cisco SNMP monitoring (health, interfaces, and BGP data) .
Related Dynatrace app:  Extensions
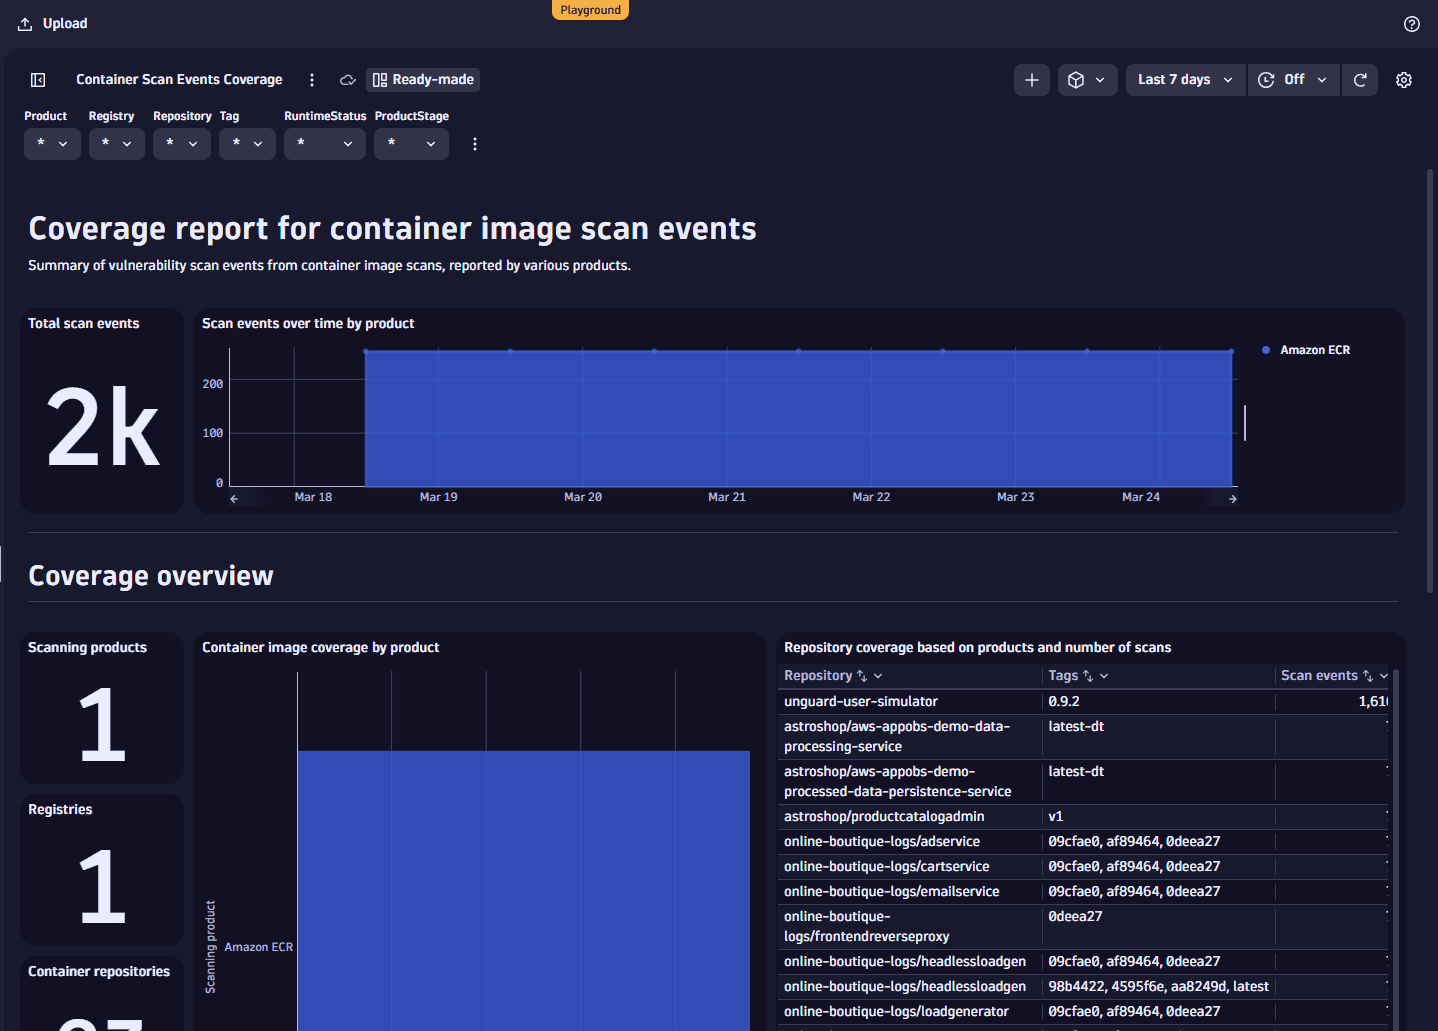
Container Scan Events Coverage
Summary of vulnerability scan events from container image scans reported by various products.
Related documentation: Security integrations
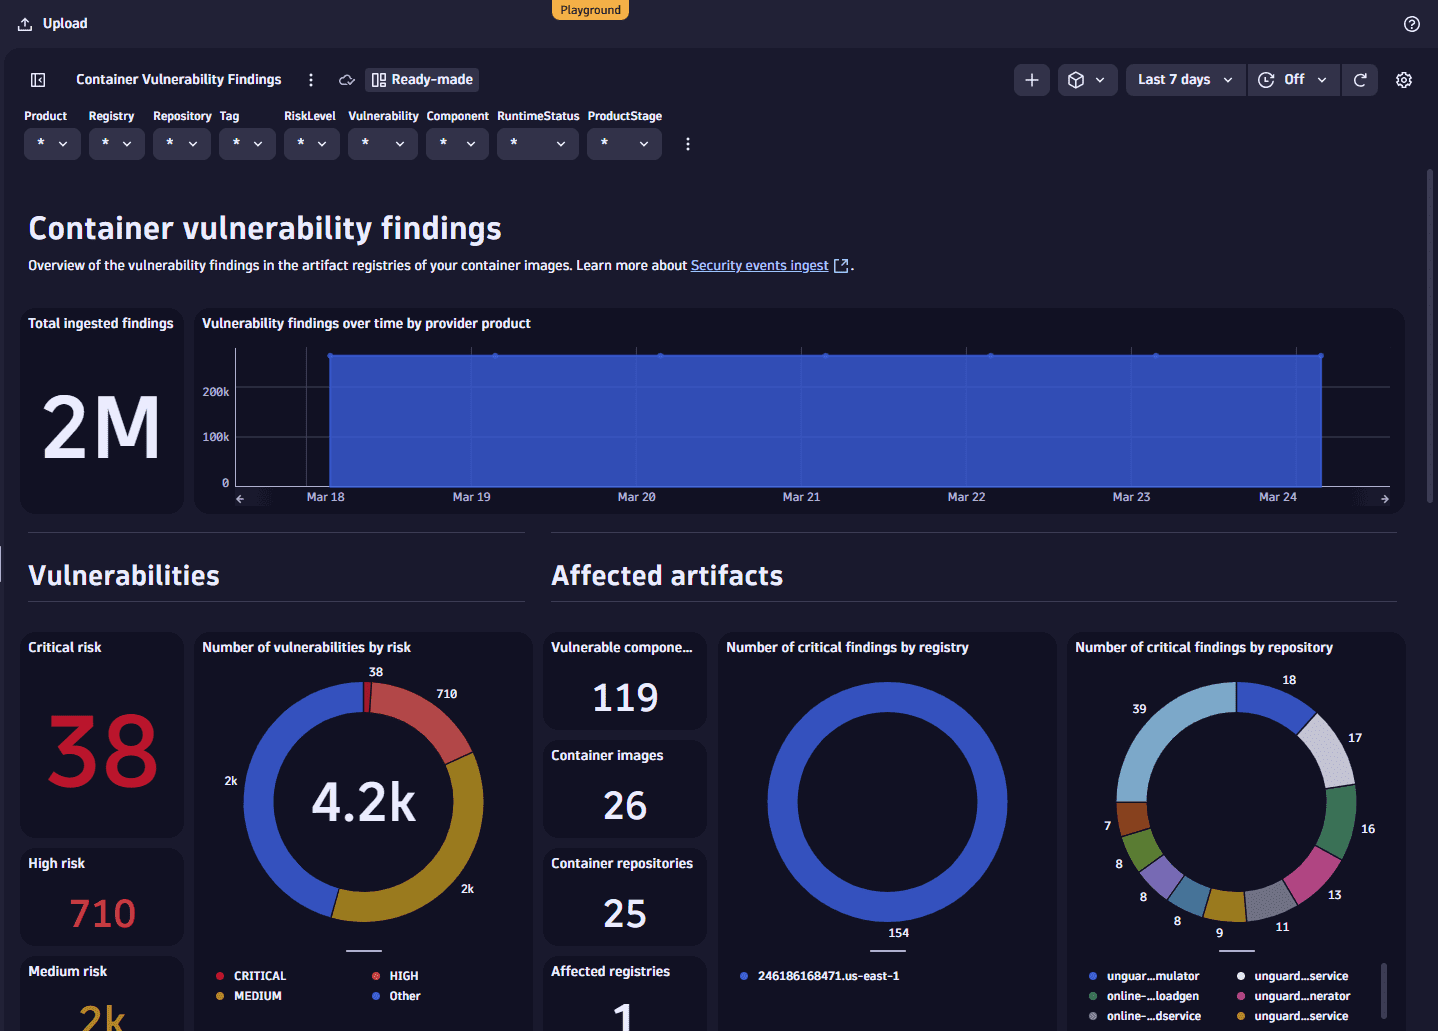
Container Vulnerability Findings
Overview of the vulnerability findings in the artifact registries of your container images.
Related documentation: Security integrations
Dashboards - Getting started
Gives you a starting point with Dashboards and guides you to further resources.
Related Dynatrace app:  Dashboards
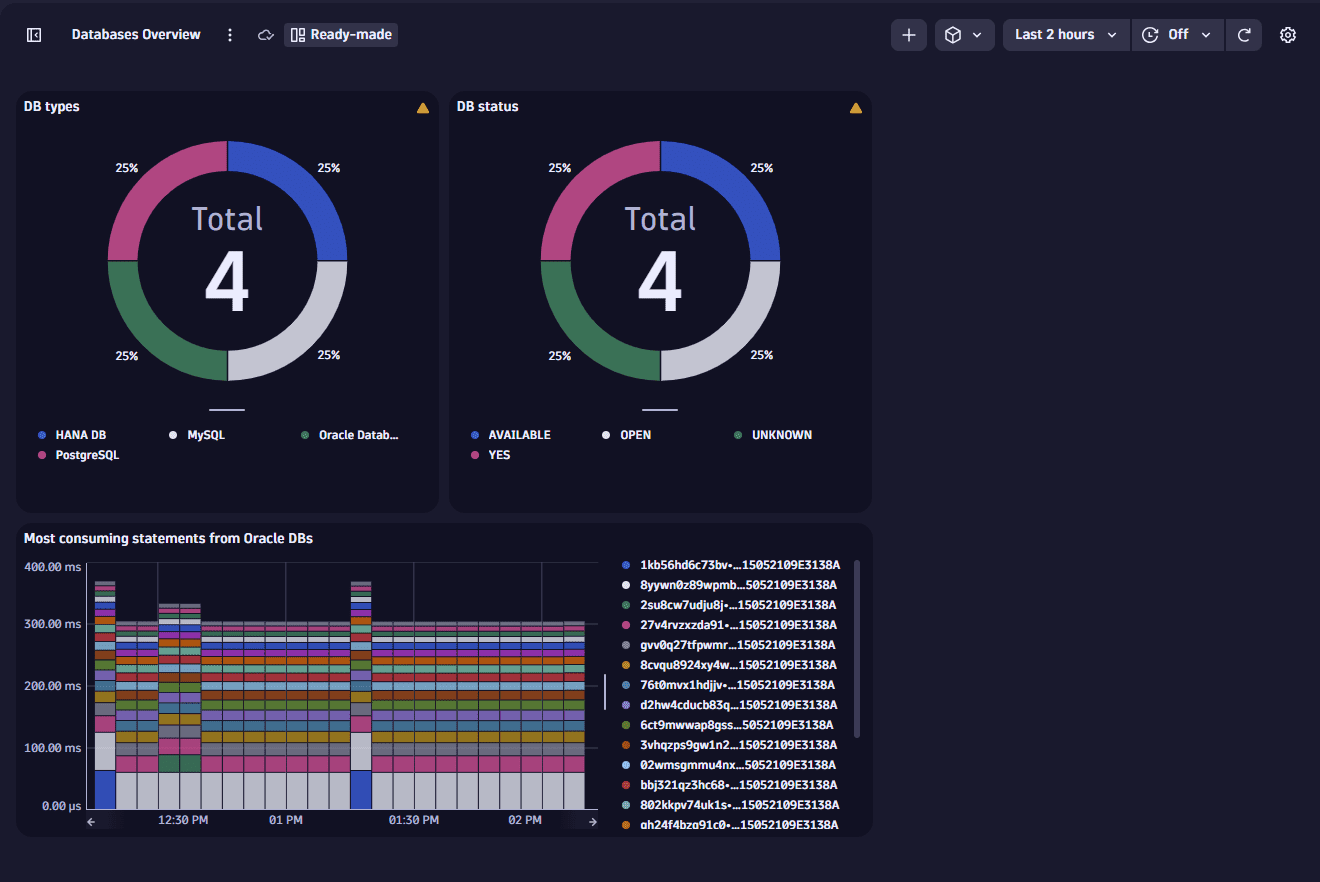
Databases Overview
A database overview by database type, database status, and, for Oracle databases, the statements with the highest consumption.
Related Dynatrace app:  Databases app
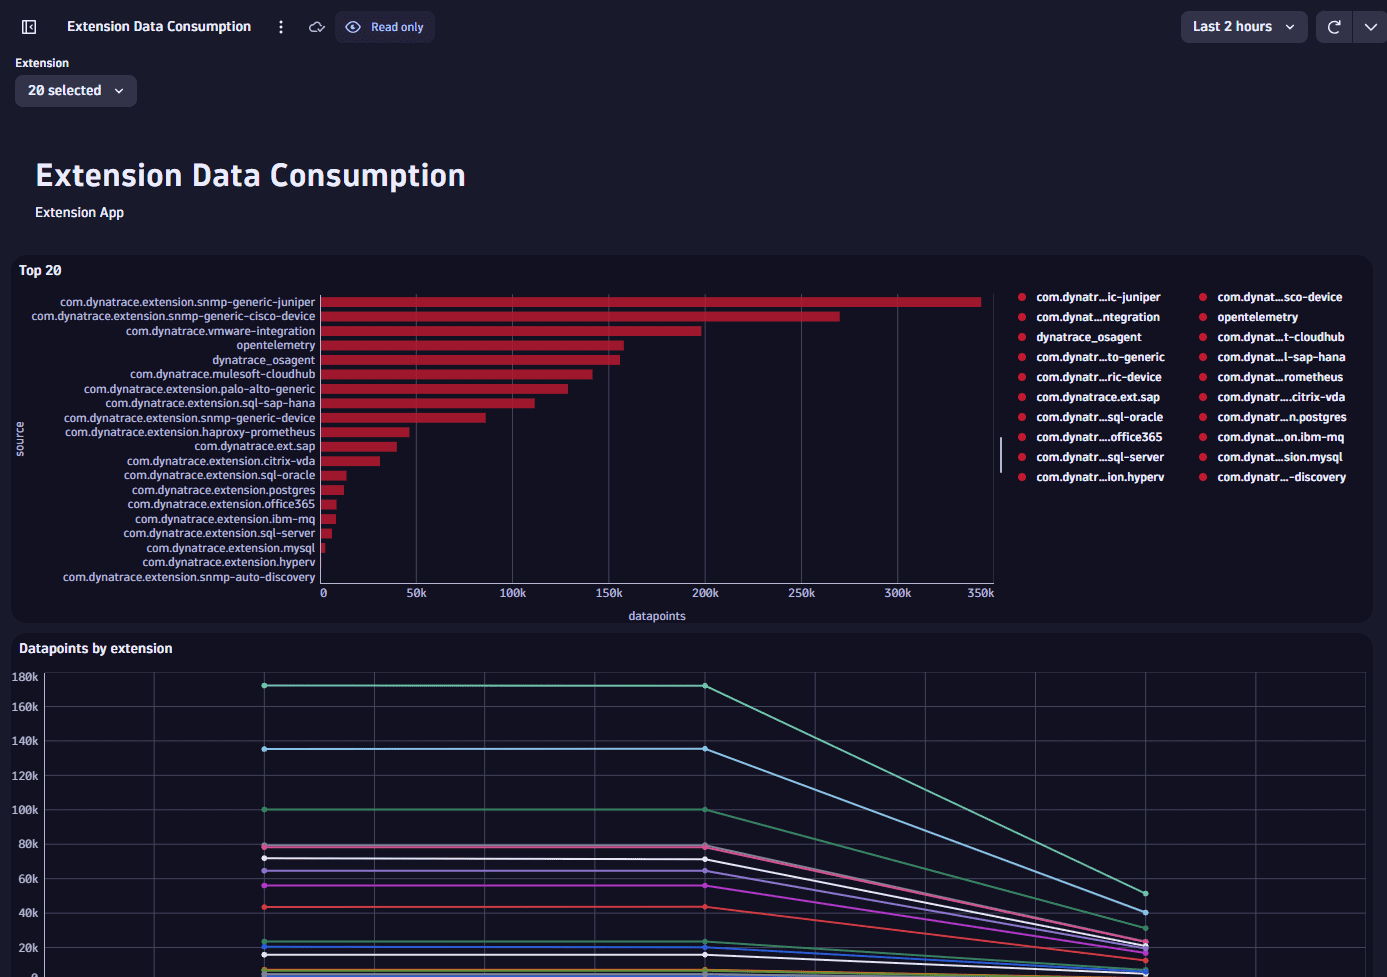
Extension Data Consumption
Control datapoints consumed by particular extensions.
Related Dynatrace app:  Extensions
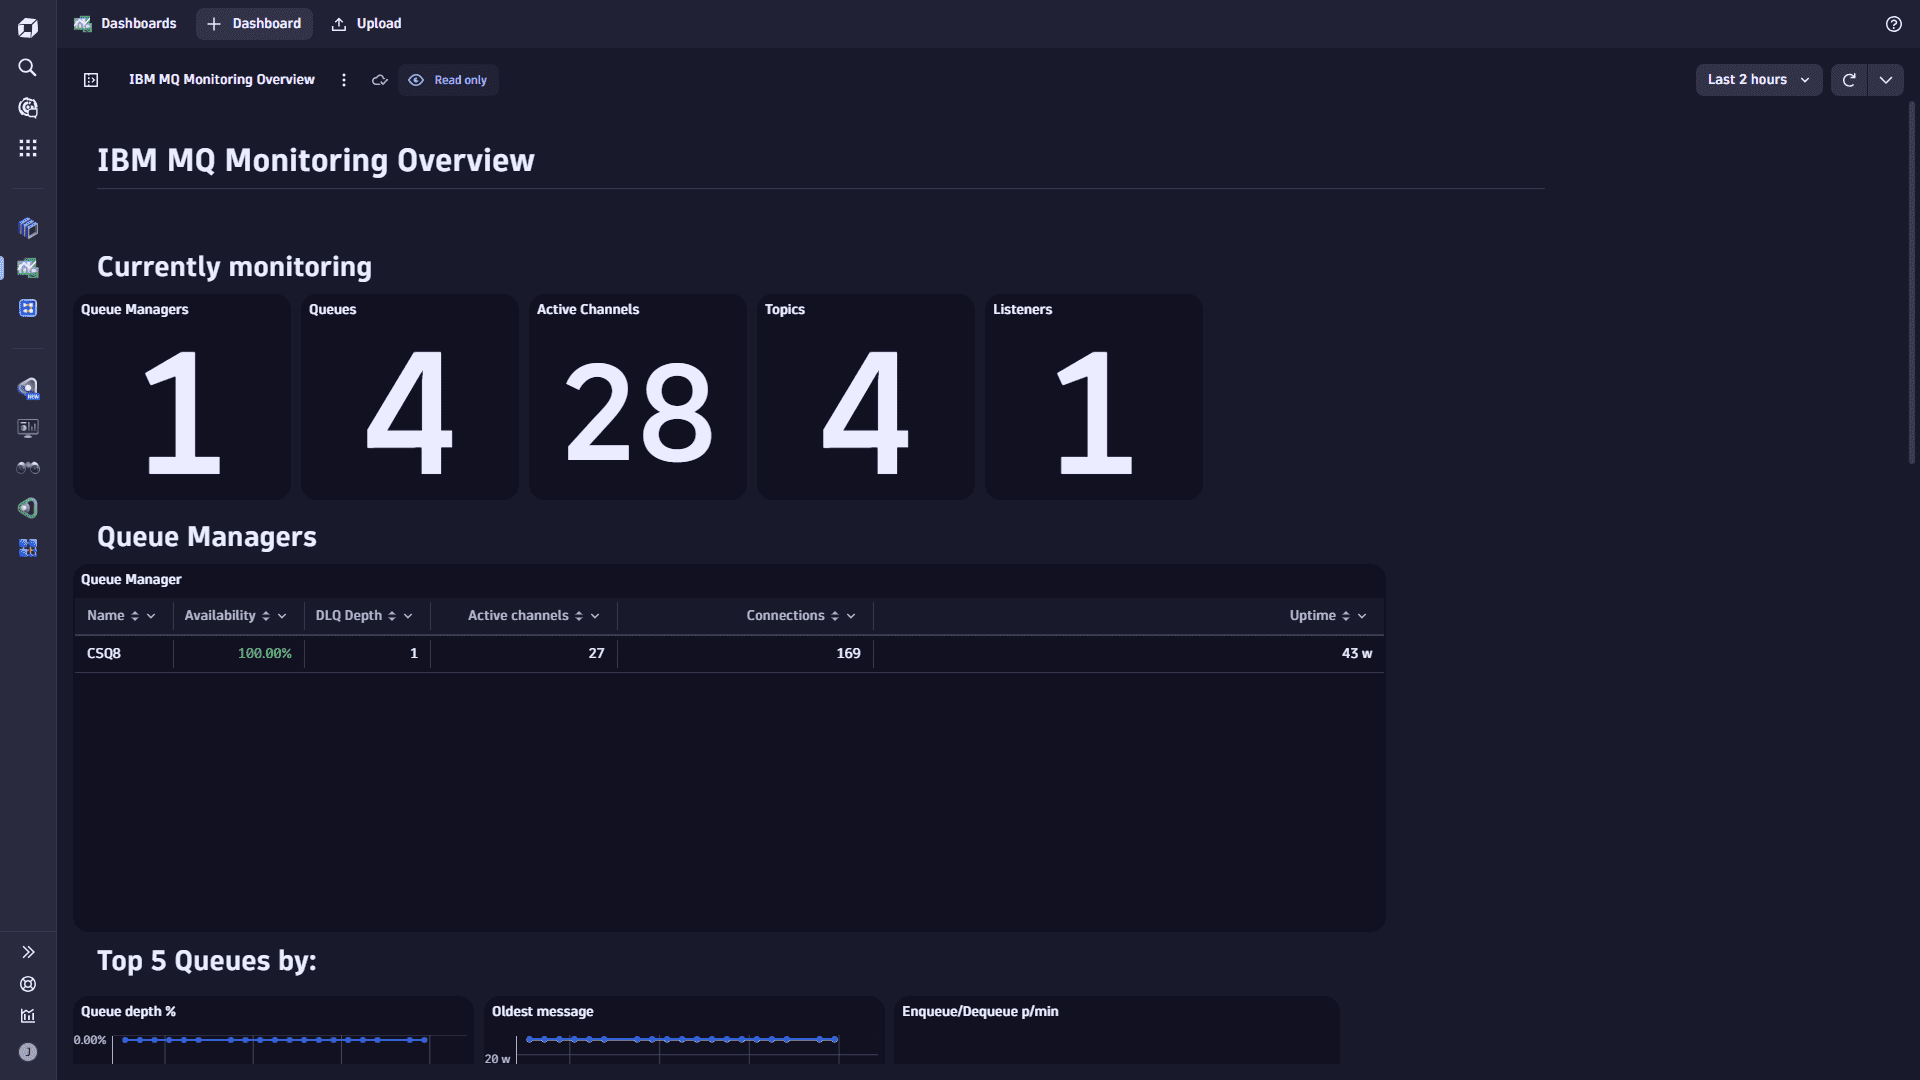
IBM MQ Monitoring Overview
Display select metrics for IBM MQ queue managers, queues, channels, topics, and listeners.
Related Dynatrace app:  Extensions
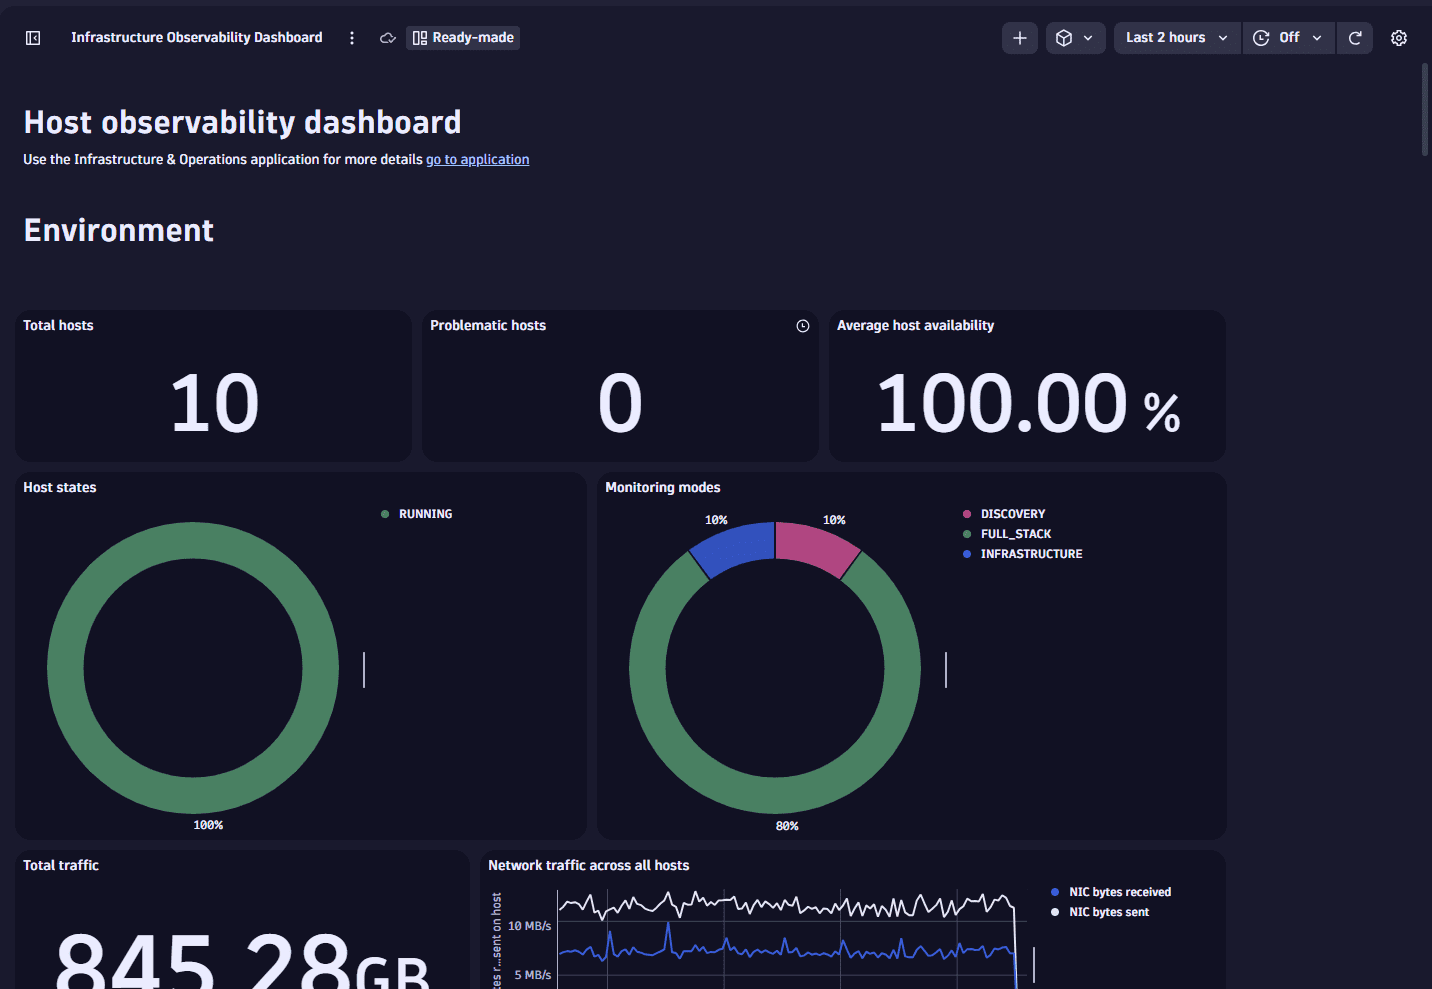
Infrastructure Observability Dashboard
Offers an overview of host observability, with a breakdown by environment, impacted hosts, host analysis, technologies and processes, metrics, network, and logs.
Related Dynatrace app:  Infrastructure & Operations
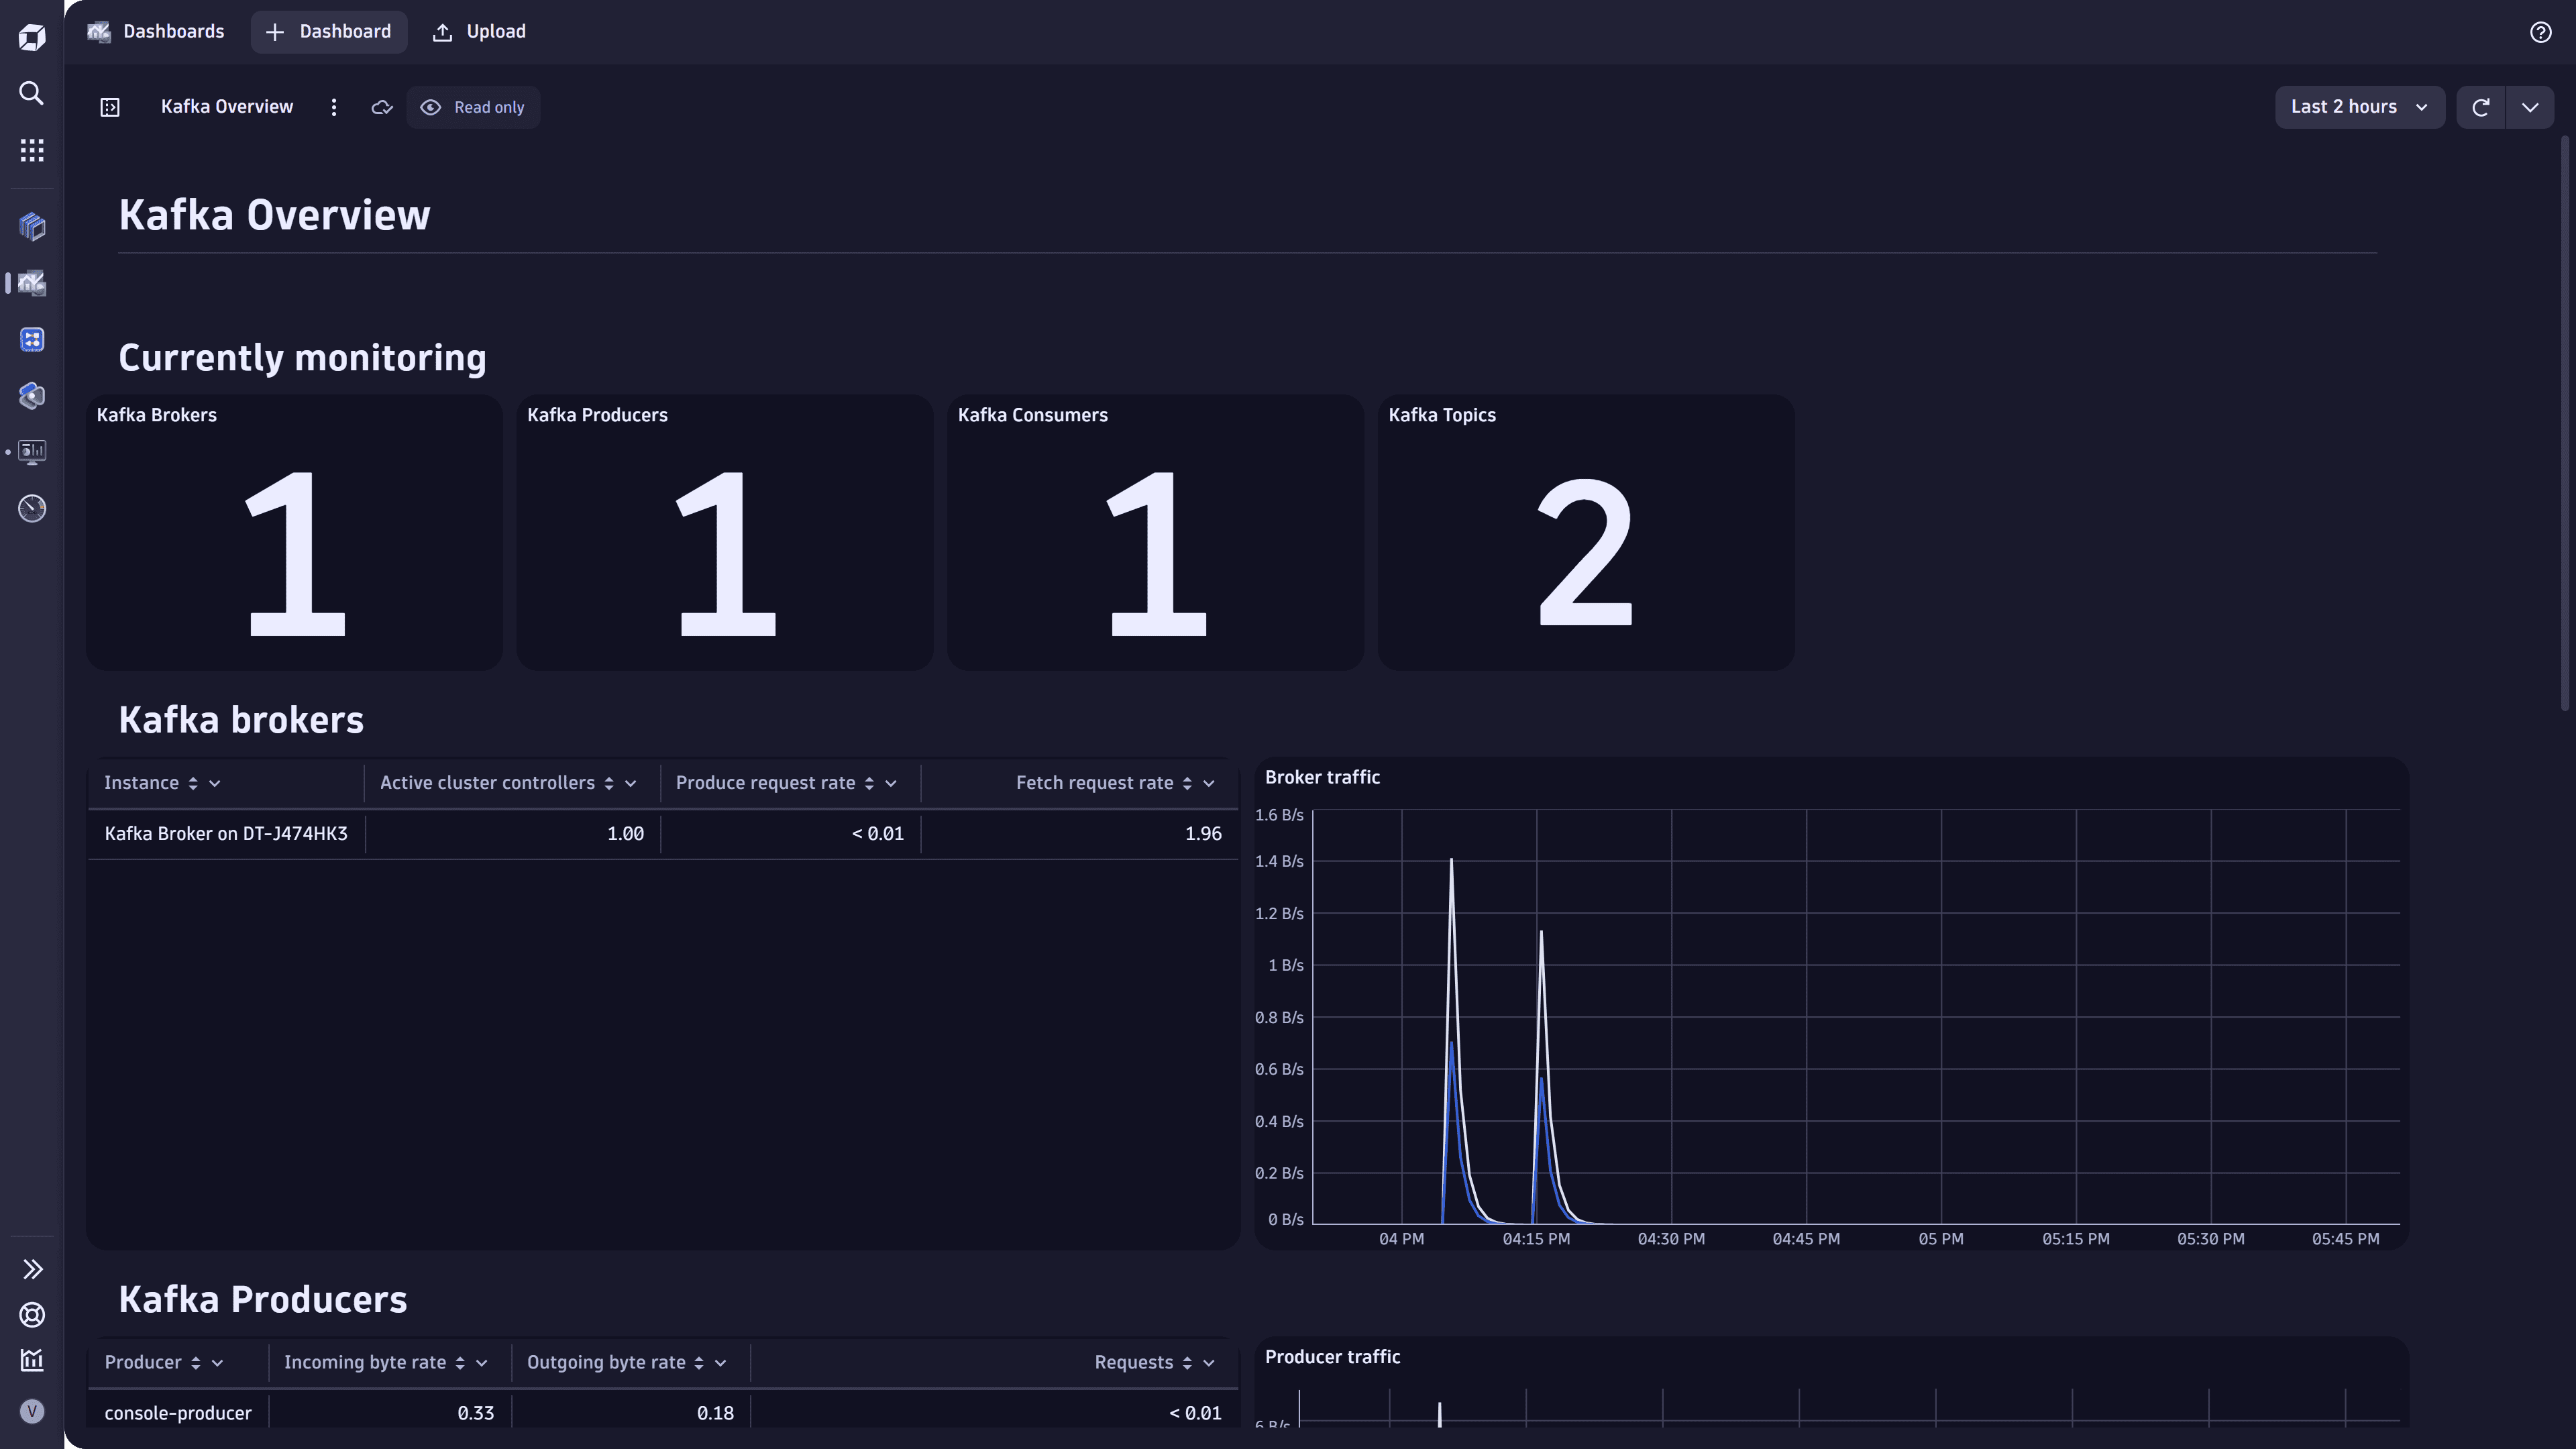
Kafka Overview
Display the most important metrics of the extension and as an entry point for the entities
Related Dynatrace app:  Extensions
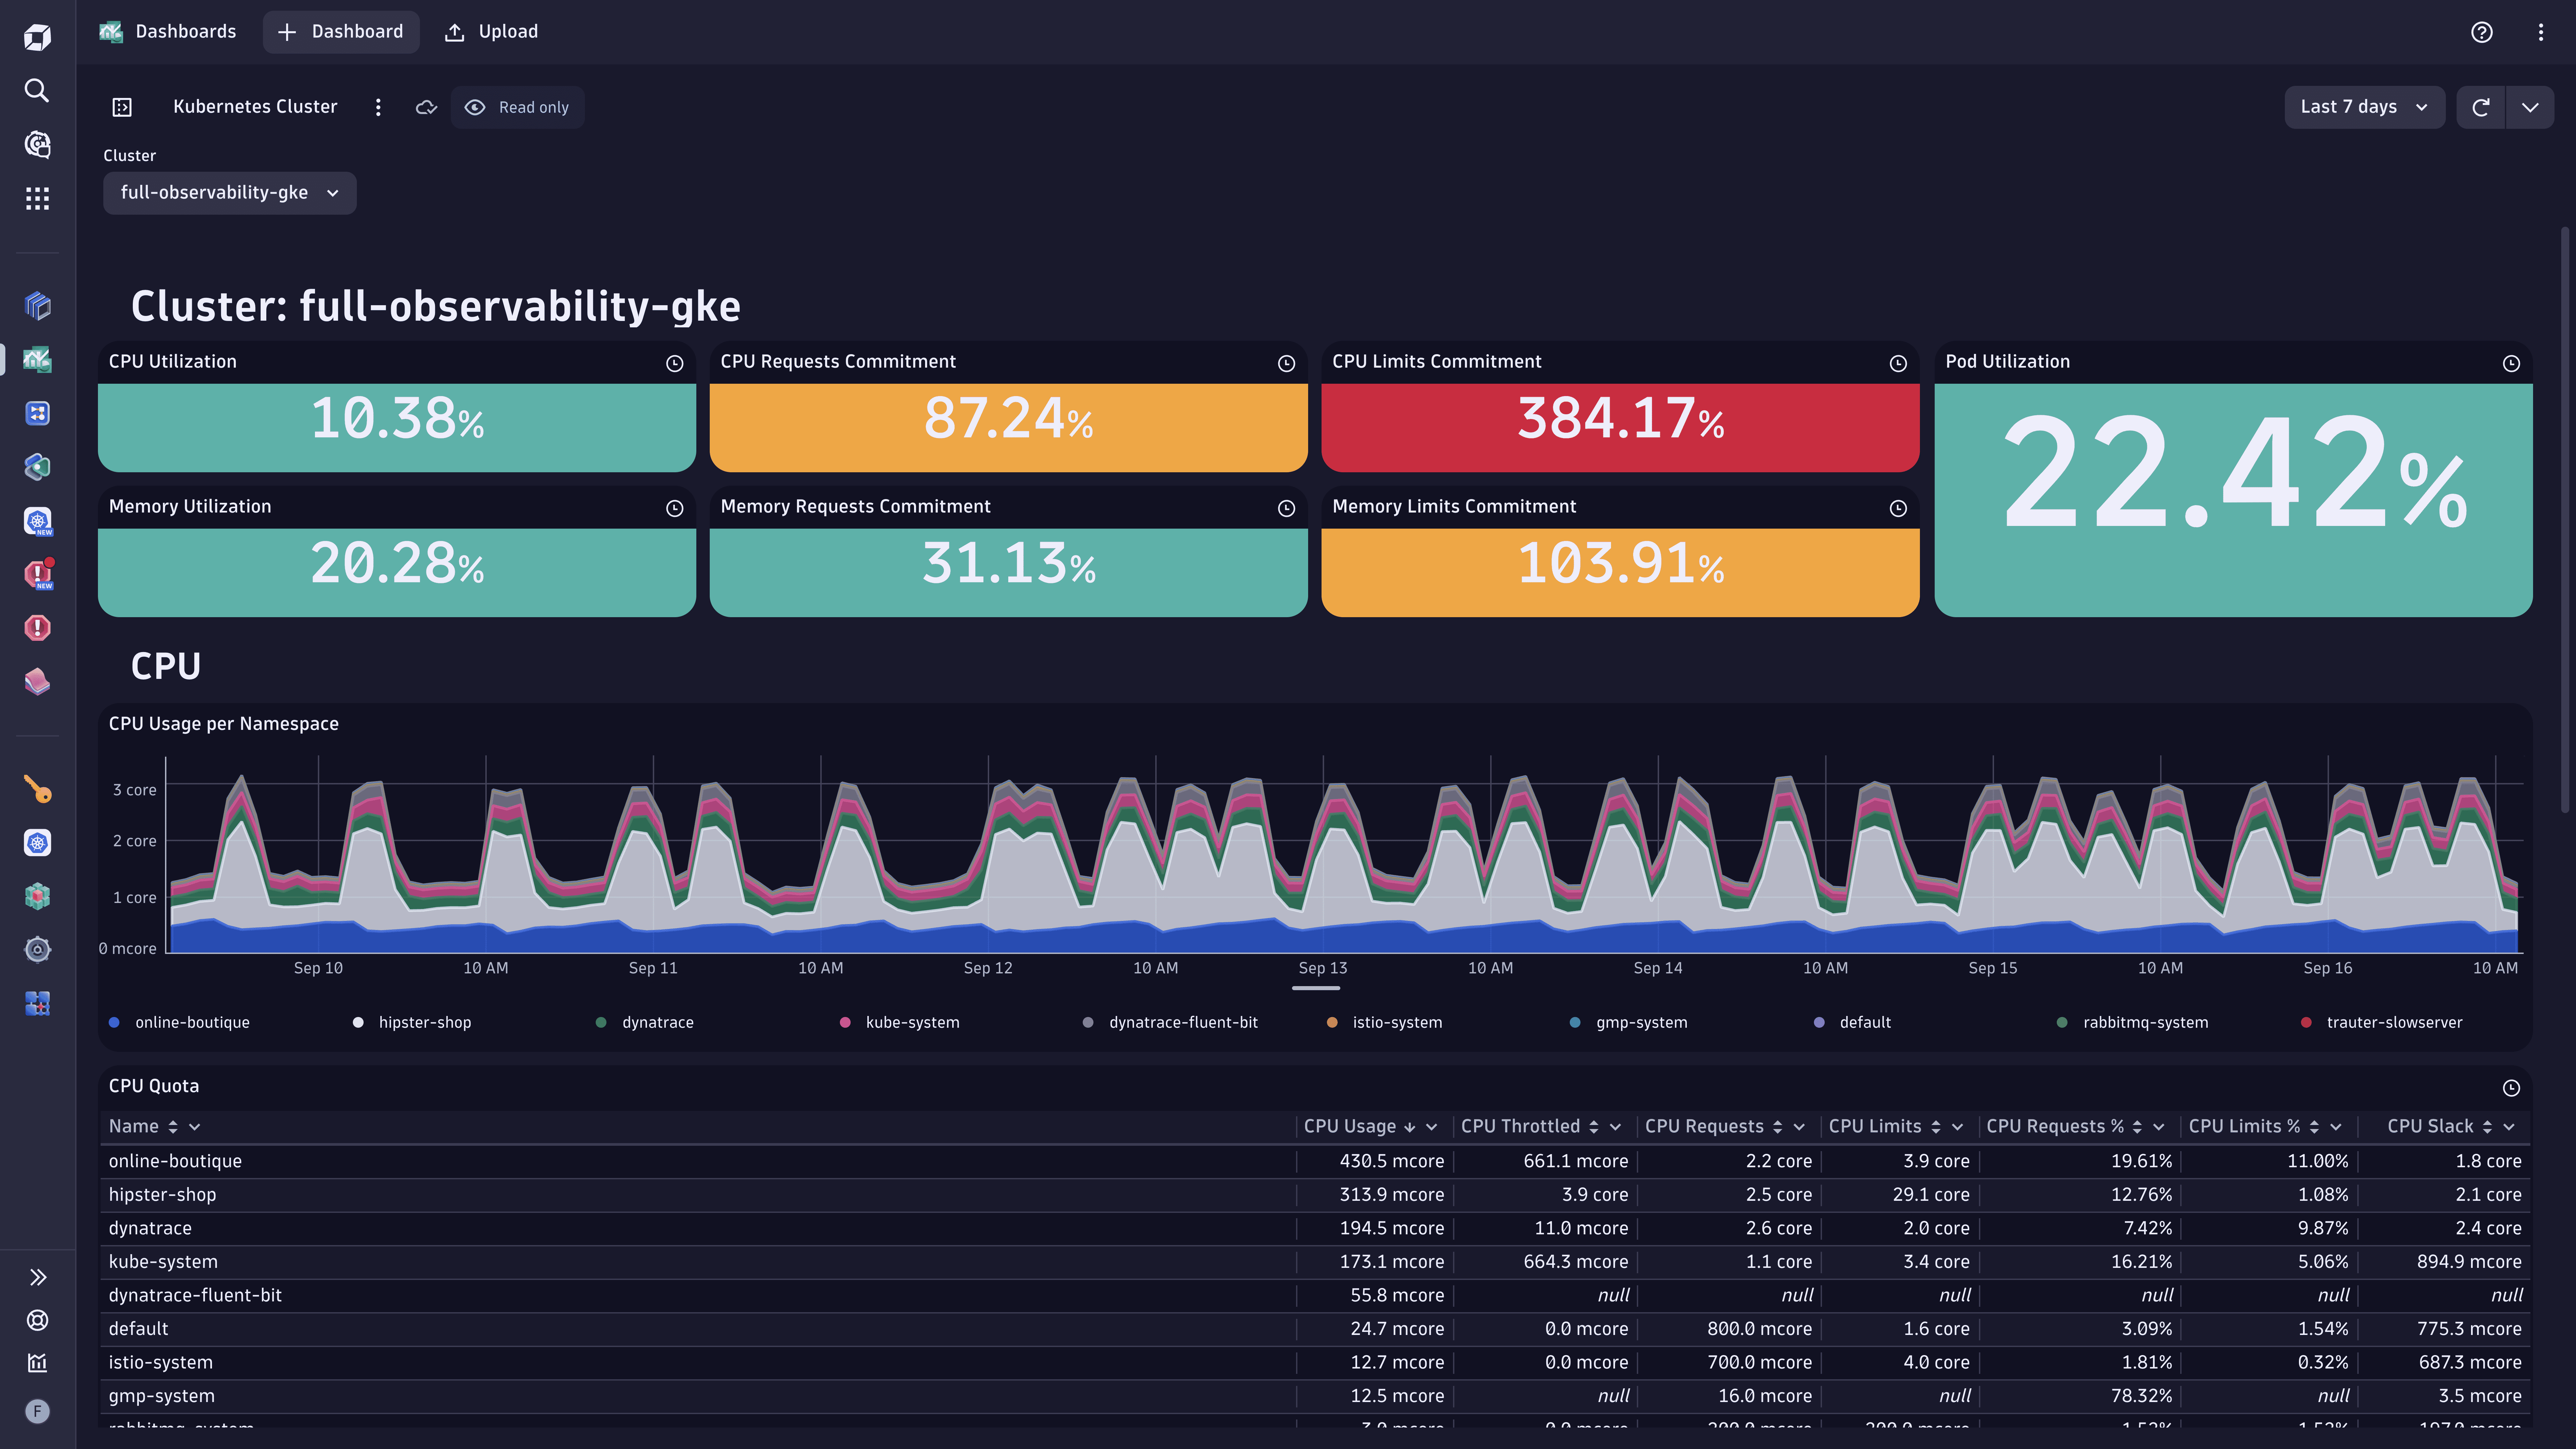
Kubernetes Cluster
Get broad visibility into the scale, status, and resource usage of your Kubernetes clusters.
Related Dynatrace app:  Kubernetes
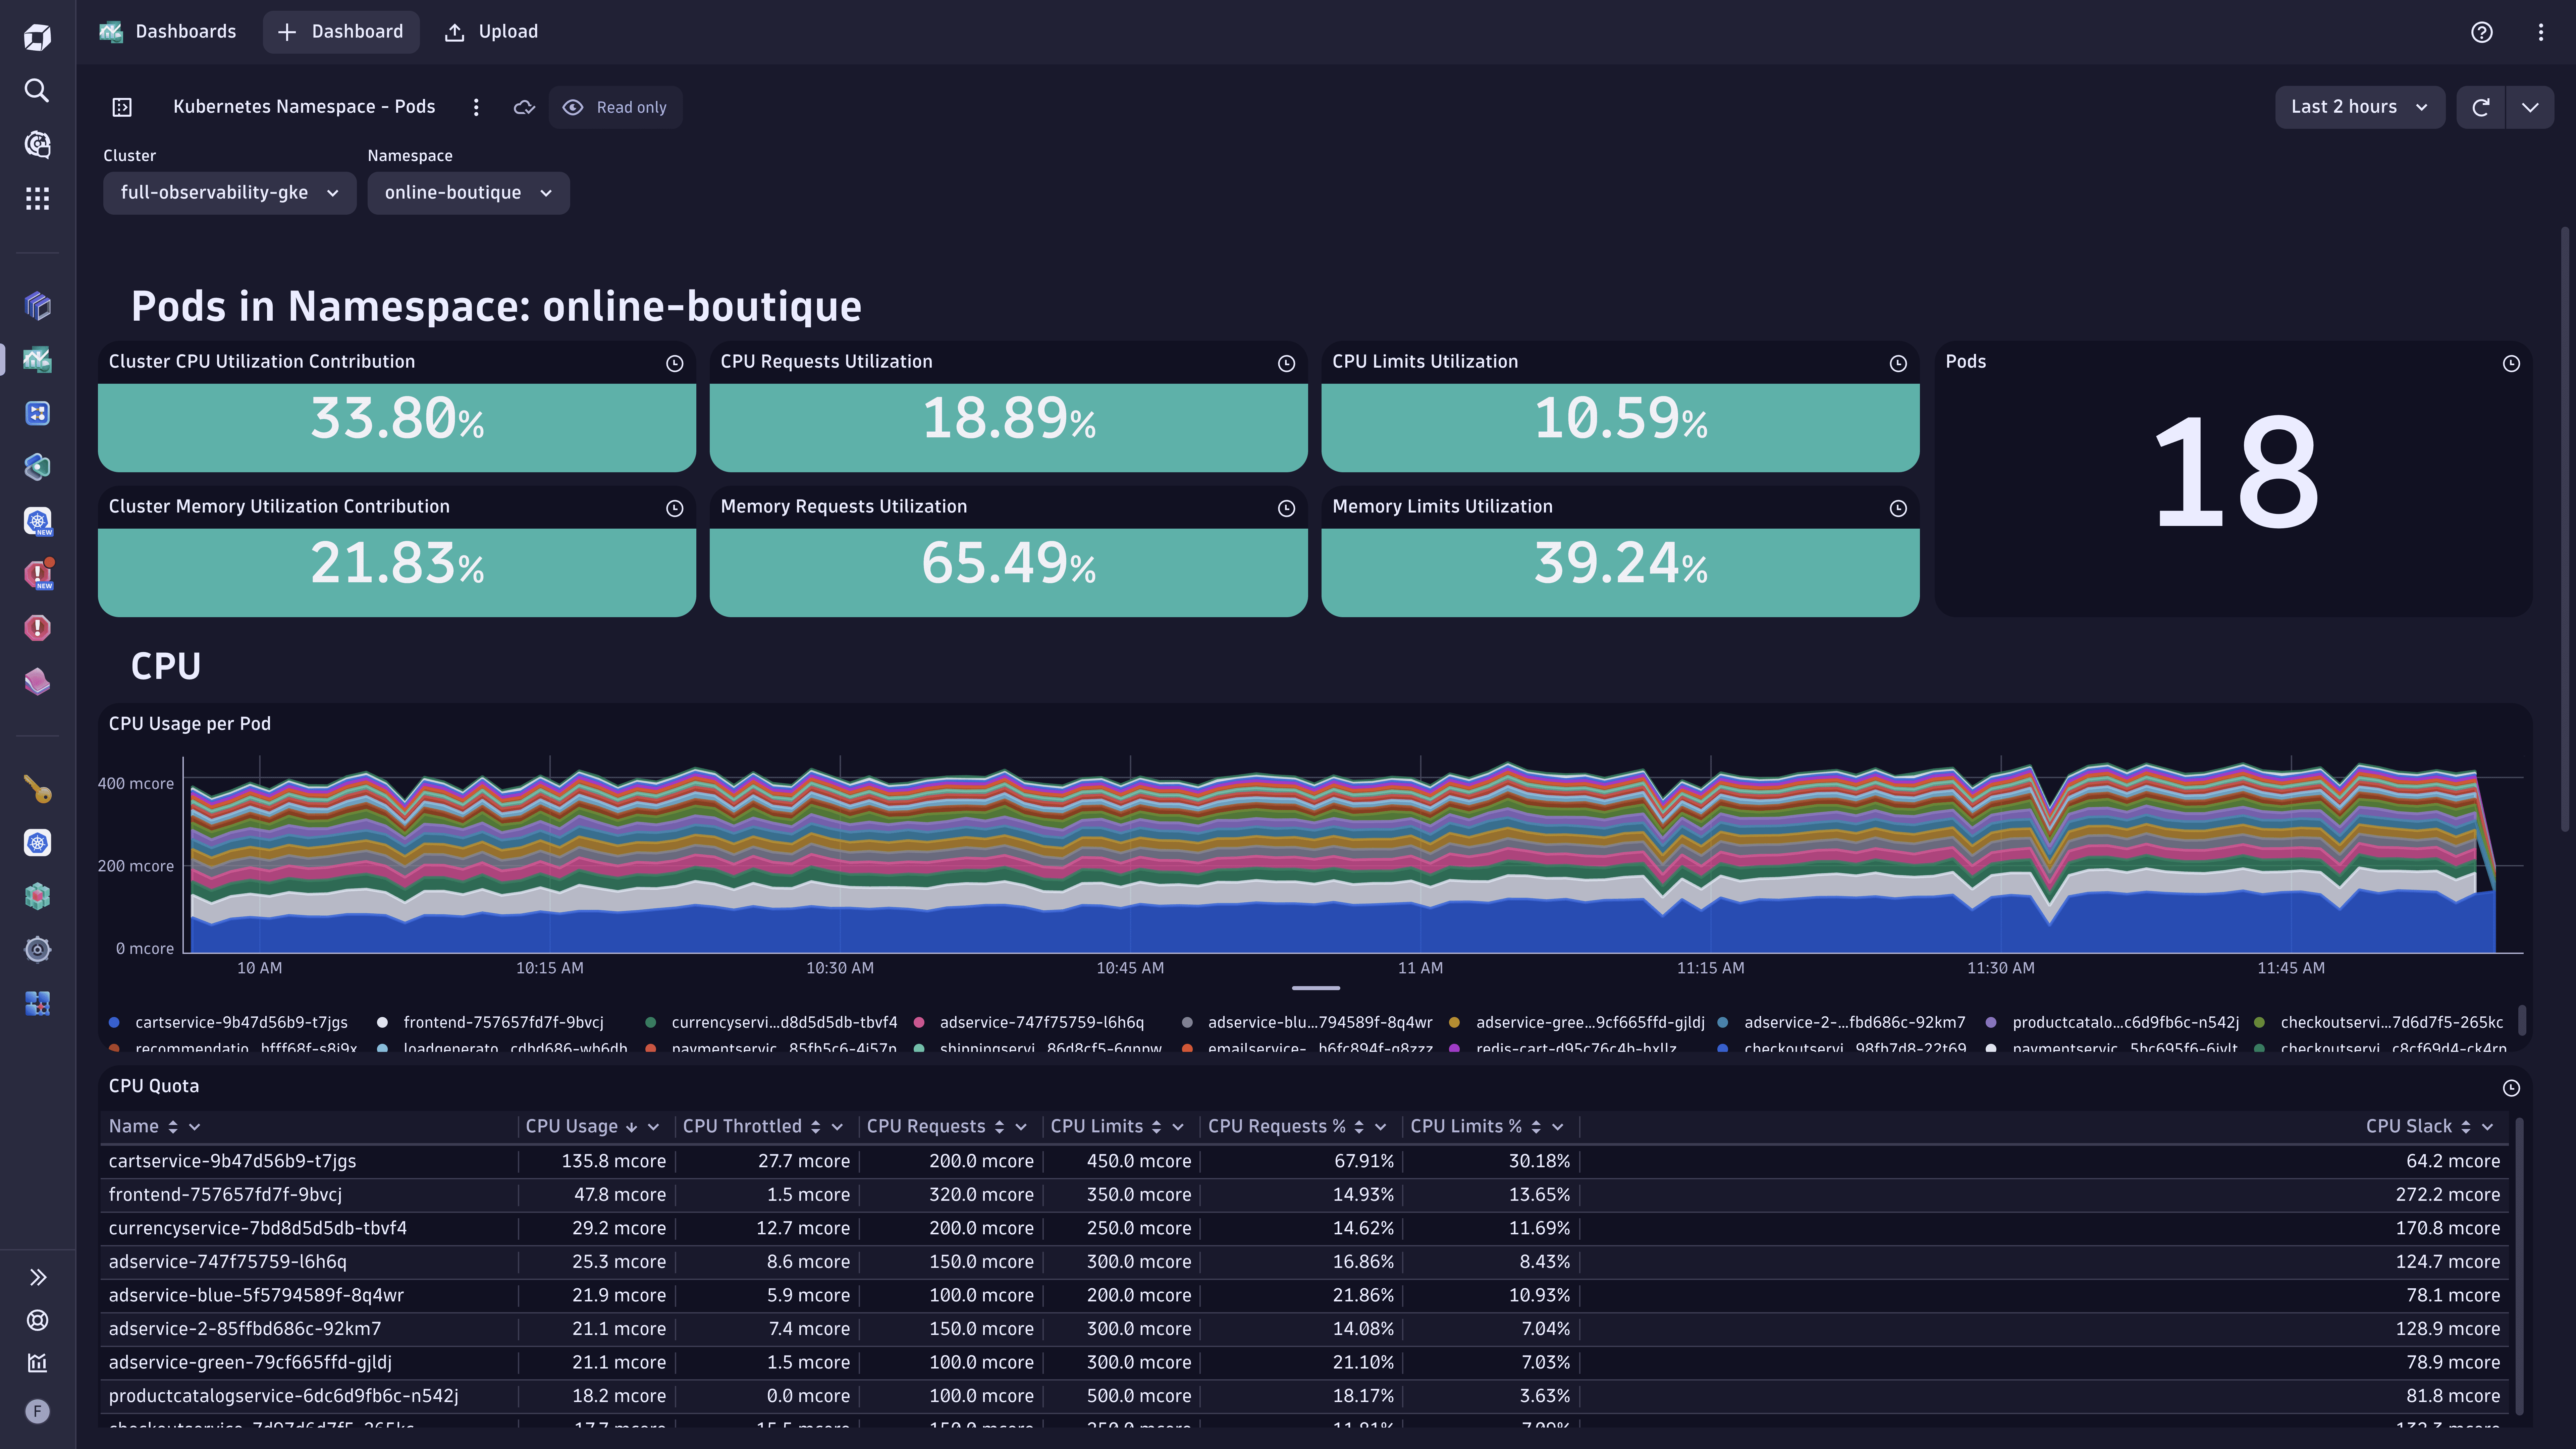
Kubernetes Namespace - Pods
Analyze resource allocation of all pods within a namespace.
Related Dynatrace app:  Kubernetes
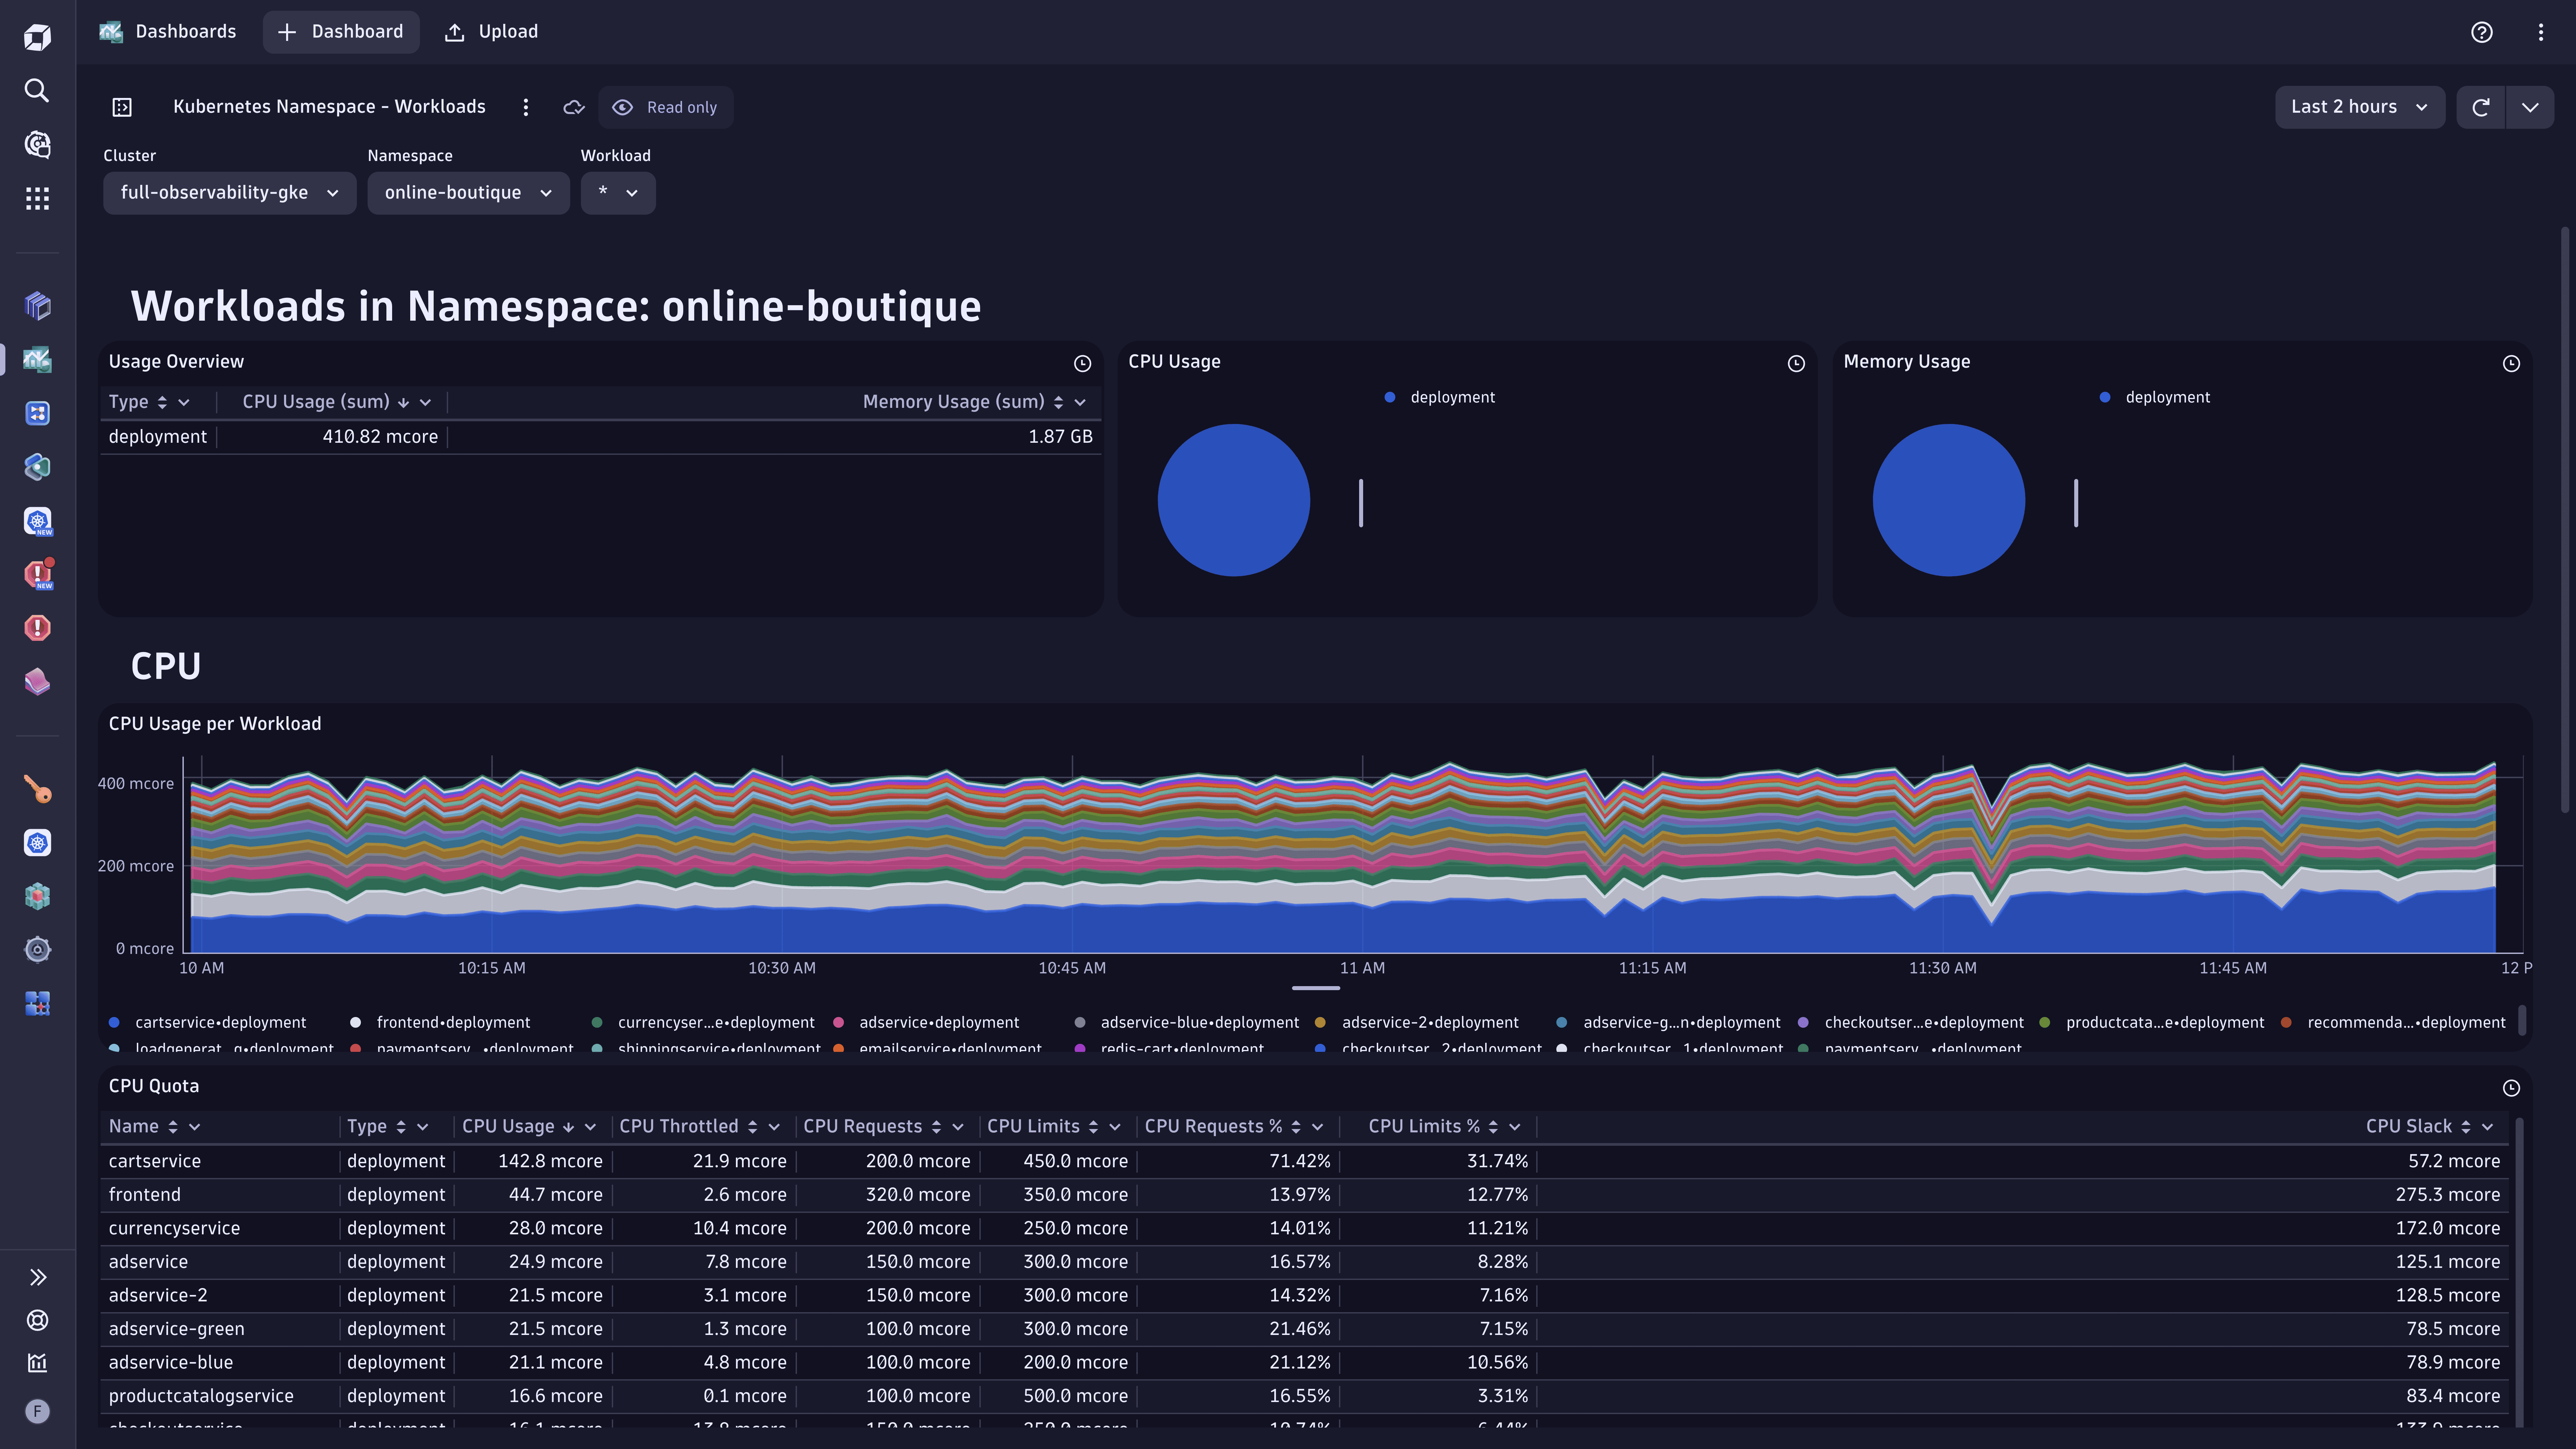
Kubernetes Namespace - Workloads
Explore the resource utilization distribution across workloads in your namespace.
Related Dynatrace app:  Kubernetes
Kubernetes Node - Pods
Understand pod resource consumption on your Kubernetes nodes.
Related Dynatrace app:  Kubernetes
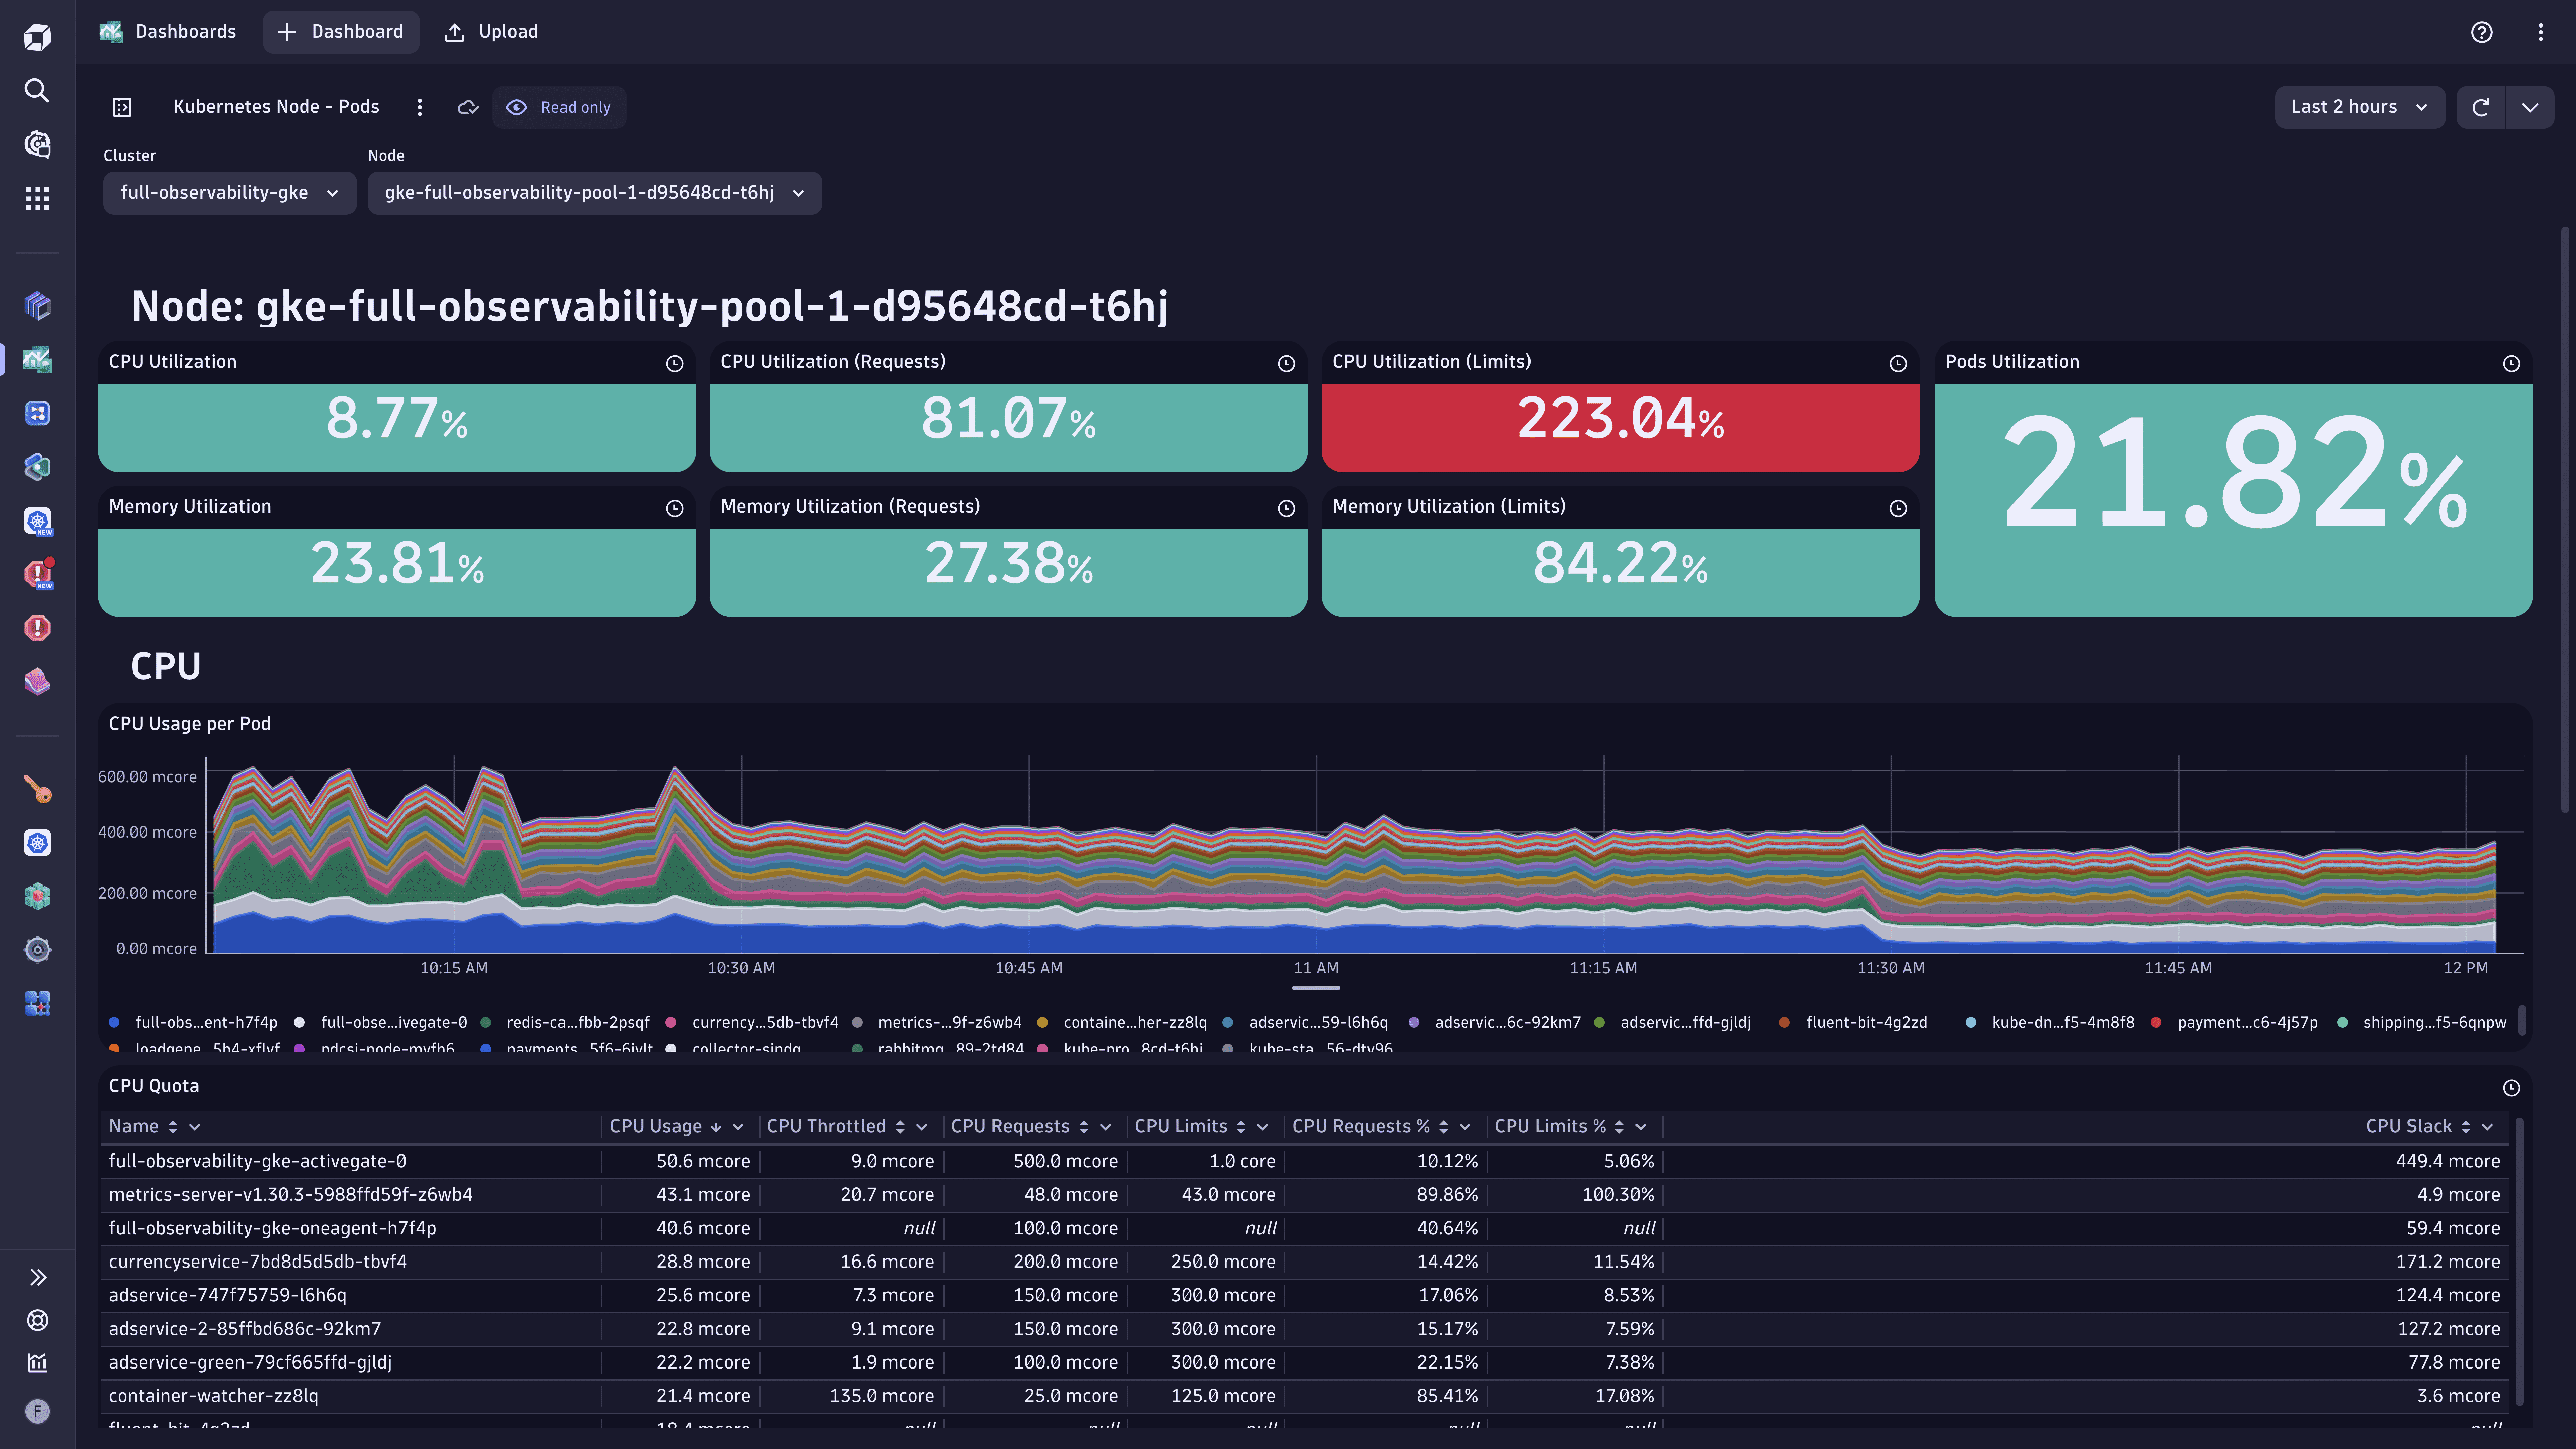
Kubernetes Persistent Volumes
Inspect the utilization and size of your persistent volume claims.
Related Dynatrace app:  Kubernetes
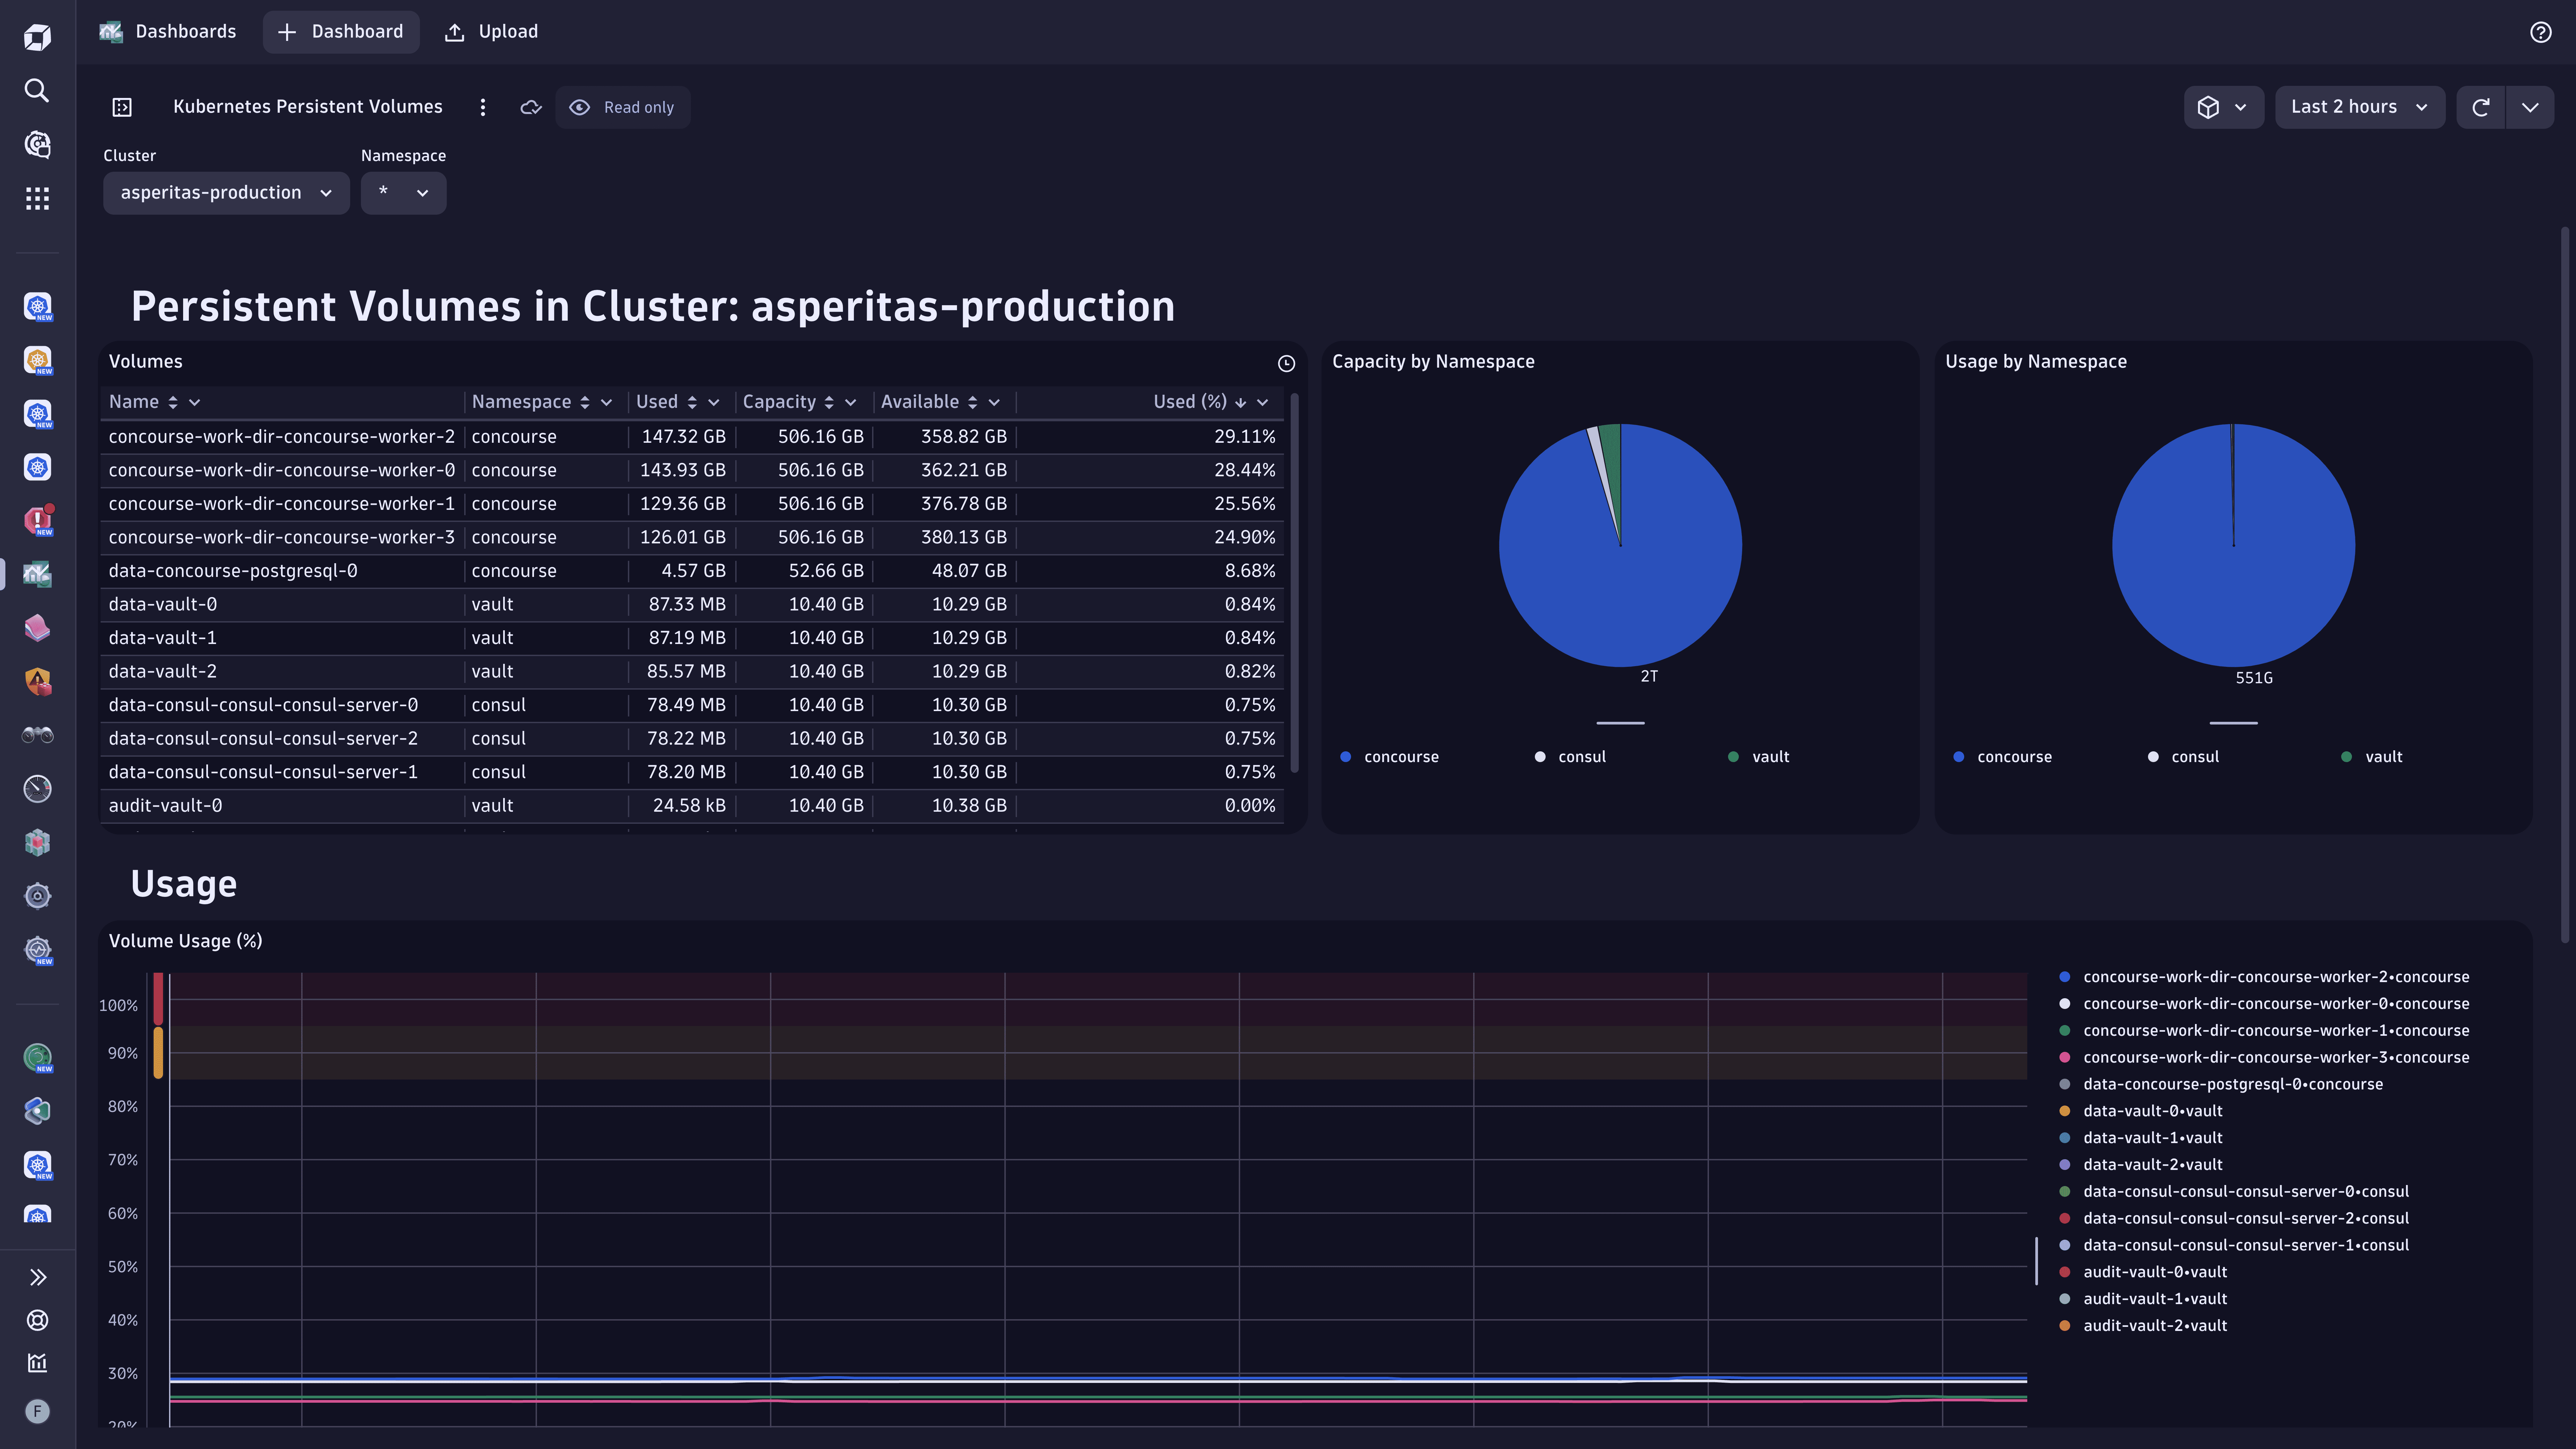
Log ingest overview
Get an overview of the log ingest volume and status of the log ingest pipeline. Identify log ingest issues and explore possible remediation steps.
Related Dynatrace app:  Logs
Logs
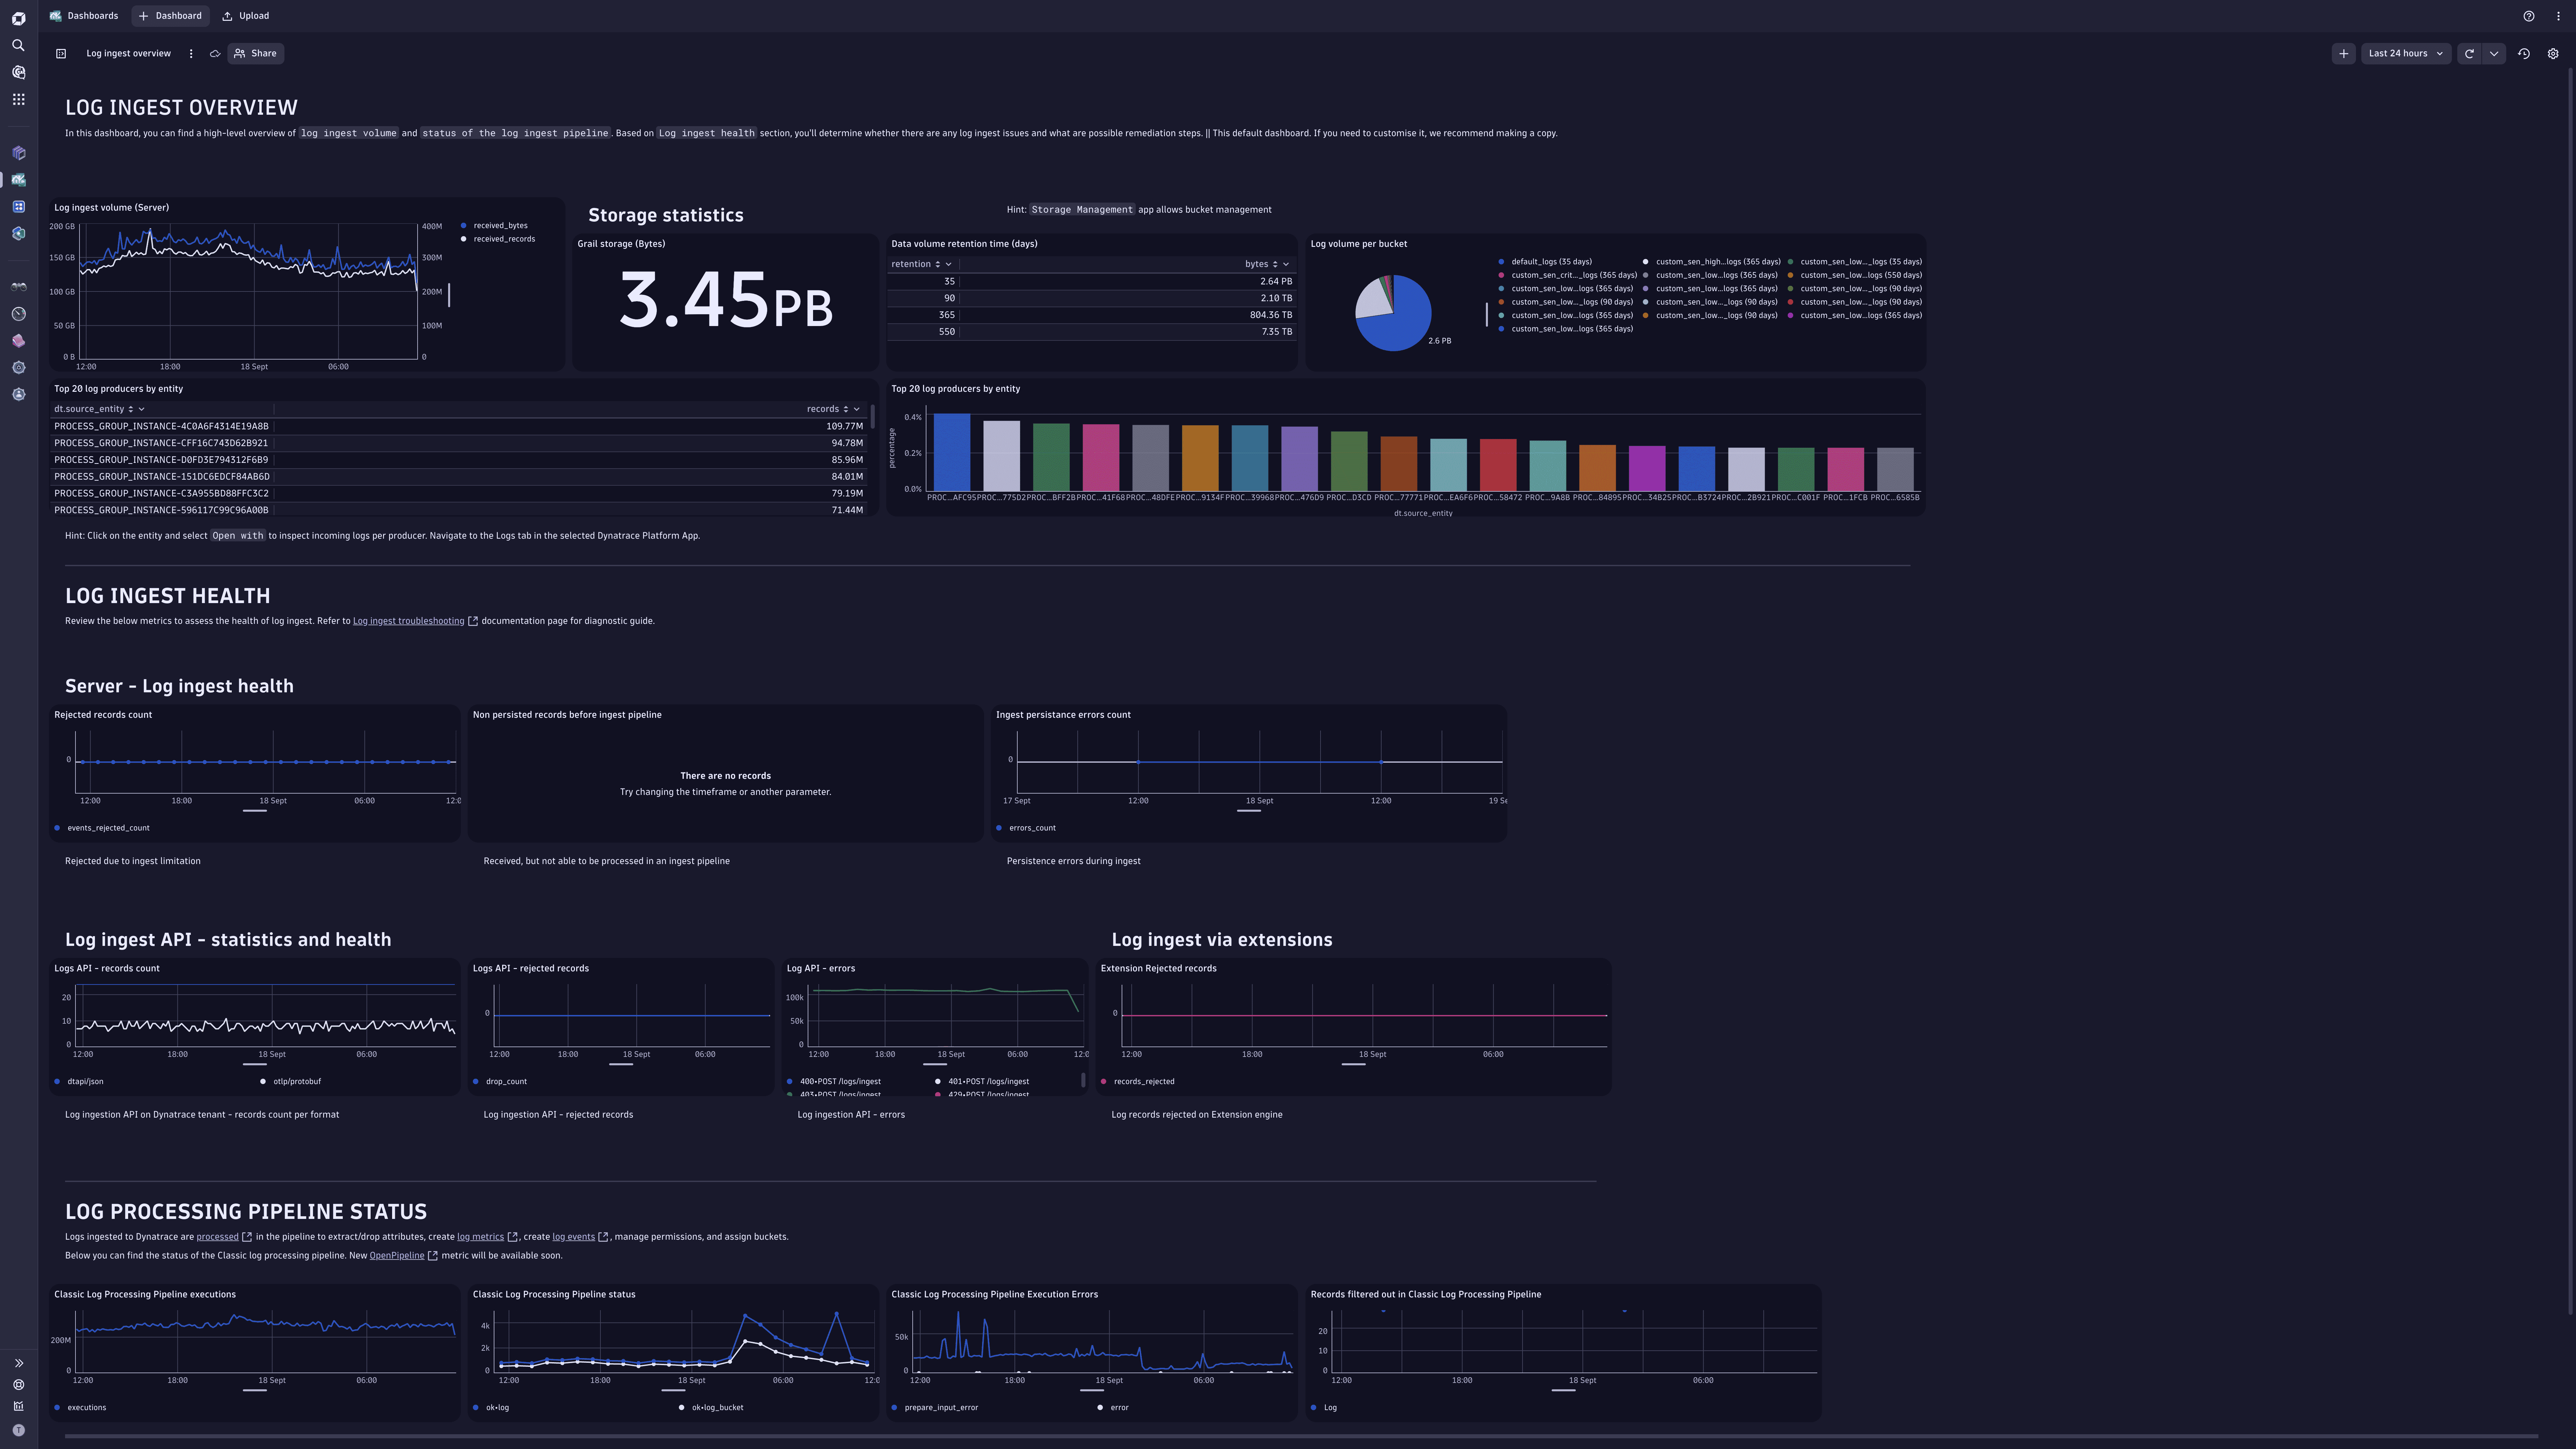
Log query usage and costs
Get an overview of log query usage across the Dynatrace Platform and optimization tips for the environment administrator.
Related Dynatrace app:  Logs
Logs
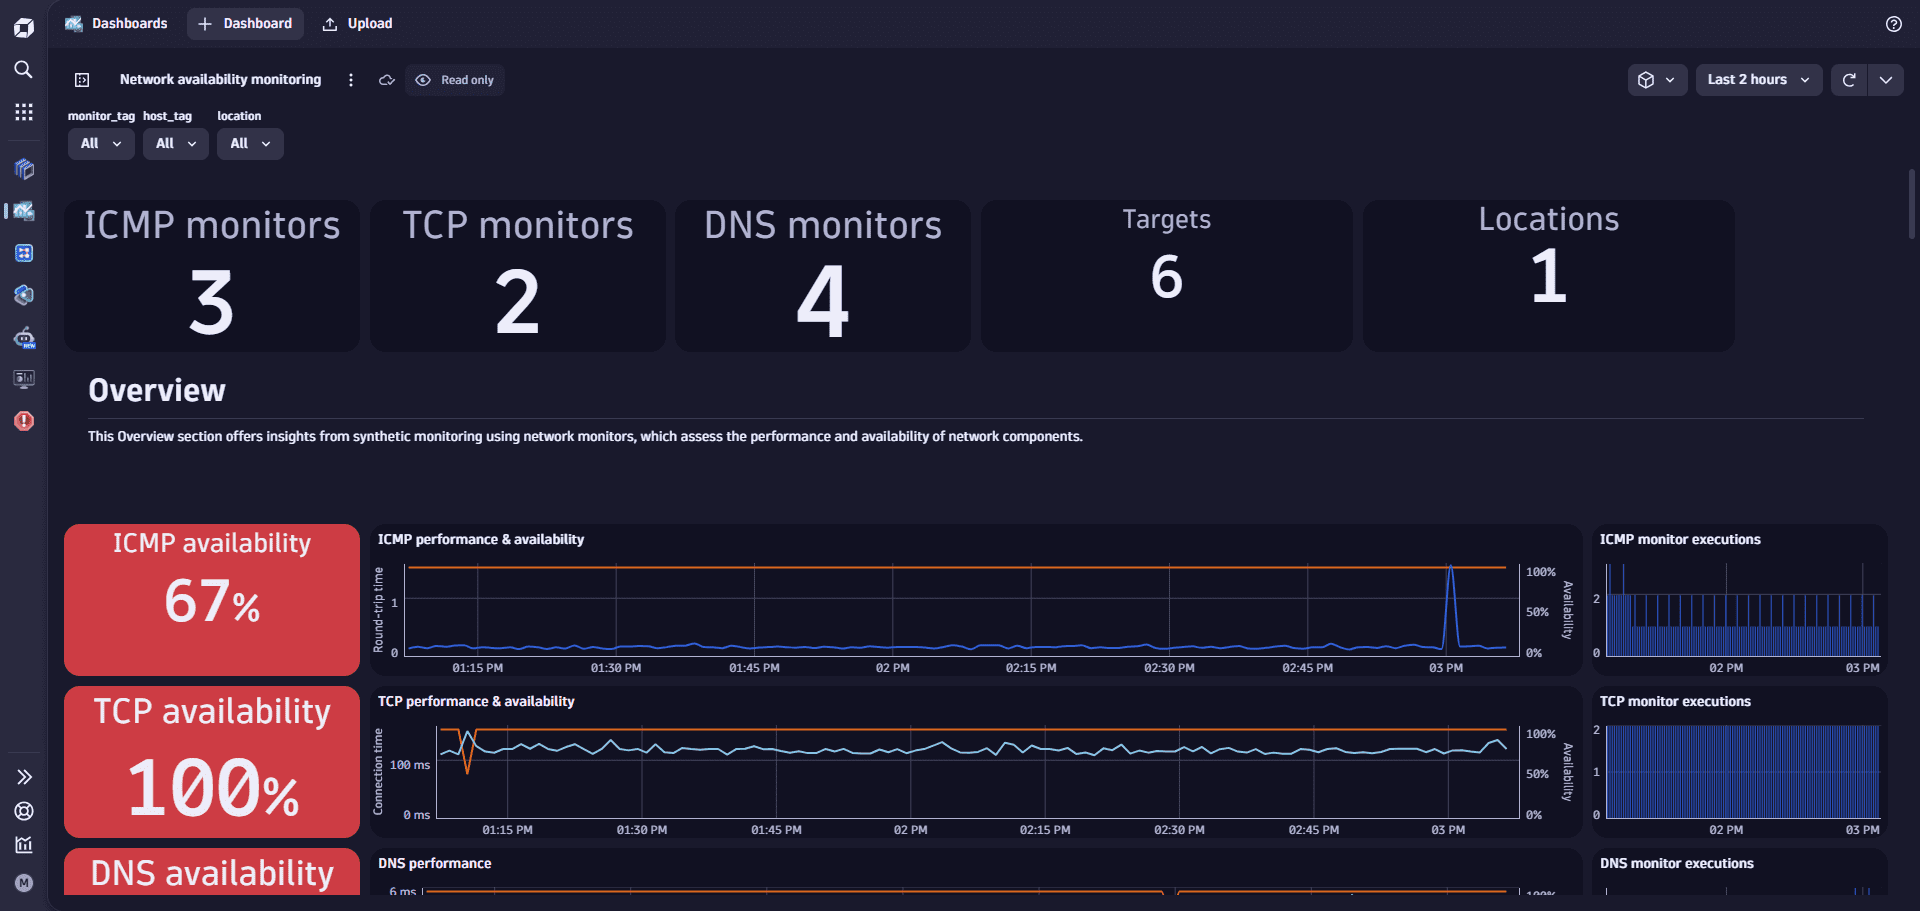
Network availability monitoring
Gain insights from synthetic monitoring using network availability monitors, which assess the performance and availability of network components. Following an overview, dashboard sections focus on ICMP, TCP, and DNS.
Related Dynatrace app:  Synthetic
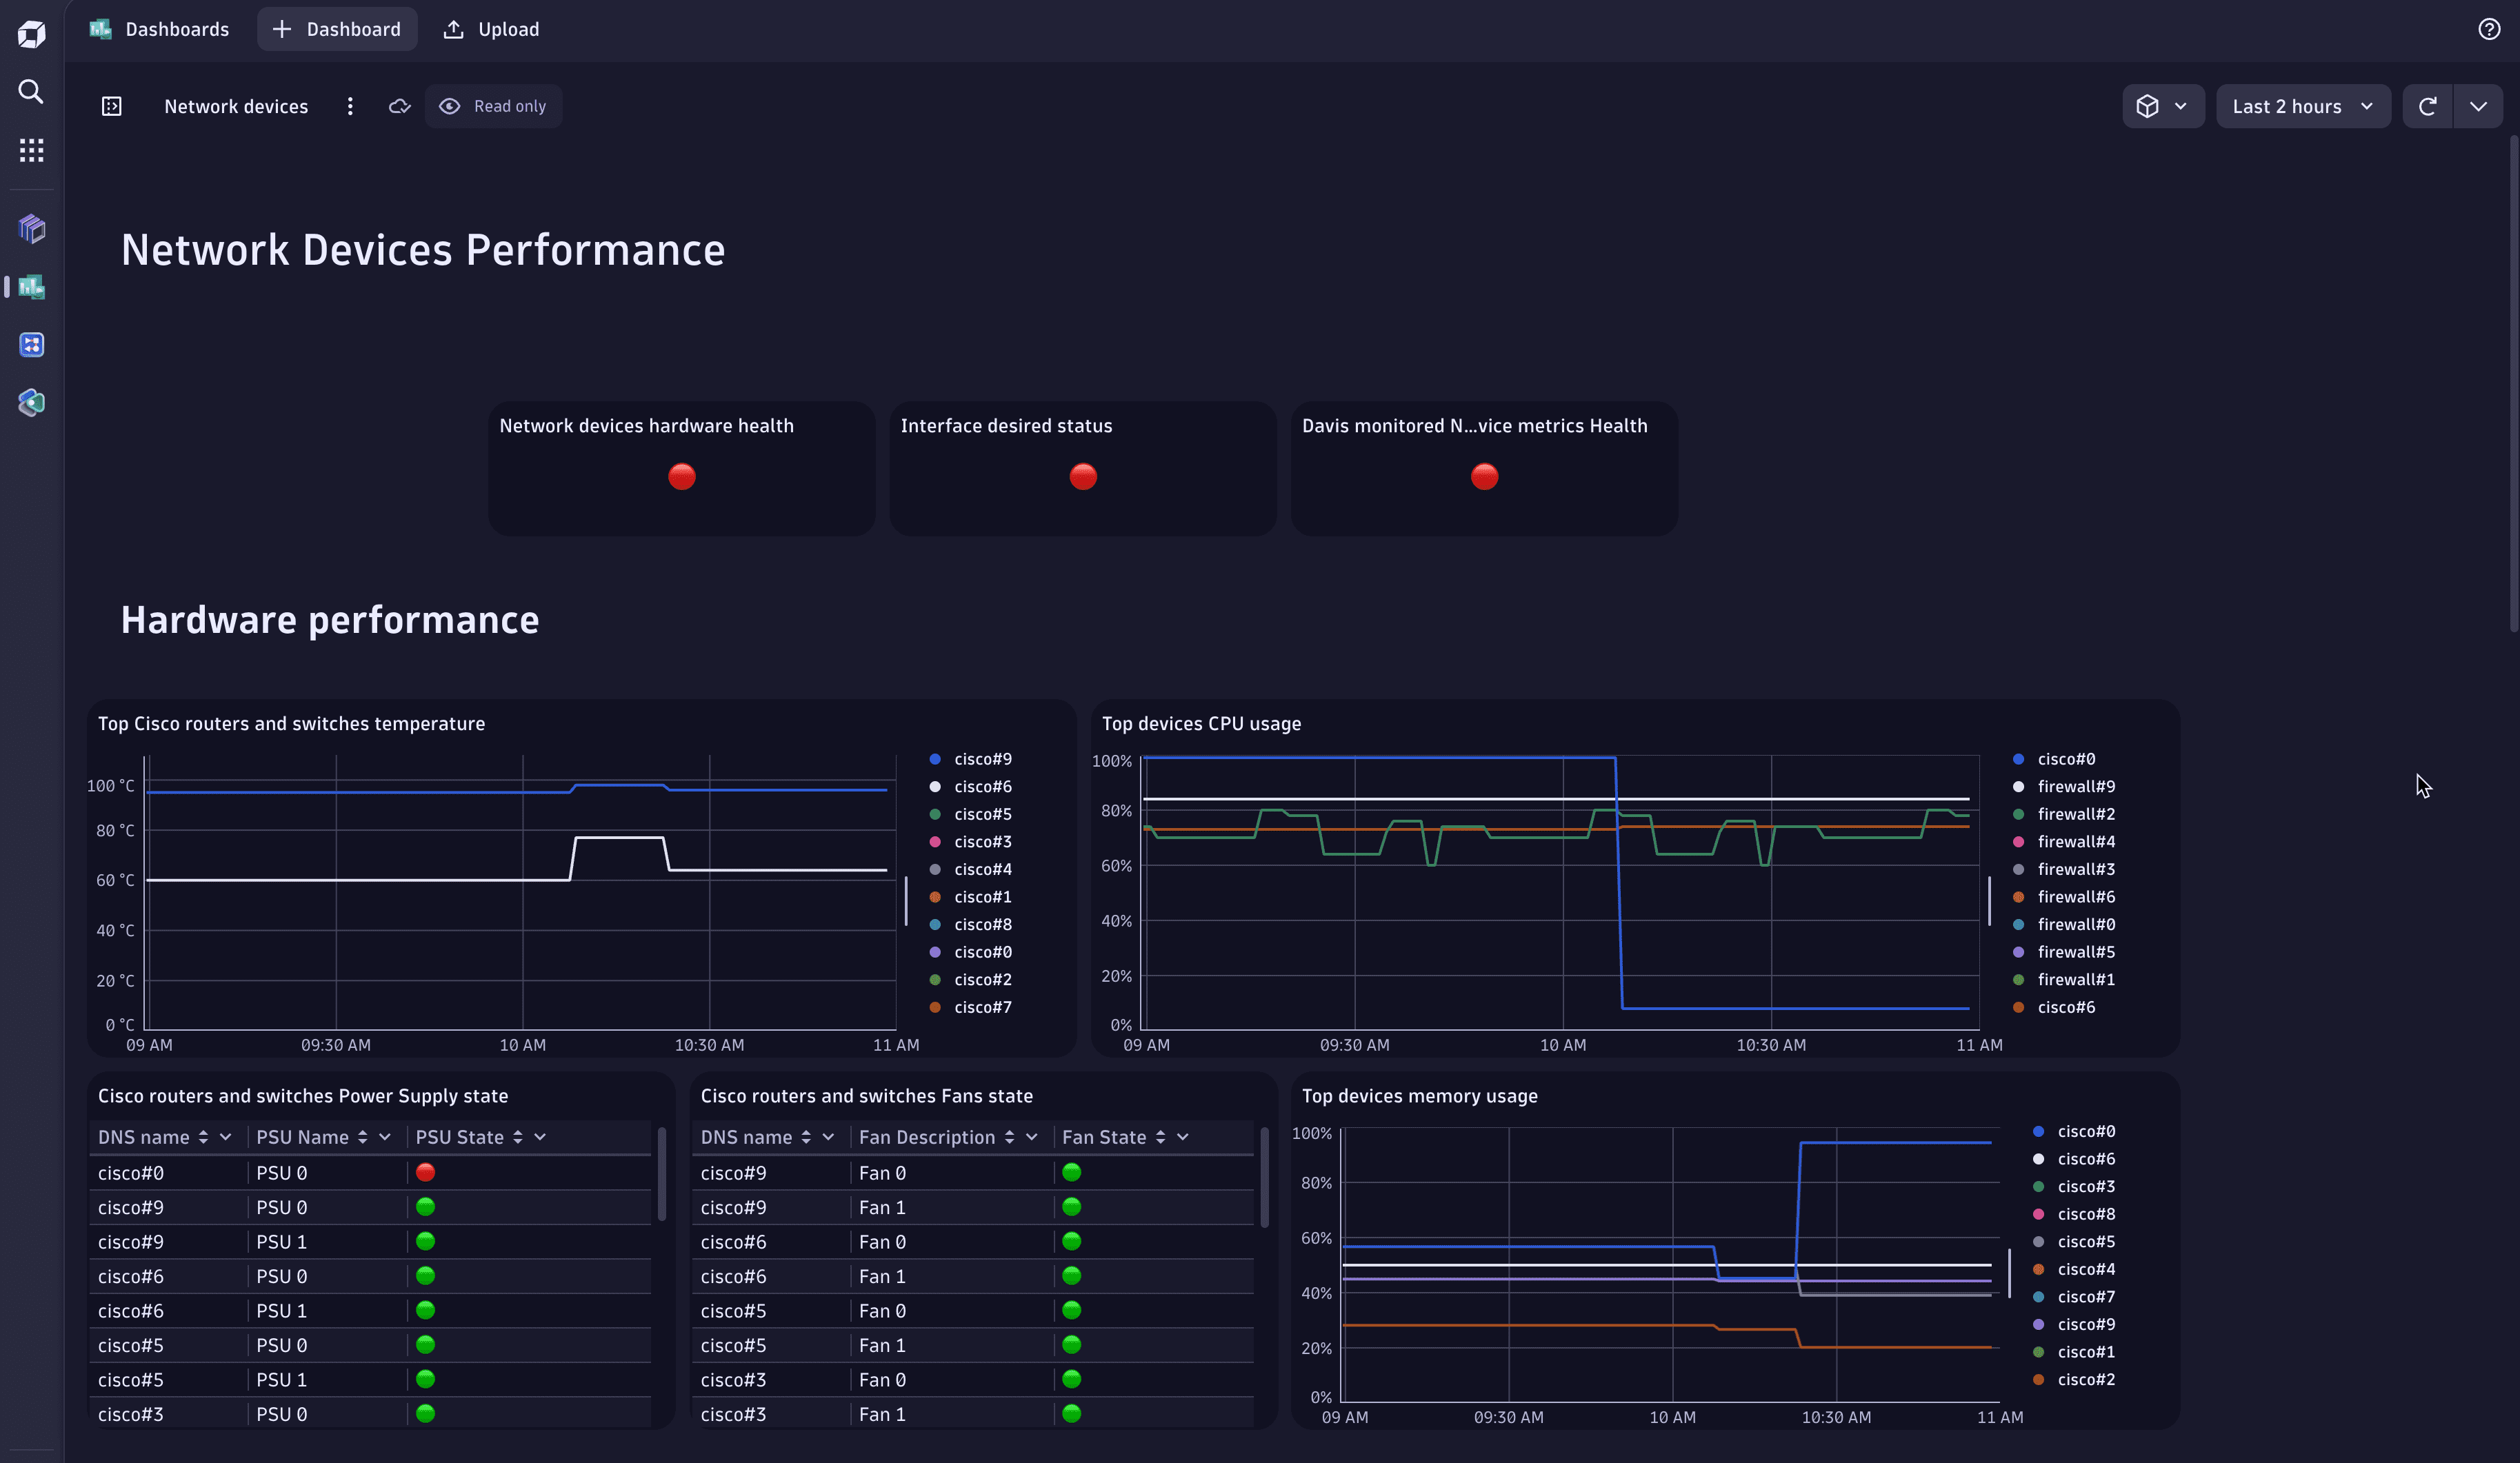
Network devices
Related Dynatrace app:  Infrastructure & Operations
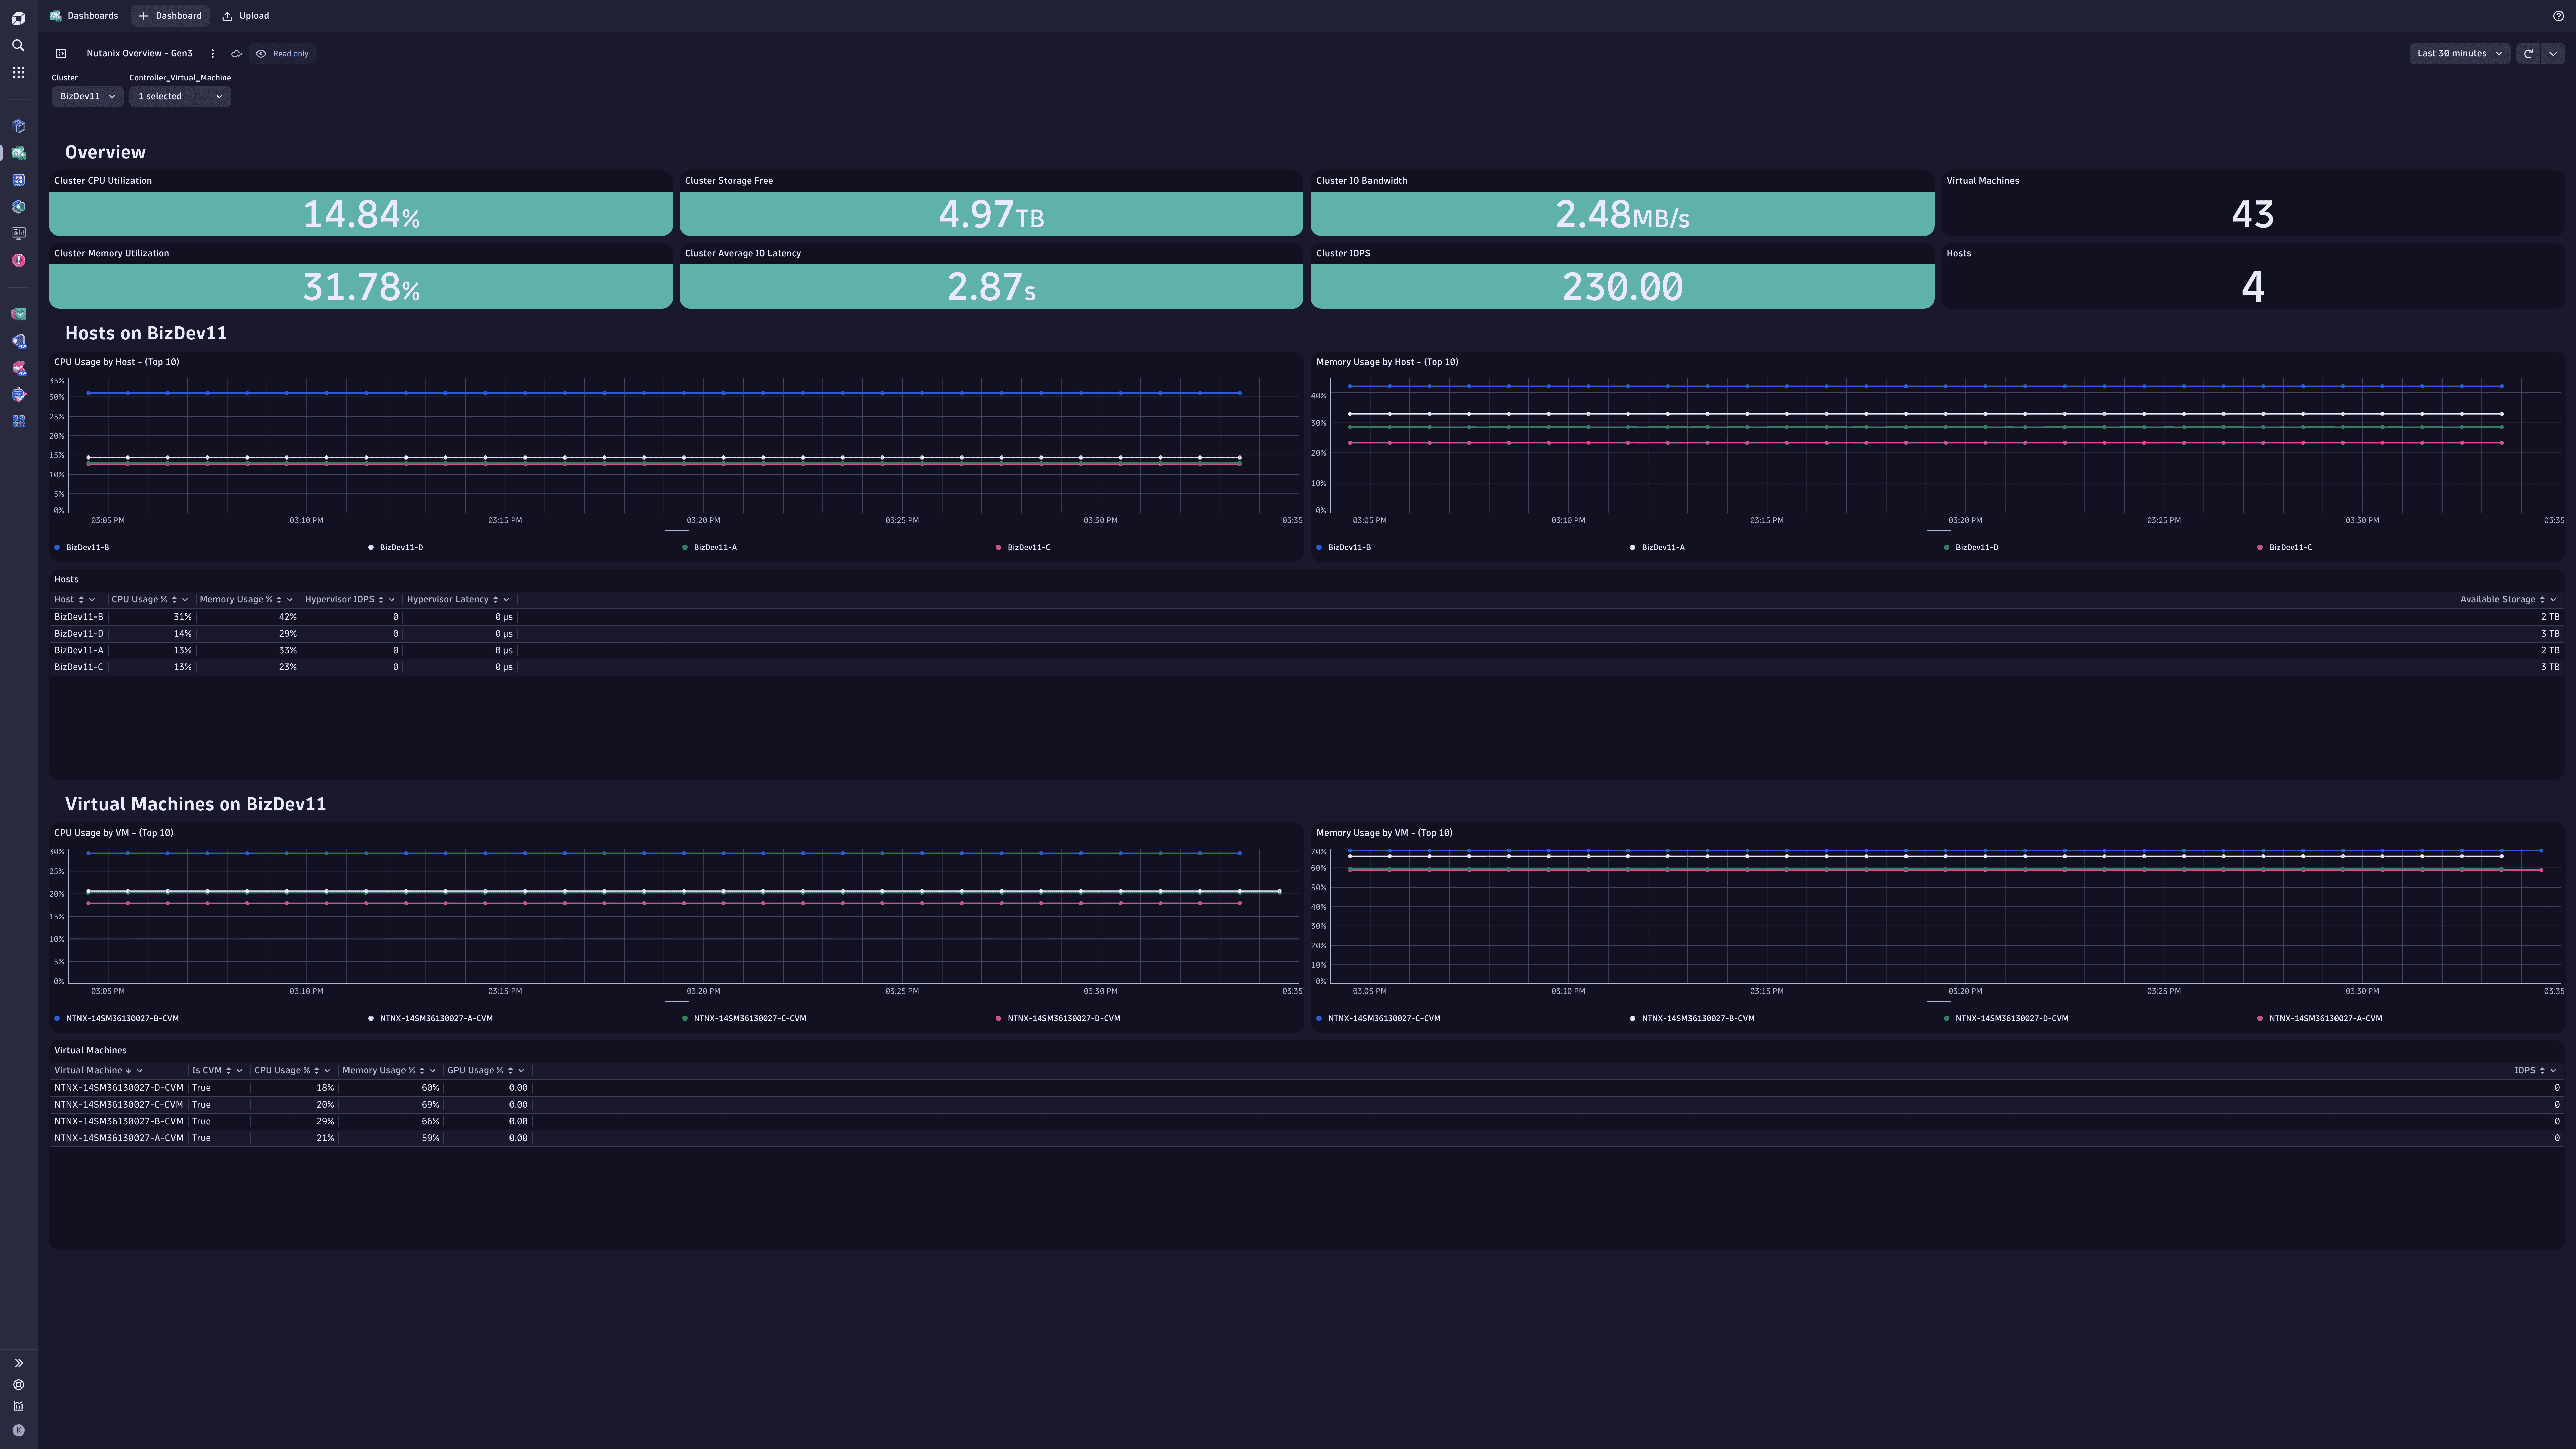
Nutanix Overview
Check the status of your Nutanix infrastructure, including performance, usage, and availability of key Nutanix resources.
Related Dynatrace app:  Extensions
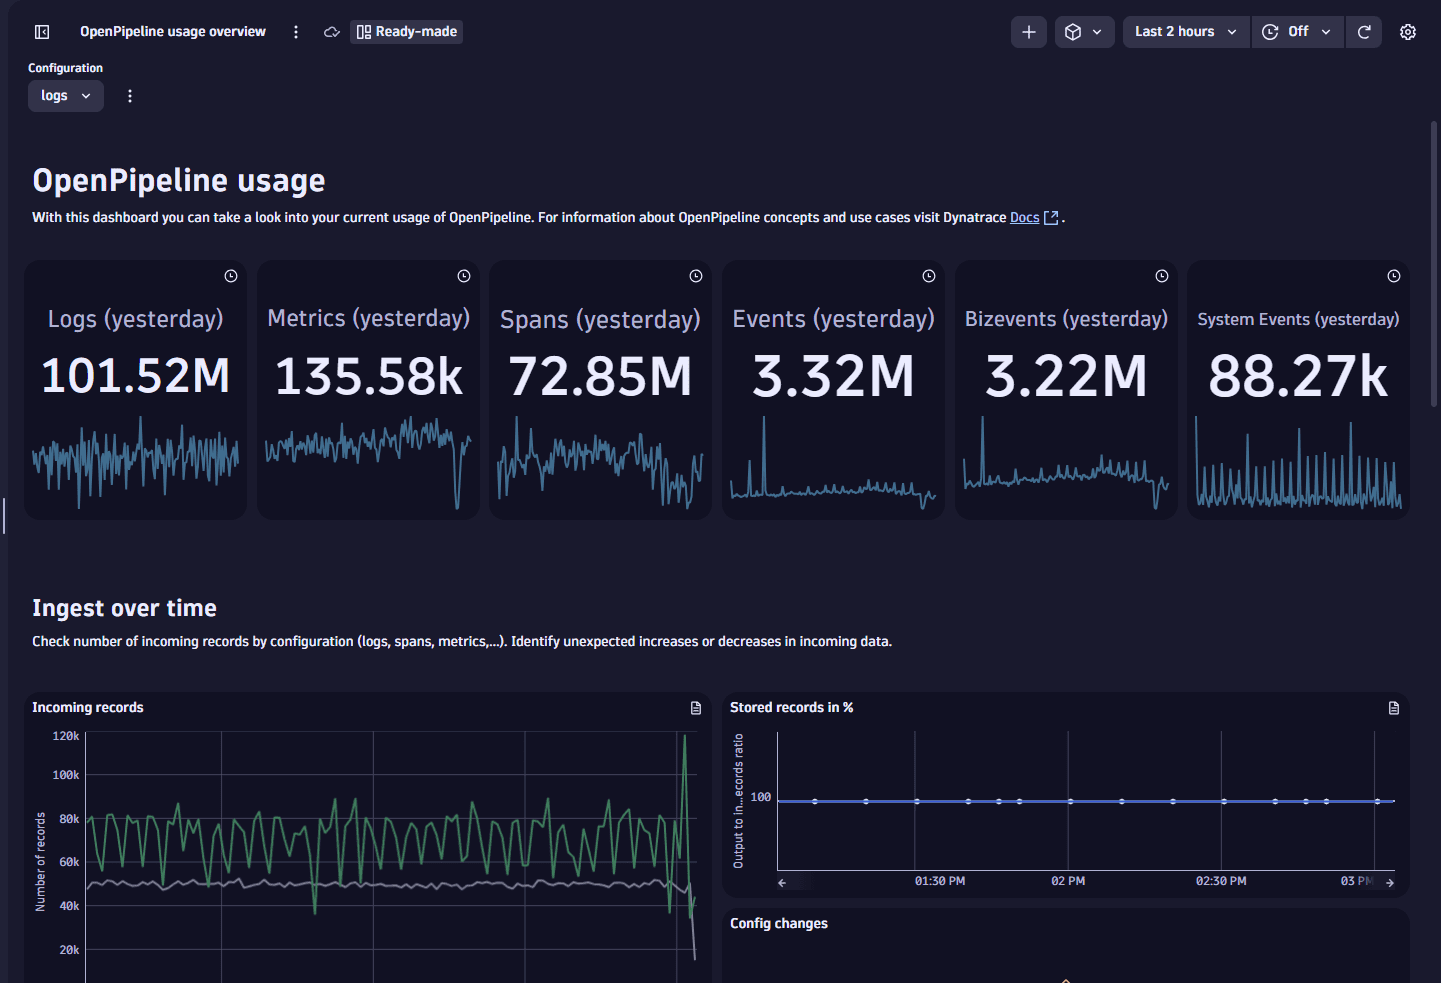
OpenPipeline usage overview
Offers an overview of your current usage of OpenPipeline (logs, metrics, spans, events, bizevents, and system events) and a breakdown by:
- Incoming records over time
- OpenPipeline processing compared to the classic log and business event processing pipelines
- Log ingest (where records come in, how they are routed, and in which buckets they are stored)
Related Dynatrace app:  OpenPipeline
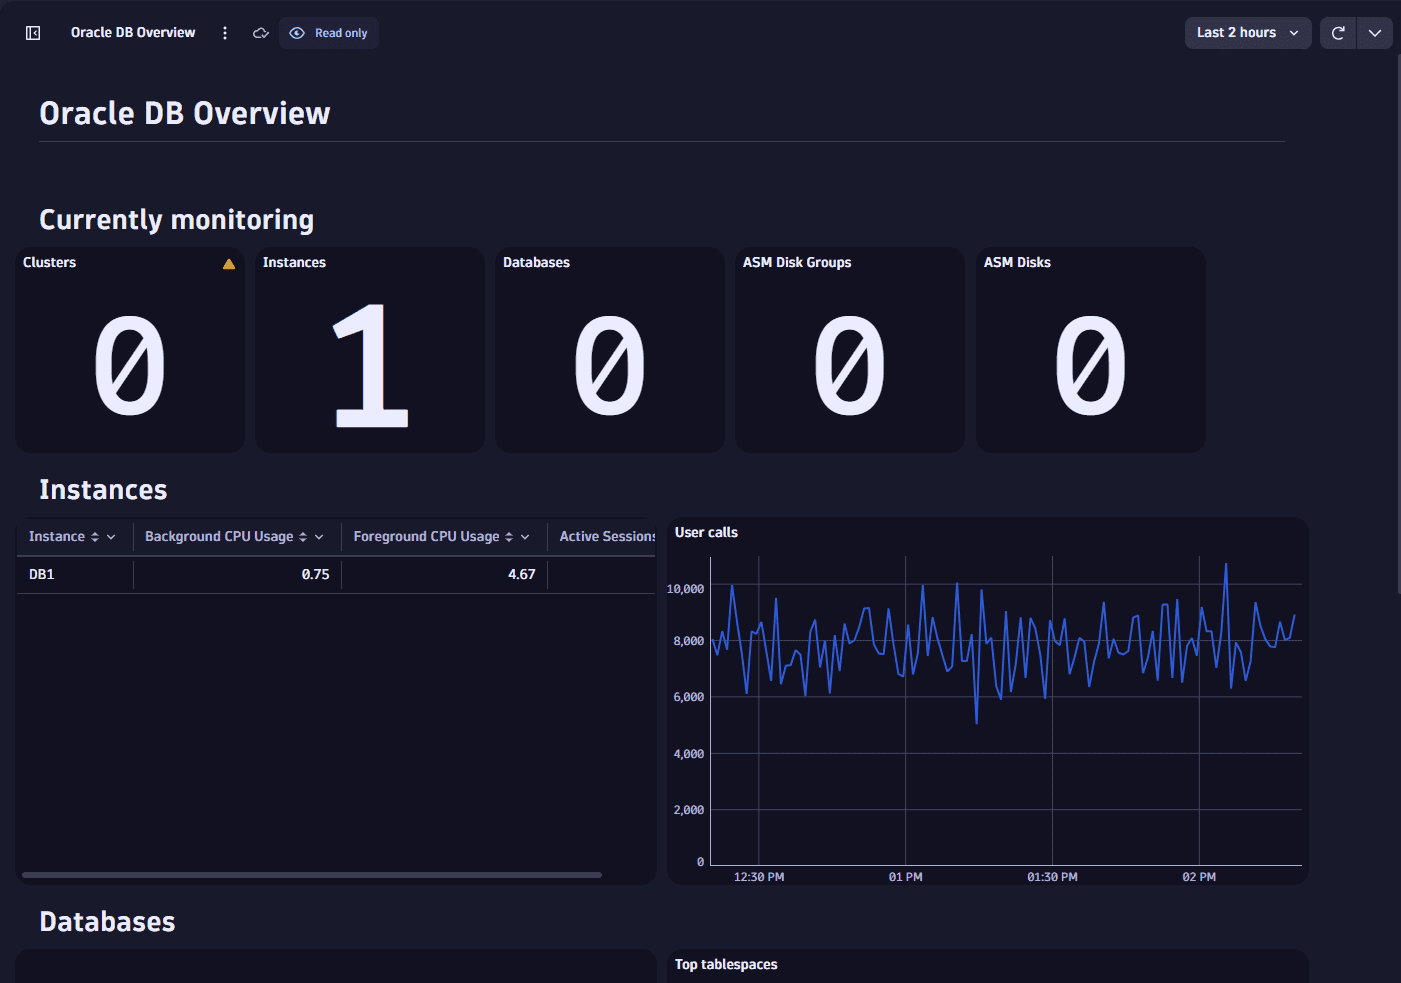
Oracle DB Overview
Browse the most important Oracle DB extension metrics and drill down into additional details.
Related Dynatrace app:  Extensions
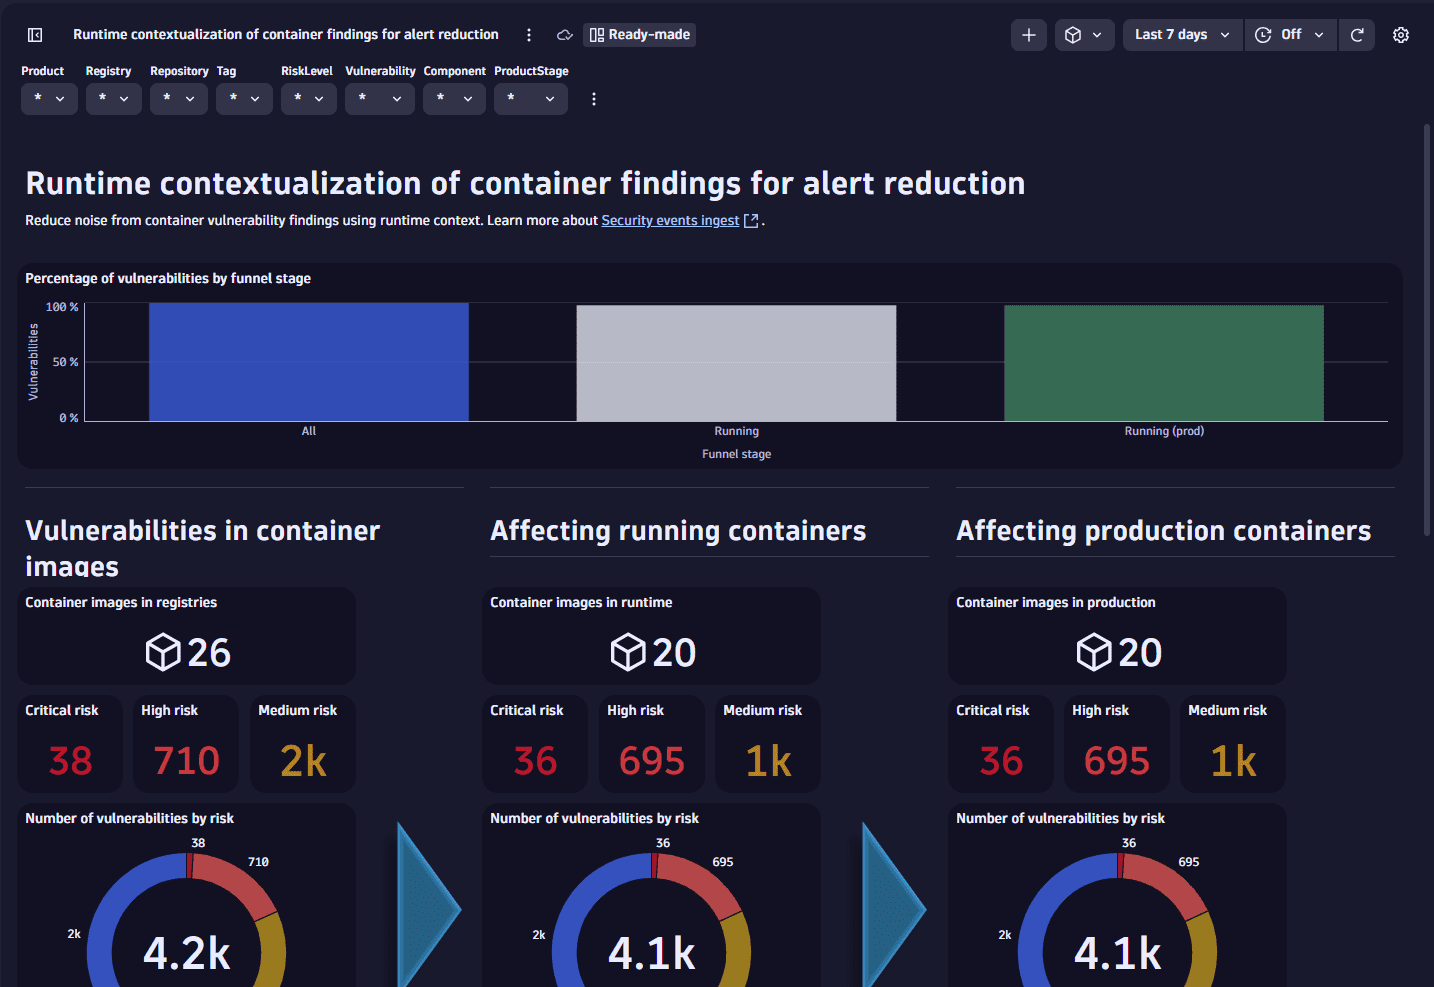
Runtime contextualization of container findings for alert reduction
Use this dashboard to reduce noise from container vulnerability findings using runtime context.
Related documentation: Security integrations
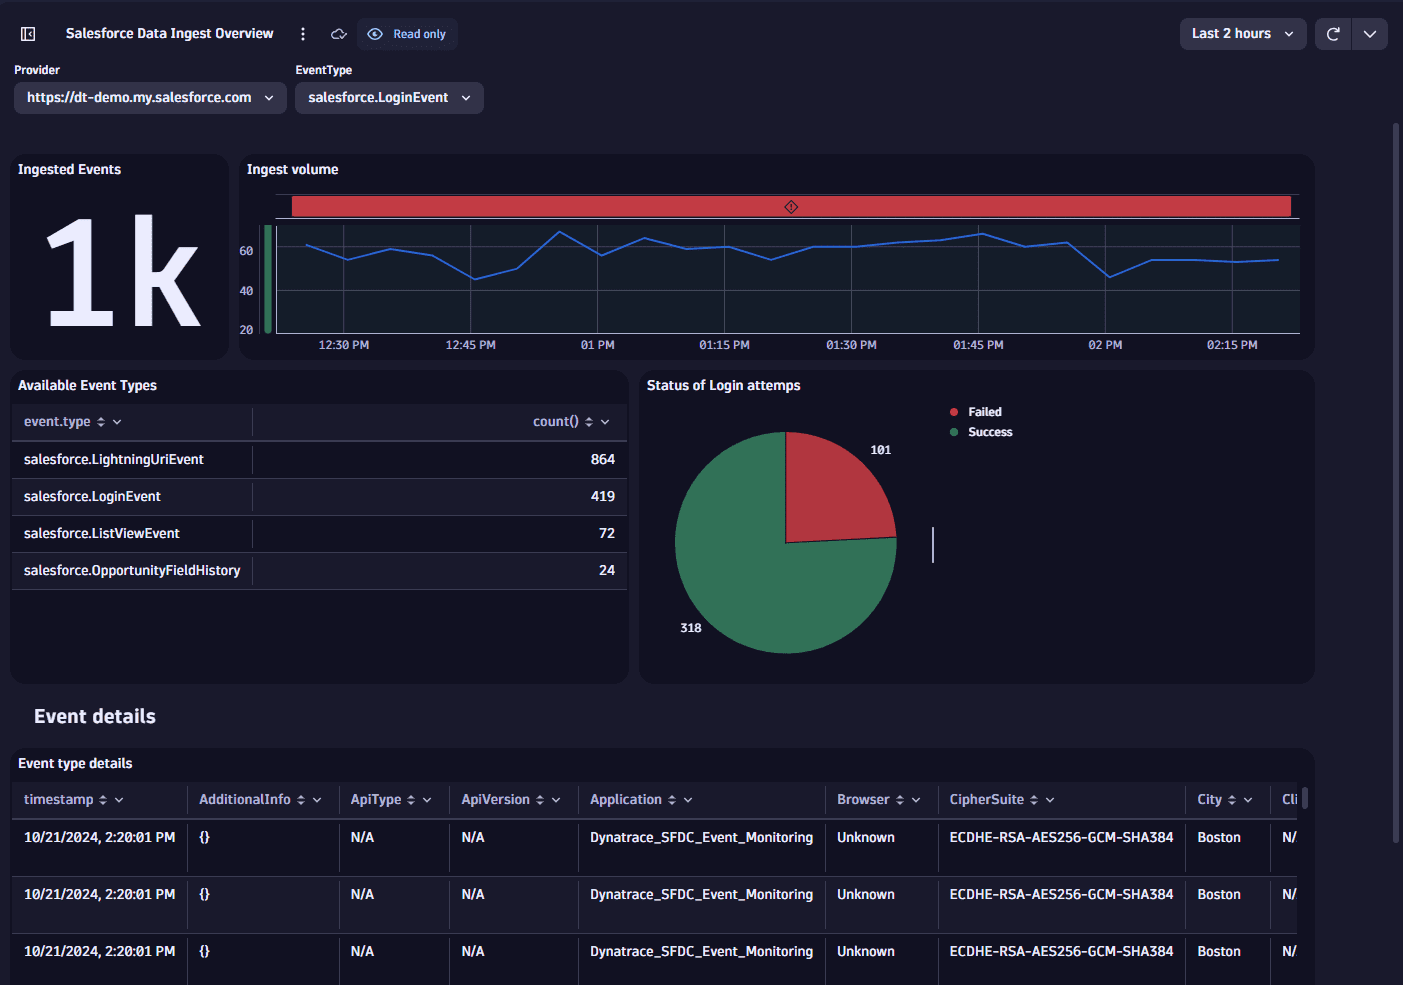
Salesforce Data Ingest Overview
Display basic information about ingest volume and available event types, with filtering for certain event types.
Related Dynatrace app:  Extensions
This dashboard has been removed from ready-made dashboards. To use it in your environment.
- Go to the dashboard using the Explore in Playground link above.
- Download the dashboard JSON from Playground.
- Upload the dashboard in your environment.
In upcoming releases, the extension-distributed dashboards will automatically appear among ready-made dashboards after you install the extensions in your environment.
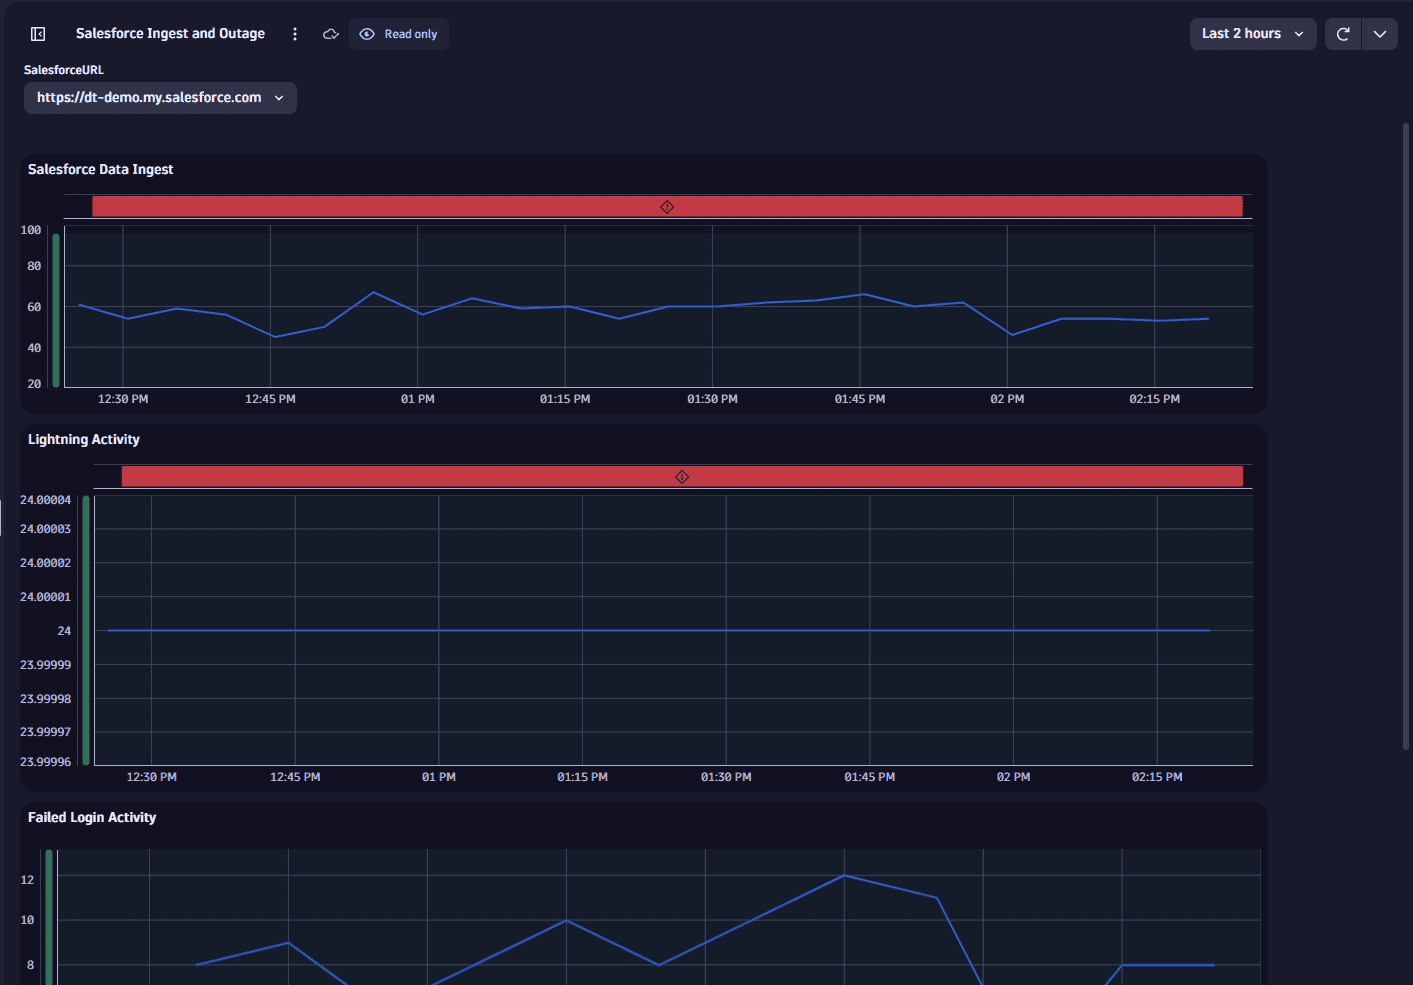
Salesforce Ingest and Outage
Use this dashboard to help identify potential salesforce outages.
Related Dynatrace app:  Extensions
This dashboard has been removed from ready-made dashboards. To use it in your environment.
- Go to the dashboard using the Explore in Playground link above.
- Download the dashboard JSON from Playground.
- Upload the dashboard in your environment.
In upcoming releases, the extension-distributed dashboards will automatically appear among ready-made dashboards after you install the extensions in your environment.
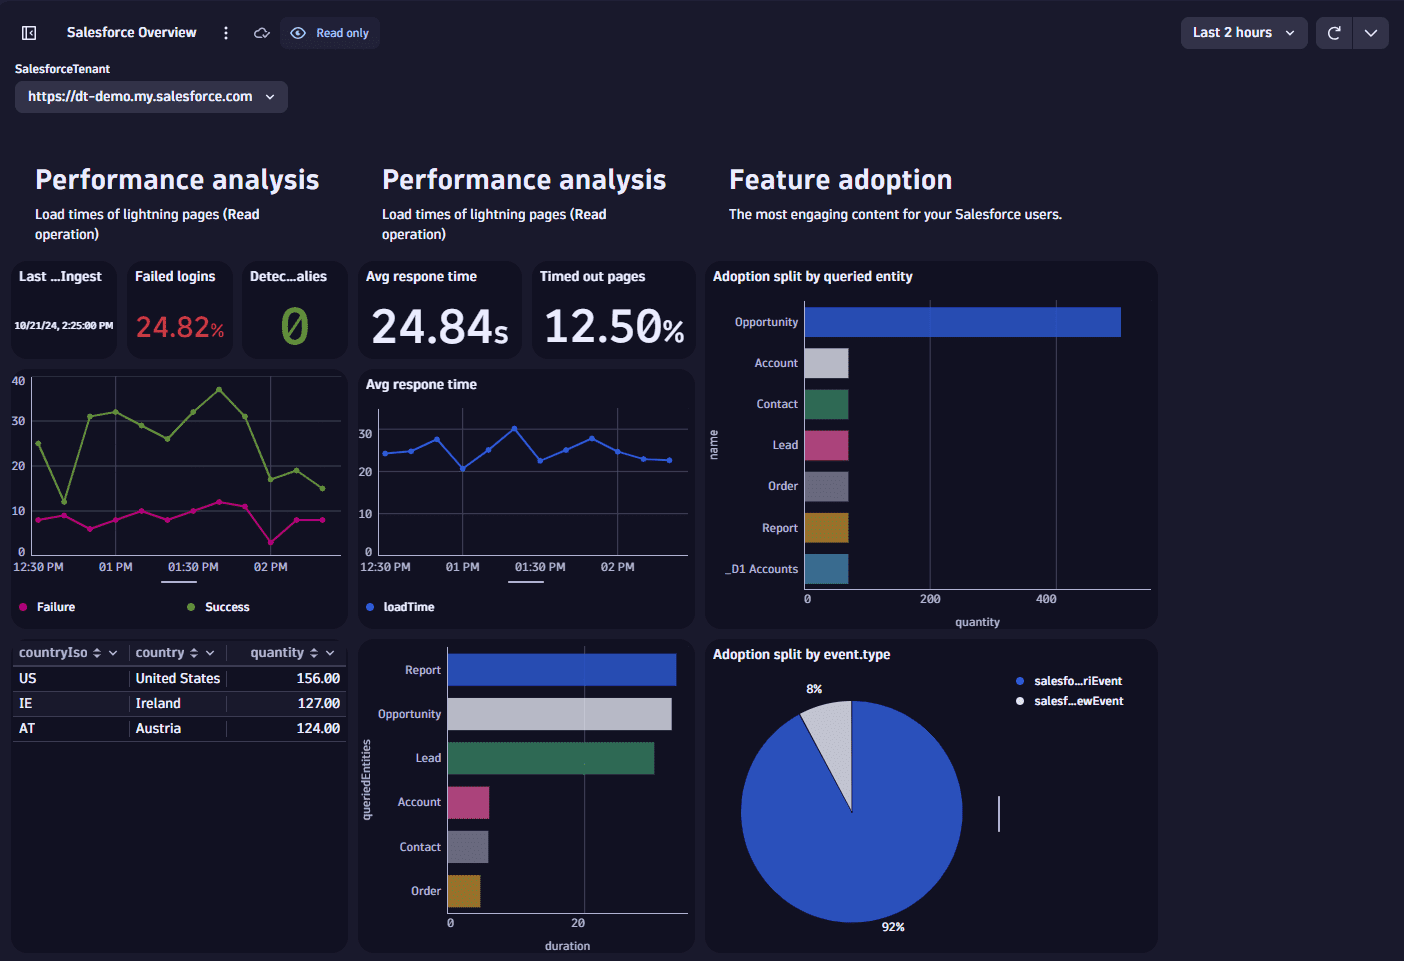
Salesforce Overview
Get an overview of Salesforce Event Streaming performance and adoption metrics .
Related Dynatrace app:  Extensions
This dashboard has been removed from ready-made dashboards. To use it in your environment.
- Go to the dashboard using the Explore in Playground link above.
- Download the dashboard JSON from Playground.
- Upload the dashboard in your environment.
In upcoming releases, the extension-distributed dashboards will automatically appear among ready-made dashboards after you install the extensions in your environment.
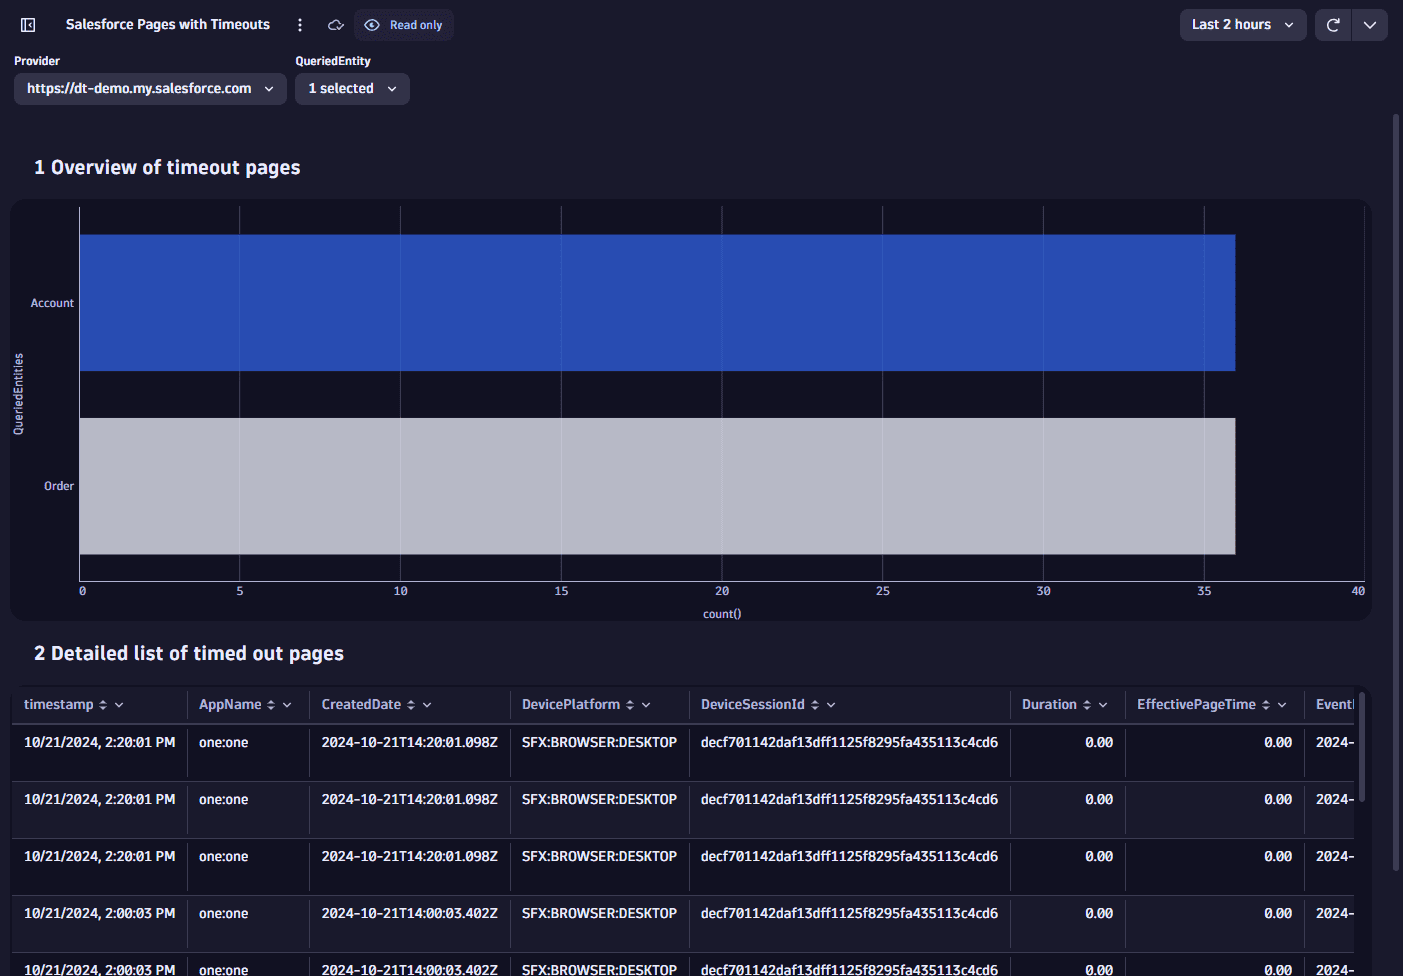
Salesforce Pages with Timeouts
Use this dashboard to perform detailed analysis on pages with a load time of more than 60 seconds.
Related Dynatrace app:  Extensions
This dashboard has been removed from ready-made dashboards. To use it in your environment.
- Go to the dashboard using the Explore in Playground link above.
- Download the dashboard JSON from Playground.
- Upload the dashboard in your environment.
In upcoming releases, the extension-distributed dashboards will automatically appear among ready-made dashboards after you install the extensions in your environment.
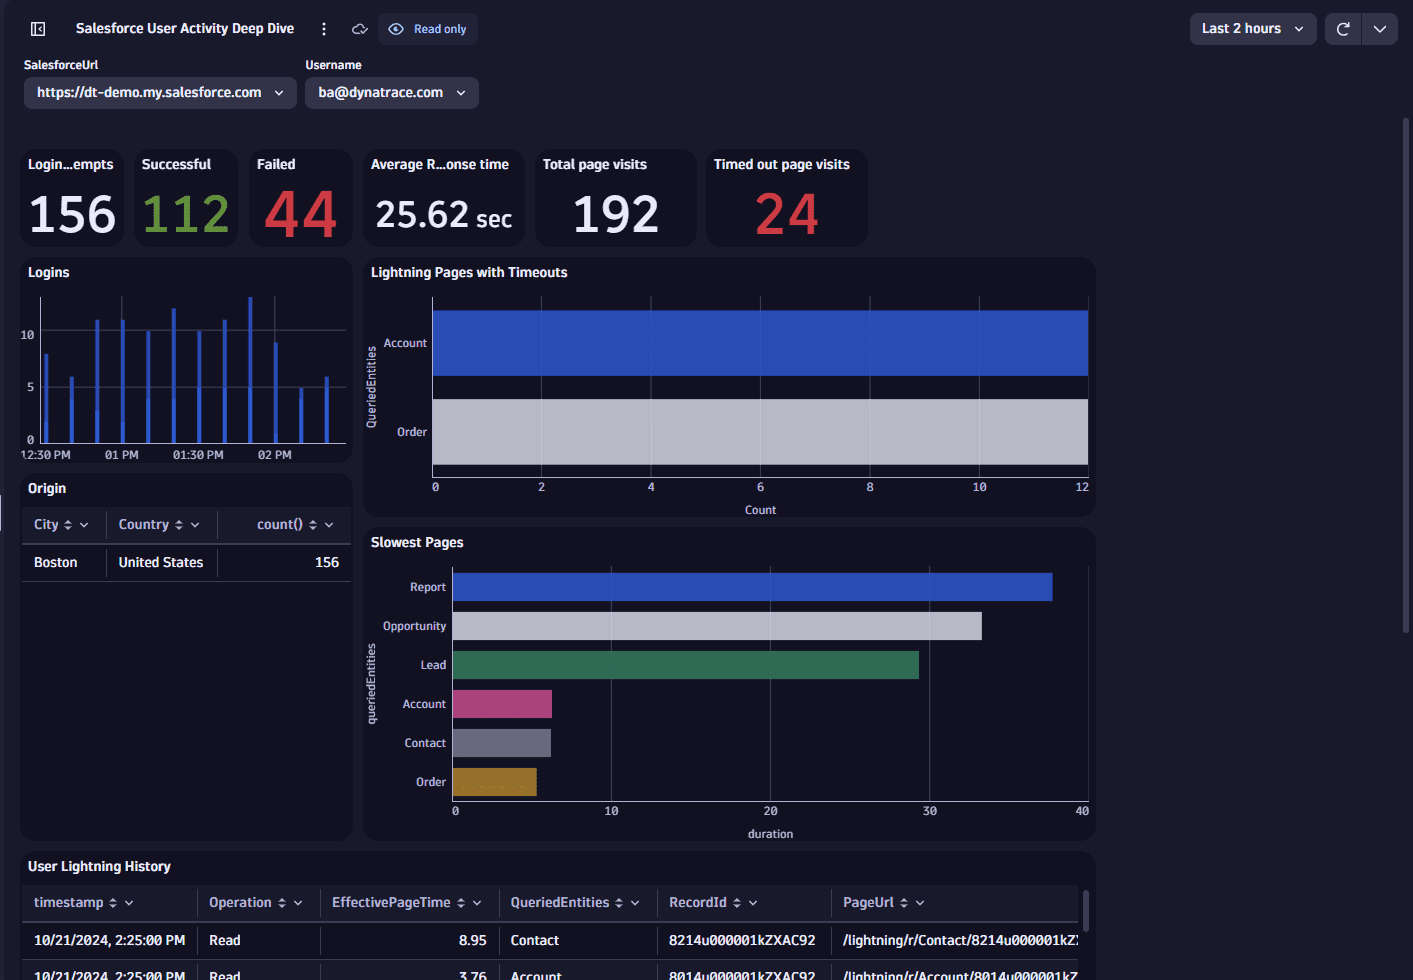
Salesforce User Activity Deep Dive
Details for performance and actions of a specific user for the Salesforce Event Streaming extension.
Related Dynatrace app:  Extensions
This dashboard has been removed from ready-made dashboards. To use it in your environment.
- Go to the dashboard using the Explore in Playground link above.
- Download the dashboard JSON from Playground.
- Upload the dashboard in your environment.
In upcoming releases, the extension-distributed dashboards will automatically appear among ready-made dashboards after you install the extensions in your environment.
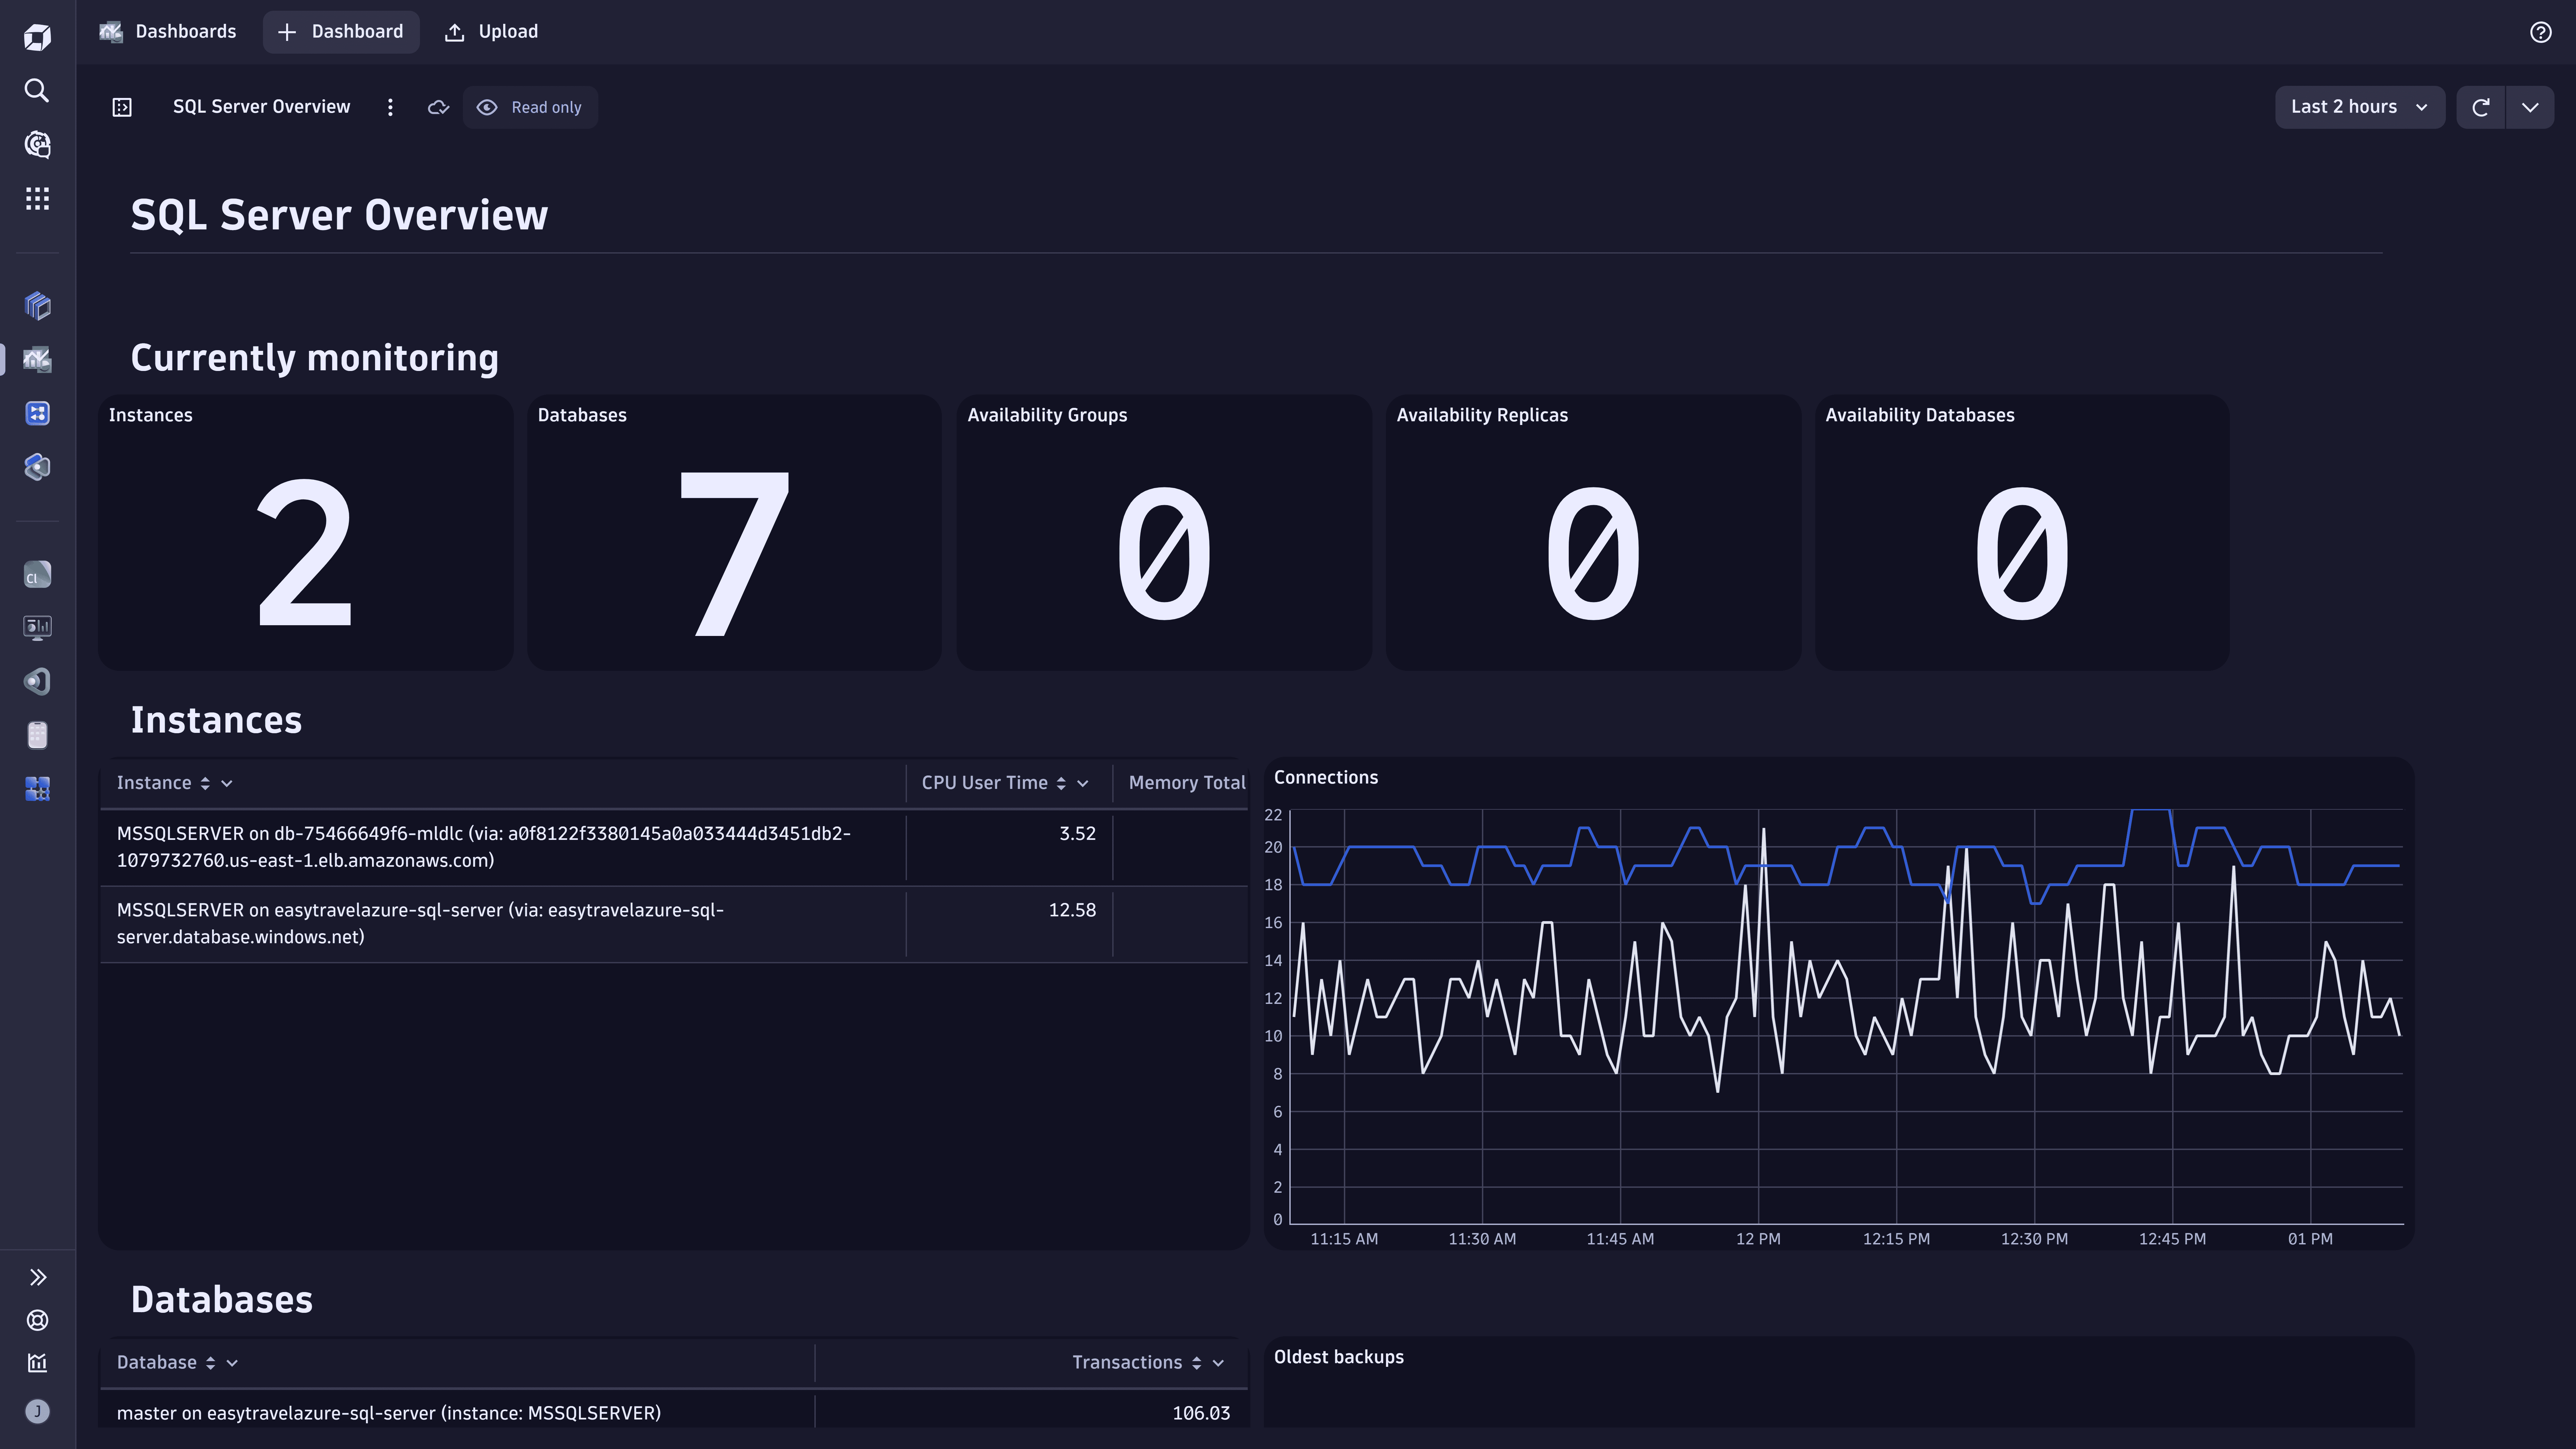
SQL Server Overview
Browse the most important SQL Server extension metrics and drill down into additional details .
Related Dynatrace app:  Extensions
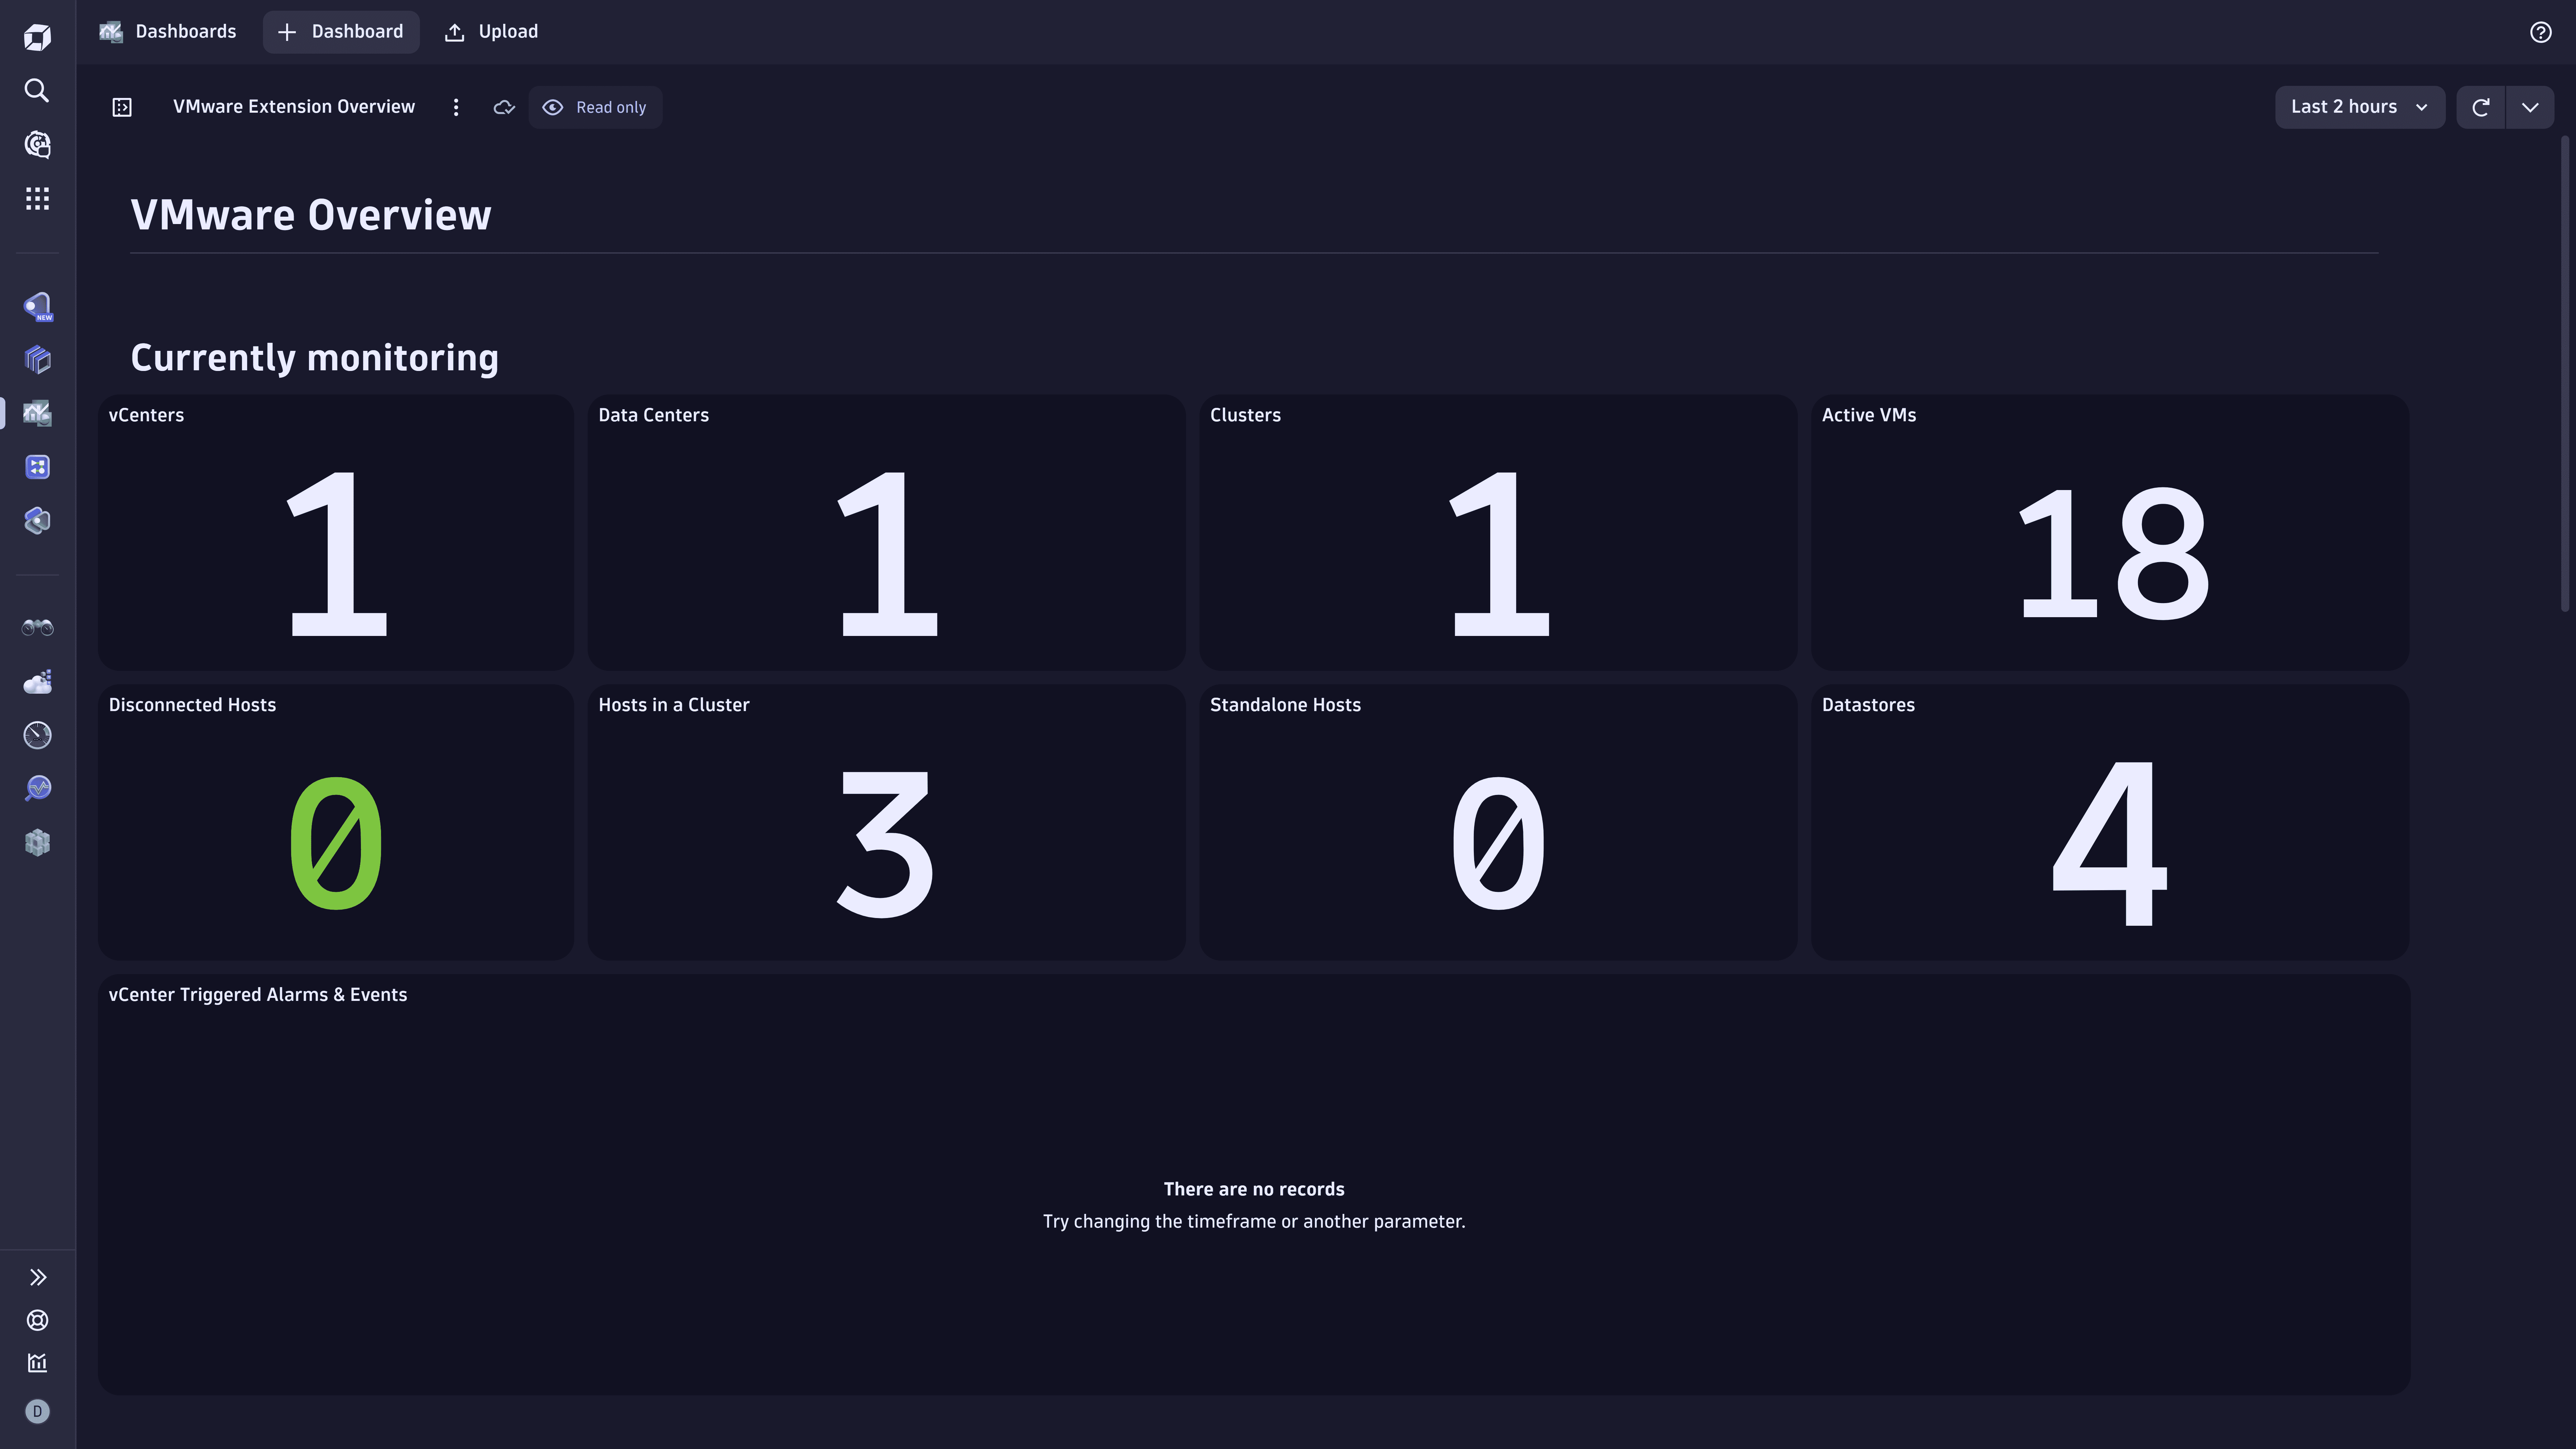
VMware Extension Overview
Displays overview information about your VMware vCenter, including entity metrics and events.
Related Dynatrace app:  Extensions
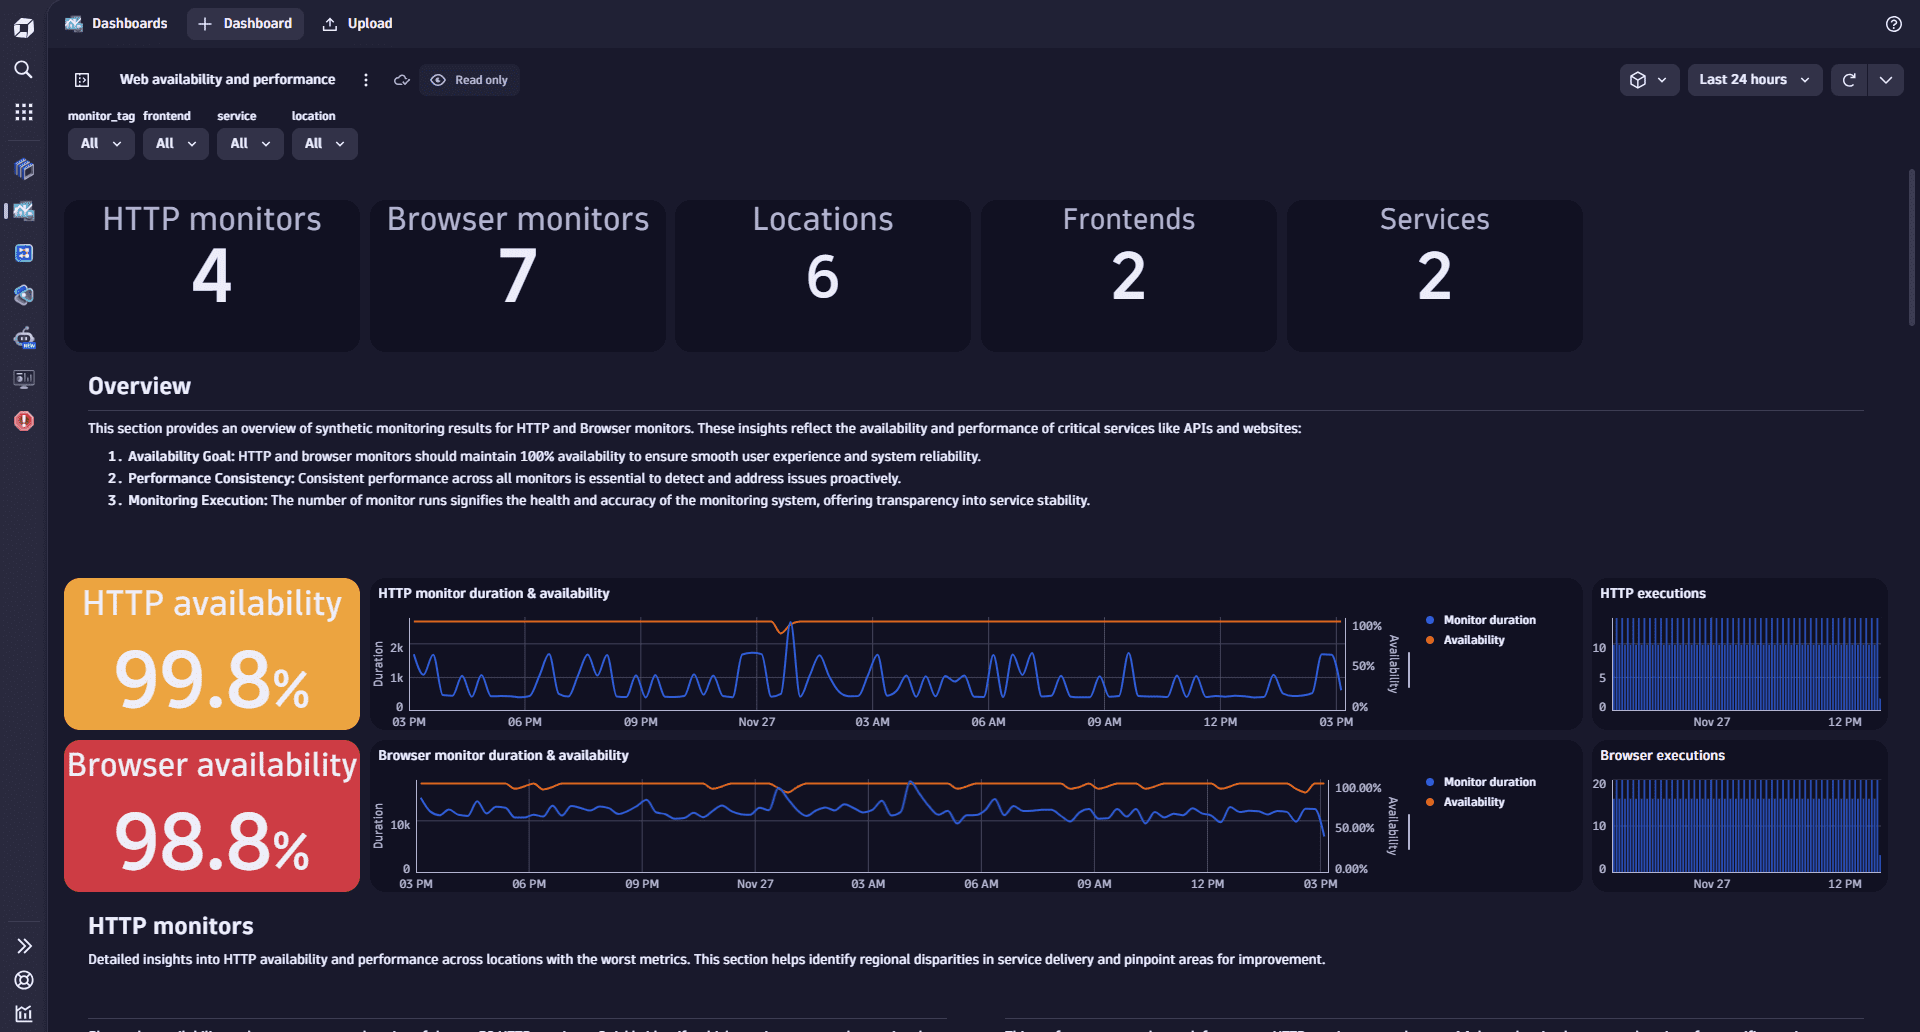
Web availability and performance
Gain insights into the health of critical APIs and front-ends to ensure seamless user experience and offering transparency to address issues proactively. Following an overview, dashboard sections focus on HTTP monitors and browser monitors.
Related Dynatrace app:  Synthetic
