Group dashboard tiles into rows
- Latest Dynatrace
- How-to guide
- 6-min read
- Published Oct 20, 2026
A row is a full-width container for a group of tiles. You can give it a title and a color, and collapse it when you don't need those tiles. Tiles in a collapsed row don't run their queries until the row is expanded.
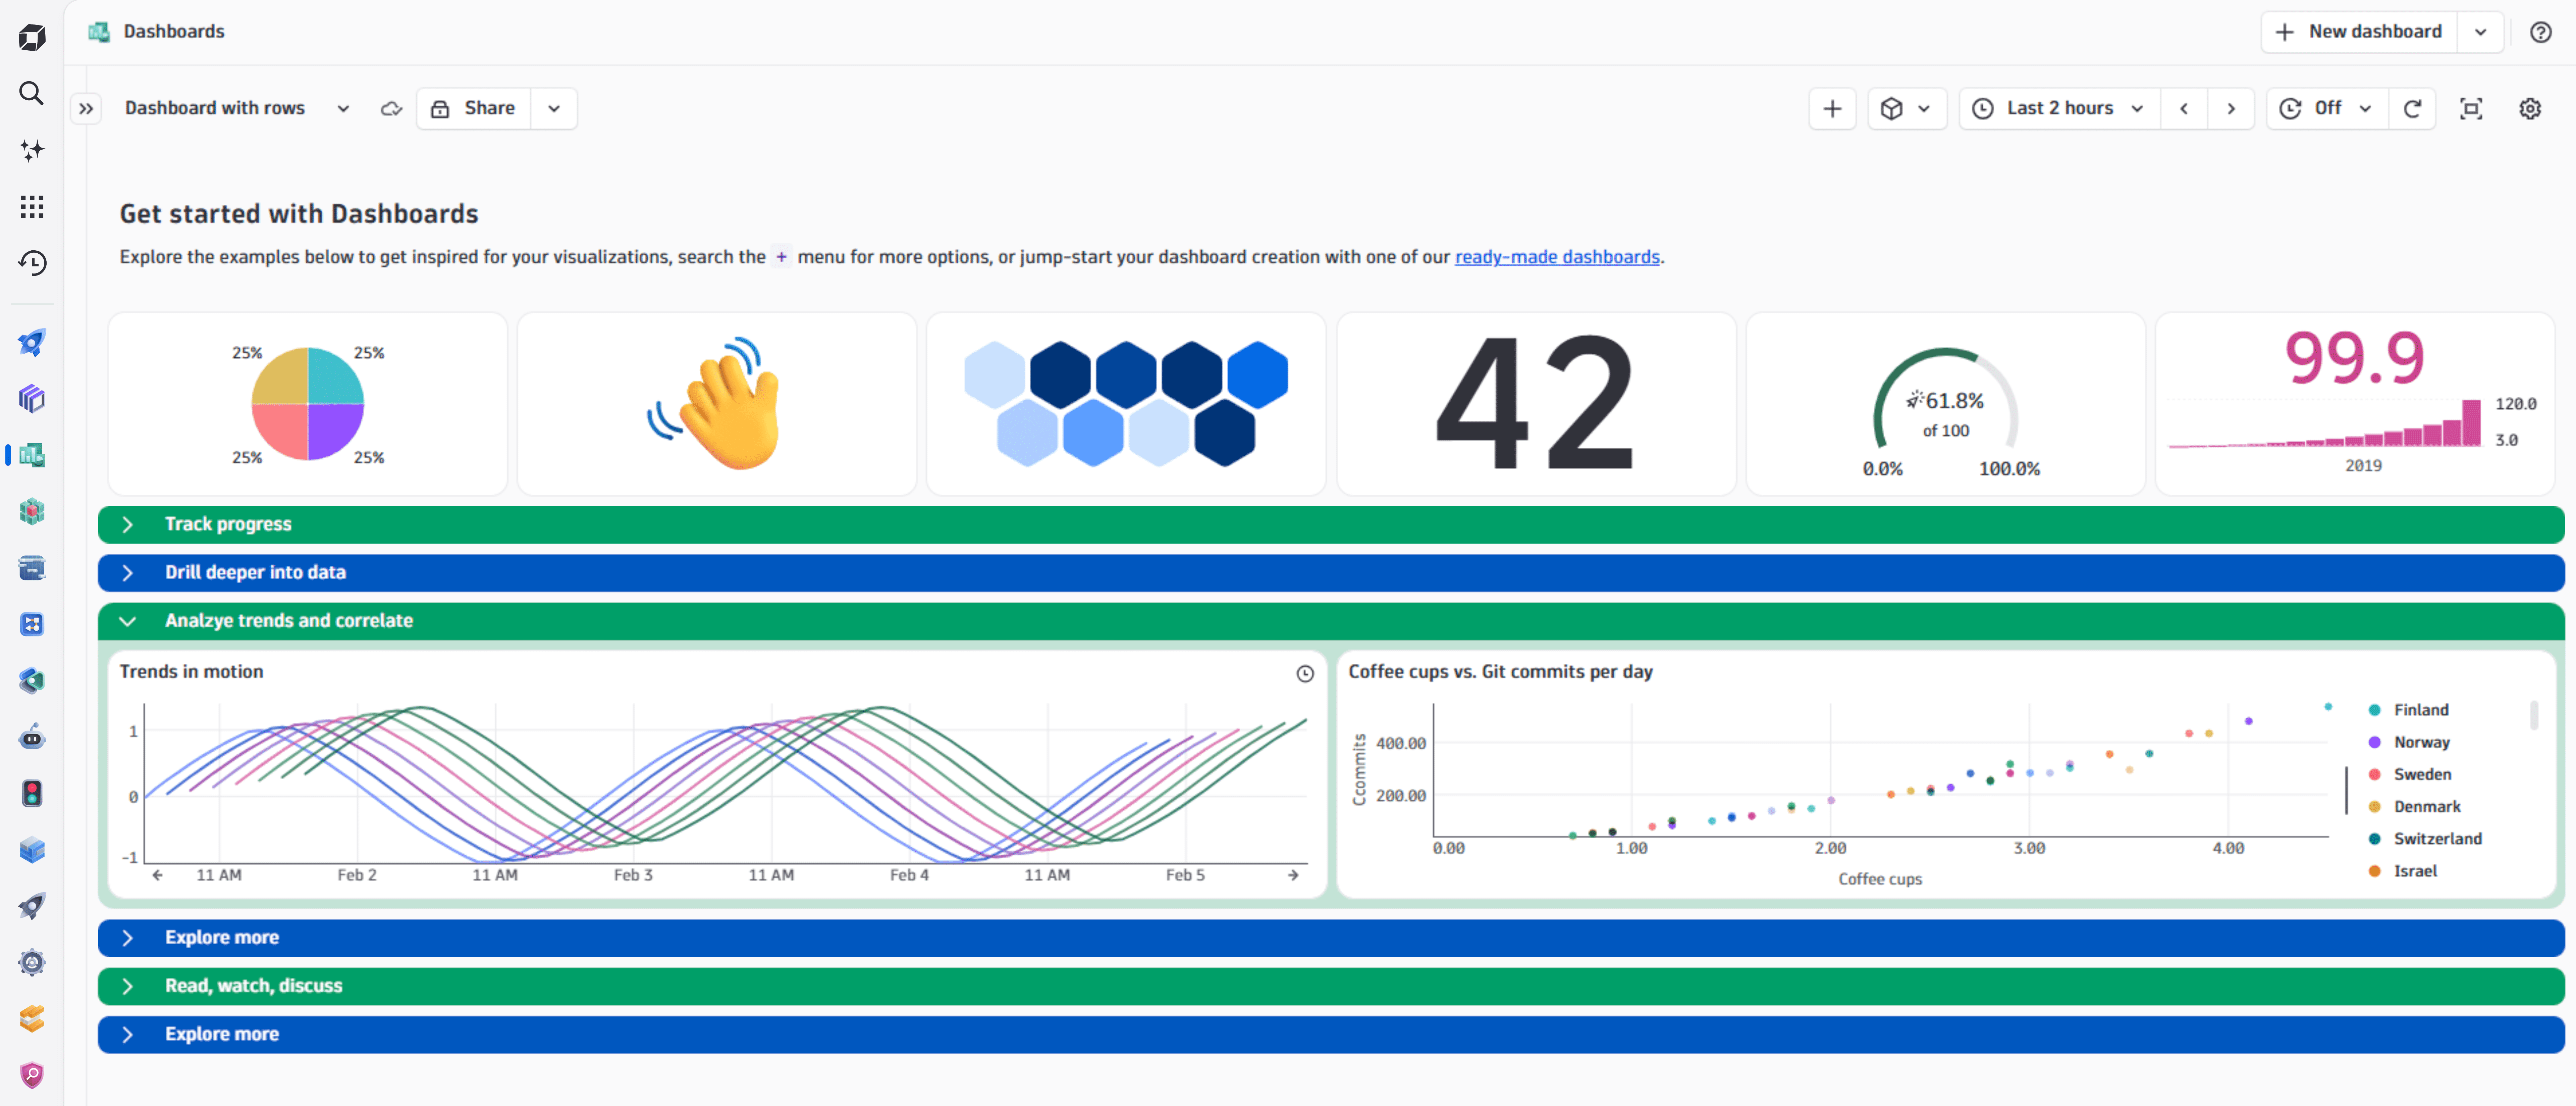
Why use rows
- Keep related tiles together on one dashboard instead of splitting them across several, so you only have one set of variables to maintain.
- Give each part of a dashboard its own title and, optionally, a color. You no longer need a Markdown tile as a section heading.
- Collapse the parts you don't need right now. Because collapsed rows skip their queries, this also helps with load time and query cost.
How rows work
- Tiles that aren't in a row sit at the top of the dashboard, above the first row. Tiles can't sit between rows or below the last row.
- Each row has a title and an optional description, and holds one or more tiles.
- Rows are collapsed by default when someone opens the dashboard. To change this for a row, use its Default state setting.
Create a row
To create an empty row
-
In the upper-right of the dashboard, open the (Add) menu.
-
Select Row, or press Shift+R.
The new row is empty and shows the Add tile to row button.
To create a row from a single tile
-
Select the tile to display the tile command bar.
-
Open the (More actions) menu and select Add to new row.
The tile moves into a new row.
To create a row from multiple tiles
-
Select the tiles you want to group: hold Ctrl (Windows, Linux) or Cmd (macOS) and select each tile. To select multiple tiles with the keyboard, see Use shortcuts.
-
In the tile command bar, open the Rows menu and select Add to new row.
The selected tiles move into a new row.
Add tiles to a row
- To add a new tile, select Add tile to row in an empty row, or select in the row header, and then choose the type of tile.
- To add existing tiles, follow the steps in Move tiles into a row.
Move tiles into a row
To move a single tile into a row
- Select the tile to display the tile command bar.
- Open the (More actions) menu, select Move to row, and then select the target row.
To move multiple tiles into a row at the same time
- Select the tiles you want to move: hold Ctrl (Windows, Linux) or Cmd (macOS) and select each tile. To select multiple tiles with the keyboard, see Use shortcuts.
- In the tile command bar, open the Rows menu and, under Move to row, select the target row.
If a tile is already in a row, the Rows menu highlights its current row.
Remove tiles from a row
To remove a single tile from a row
- Select the tile to display the tile command bar.
- Open the (More actions) menu and select Remove from row.
To remove multiple tiles from a row at the same time
- Select the tiles you want to remove: hold Ctrl (Windows, Linux) or Cmd (macOS) and select each tile. To select multiple tiles with the keyboard, see Use shortcuts.
- In the tile command bar, open the Rows menu and select Remove from row.
The tiles leave the row but stay on the dashboard. To delete tiles instead, see Delete a tile.
Collapse or expand a row
The row header indicates whether the row is expanded or collapsed .
- When you're editing the dashboard, select or to expand or collapse a row.
- When you aren't editing the dashboard, you can select anywhere in a row header to expand or collapse that row.
Edit a row
-
In the row header, open the menu and select Edit.
The row settings panel opens on the right.
-
In the box at the top of the panel, enter a title for the row.
-
Optional Under Description, enter a description. To format it, use the Markdown toolbar.
-
Set the Row display settings.
If a side panel is already open, you can select any row header to show that row's settings in the panel.
Row display settings
In the row settings panel, expand Display settings to change how the row looks and behaves.
| Setting | What it does |
|---|---|
Color | Off by default. Turn it on and select a color. The header uses the color, and the body uses a subdued shade of it. |
Default state | Collapsed or Expanded. Sets whether the row is collapsed or expanded when someone opens the dashboard. The Default state is Collapsed for a new row. |
Reorder or delete a row
In the row header, open the menu and select:
- Move up or Move down to change the row's position among the other rows.
- Delete to remove the row.
Learn more
- Dashboard tiles and filters for the basics of adding tiles to a dashboard
- Add a variable to a dashboard for filtering tiles with variables